
Simulation · Minimal Organization · Money and insurance
Insurance company
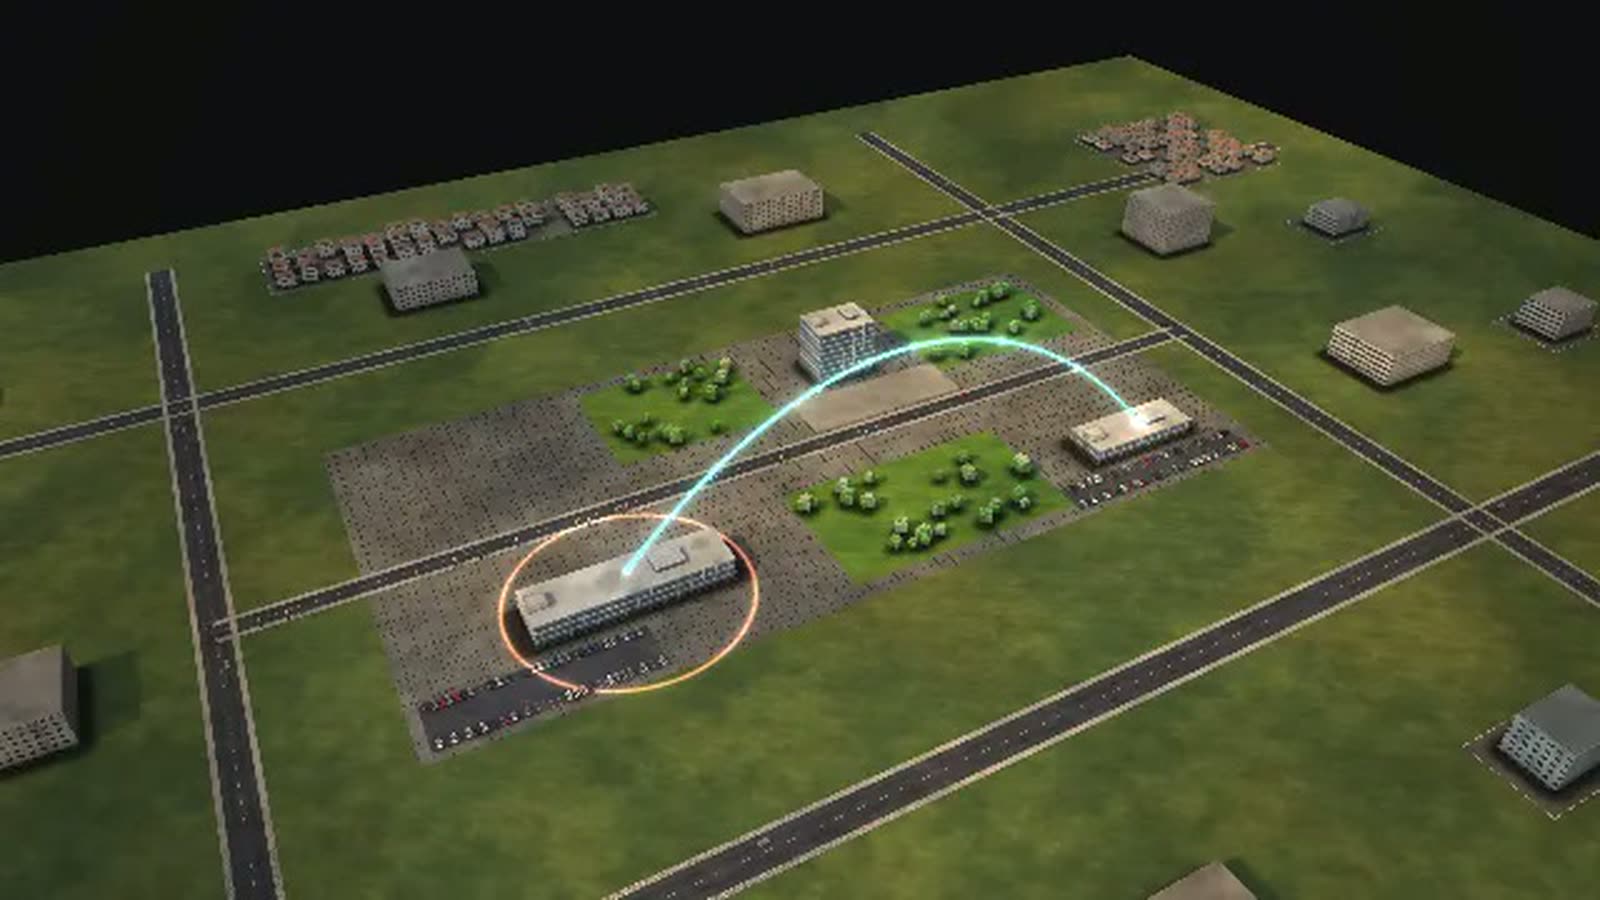
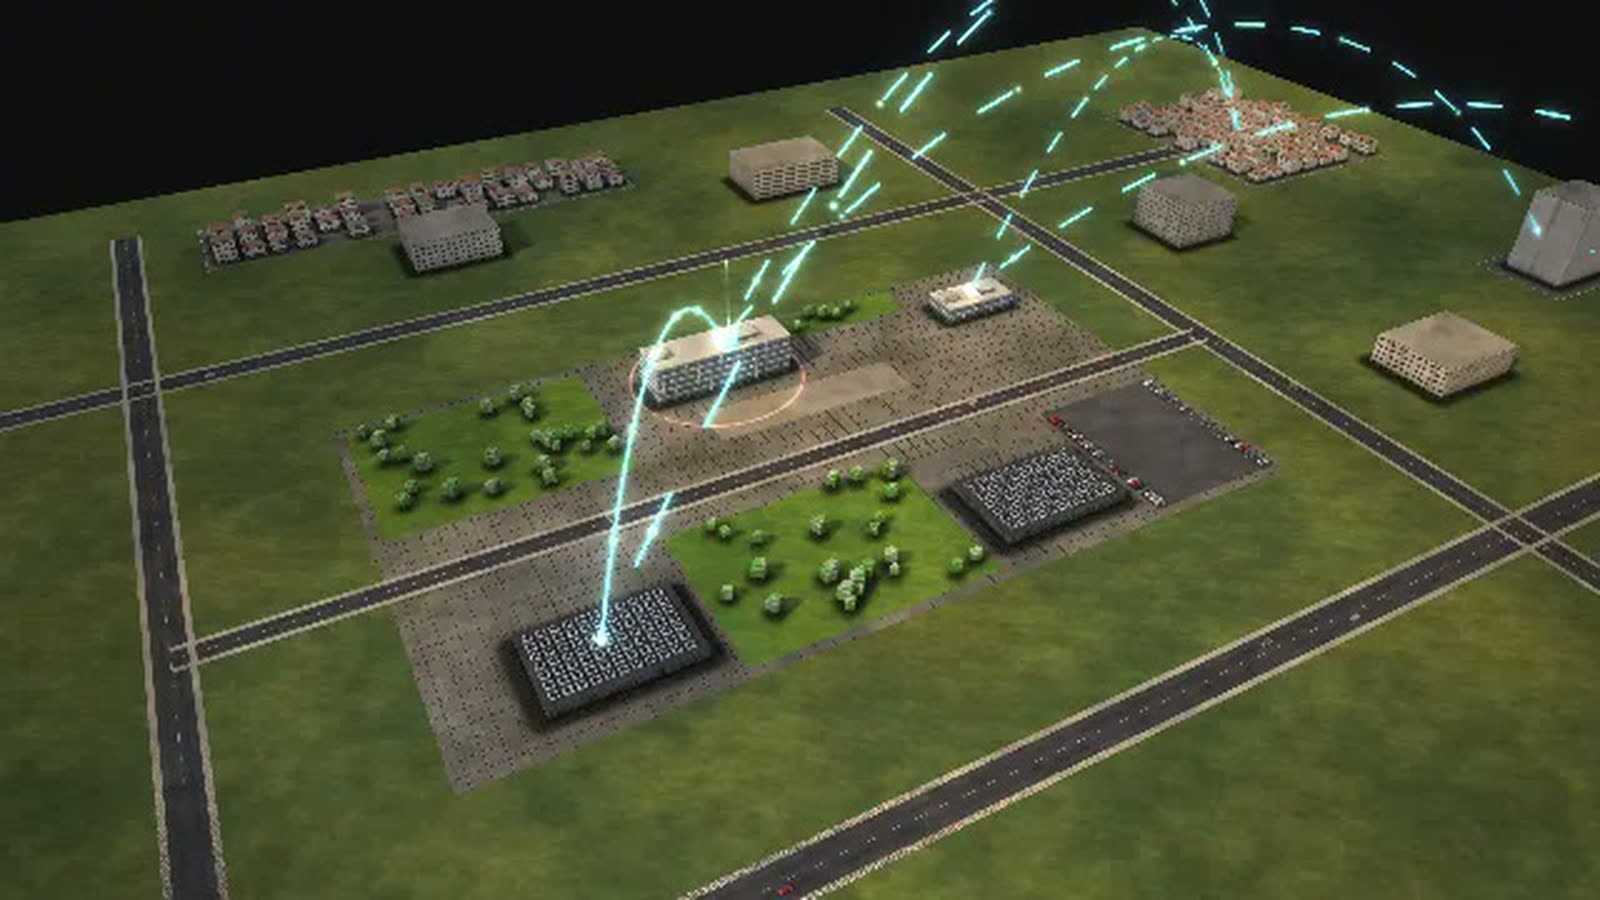
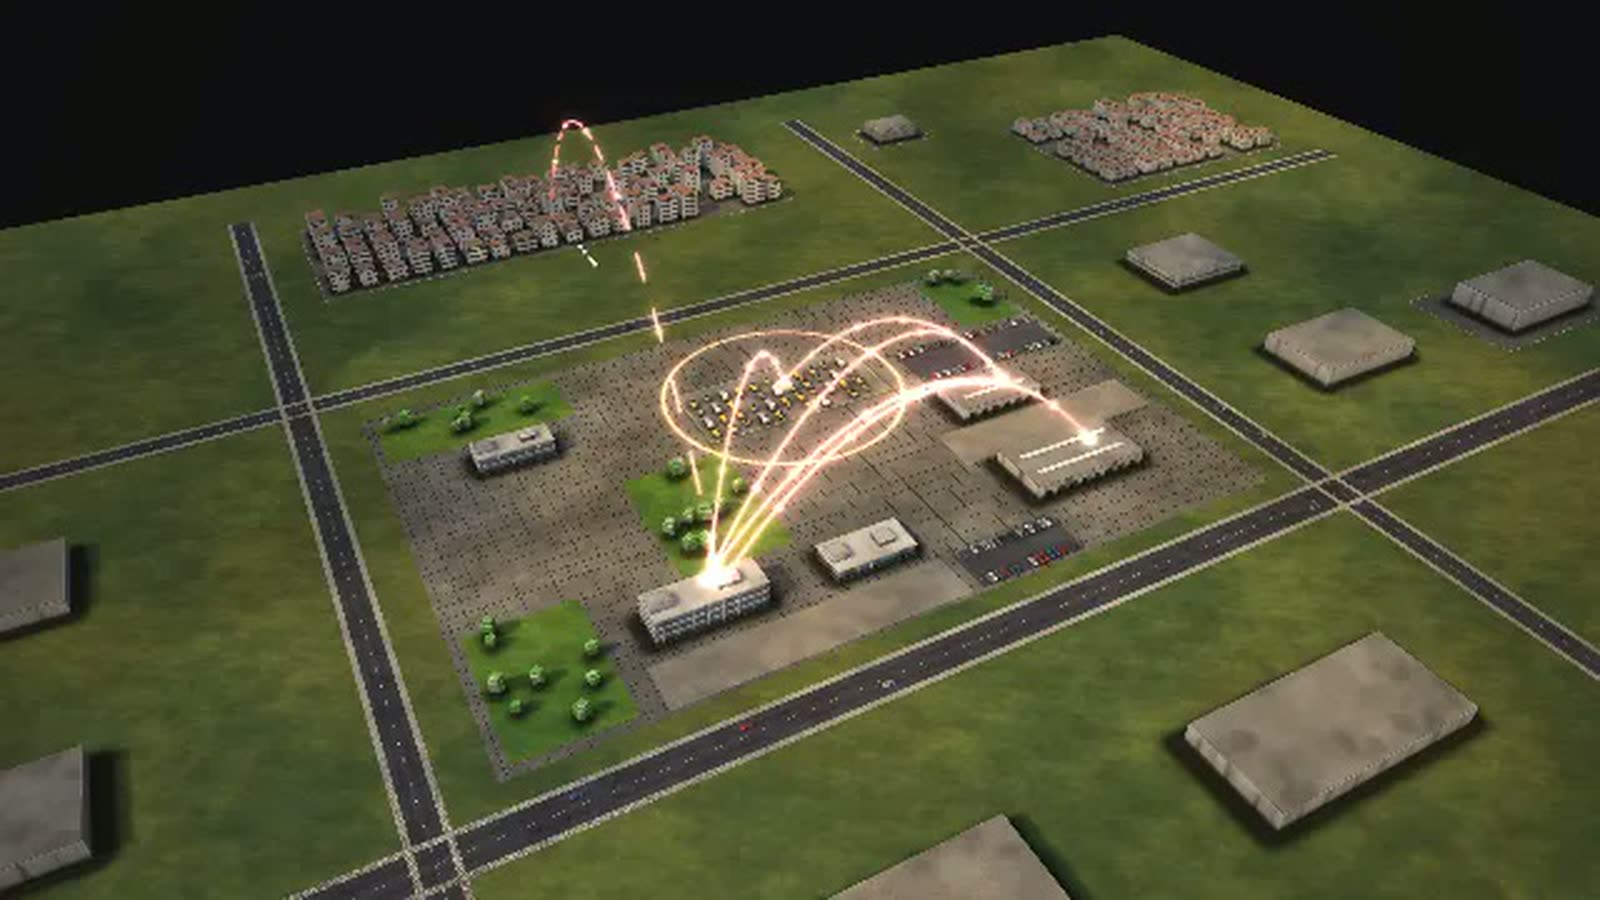
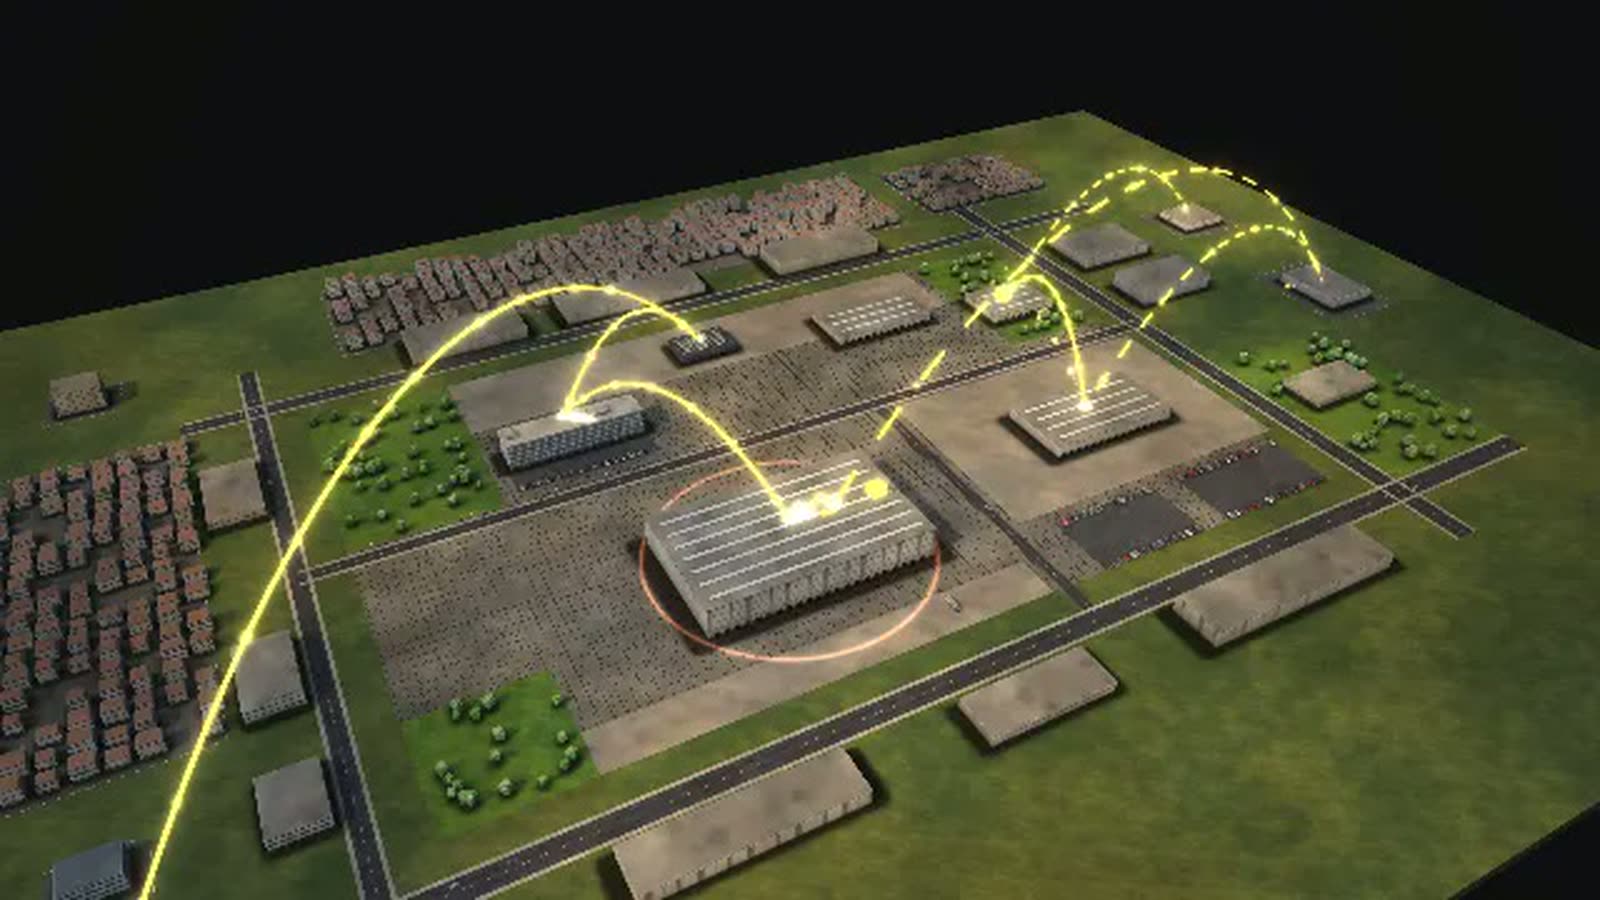
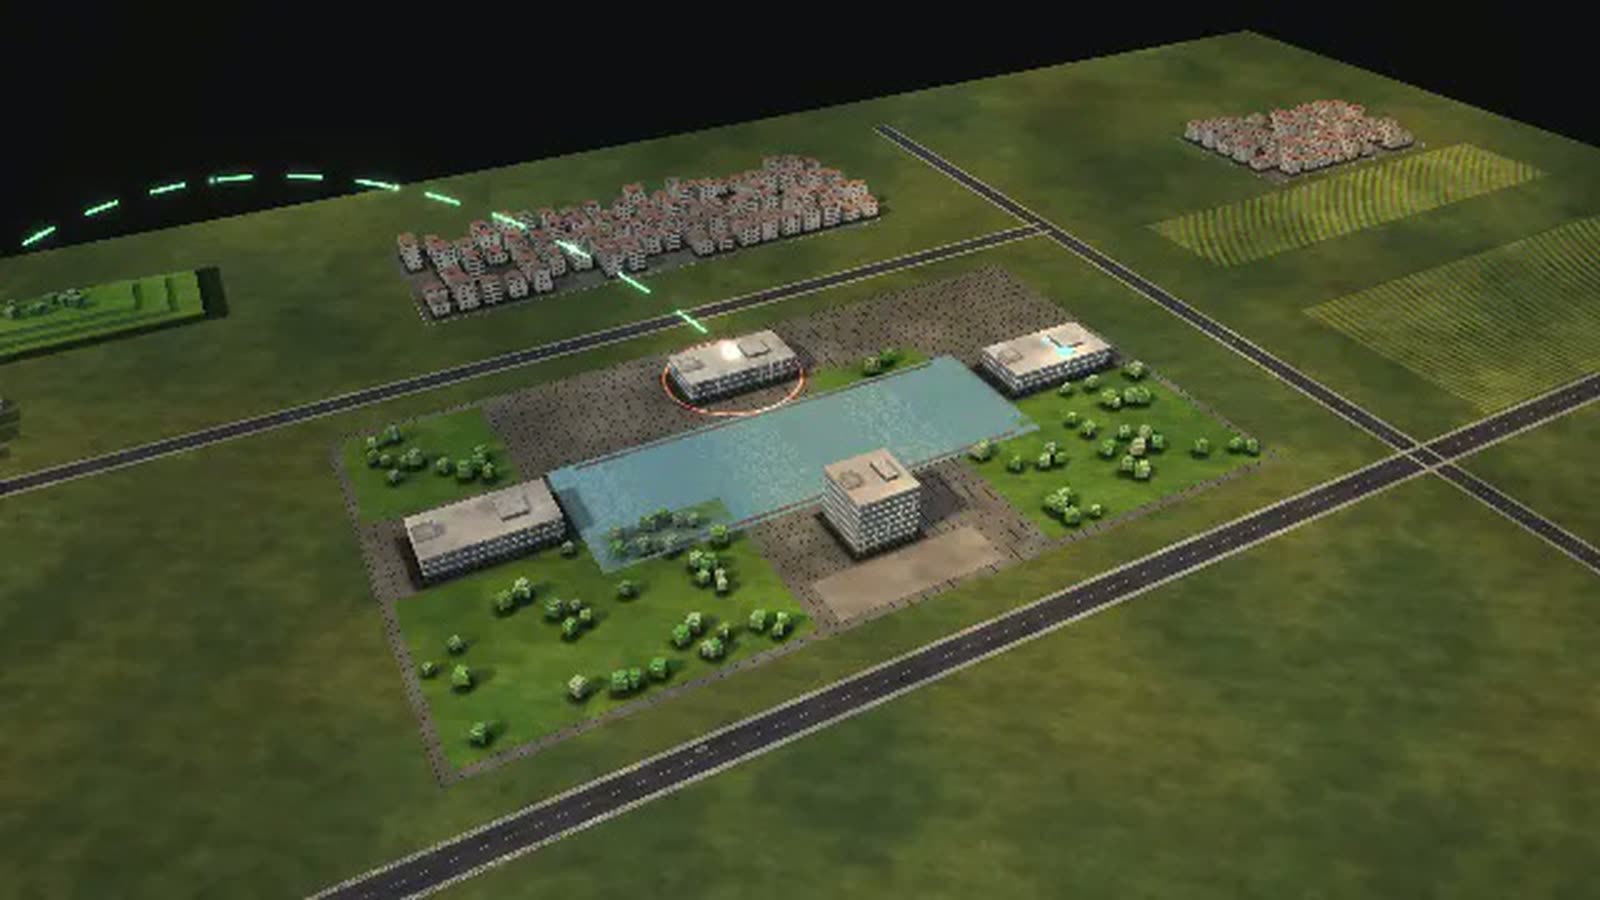
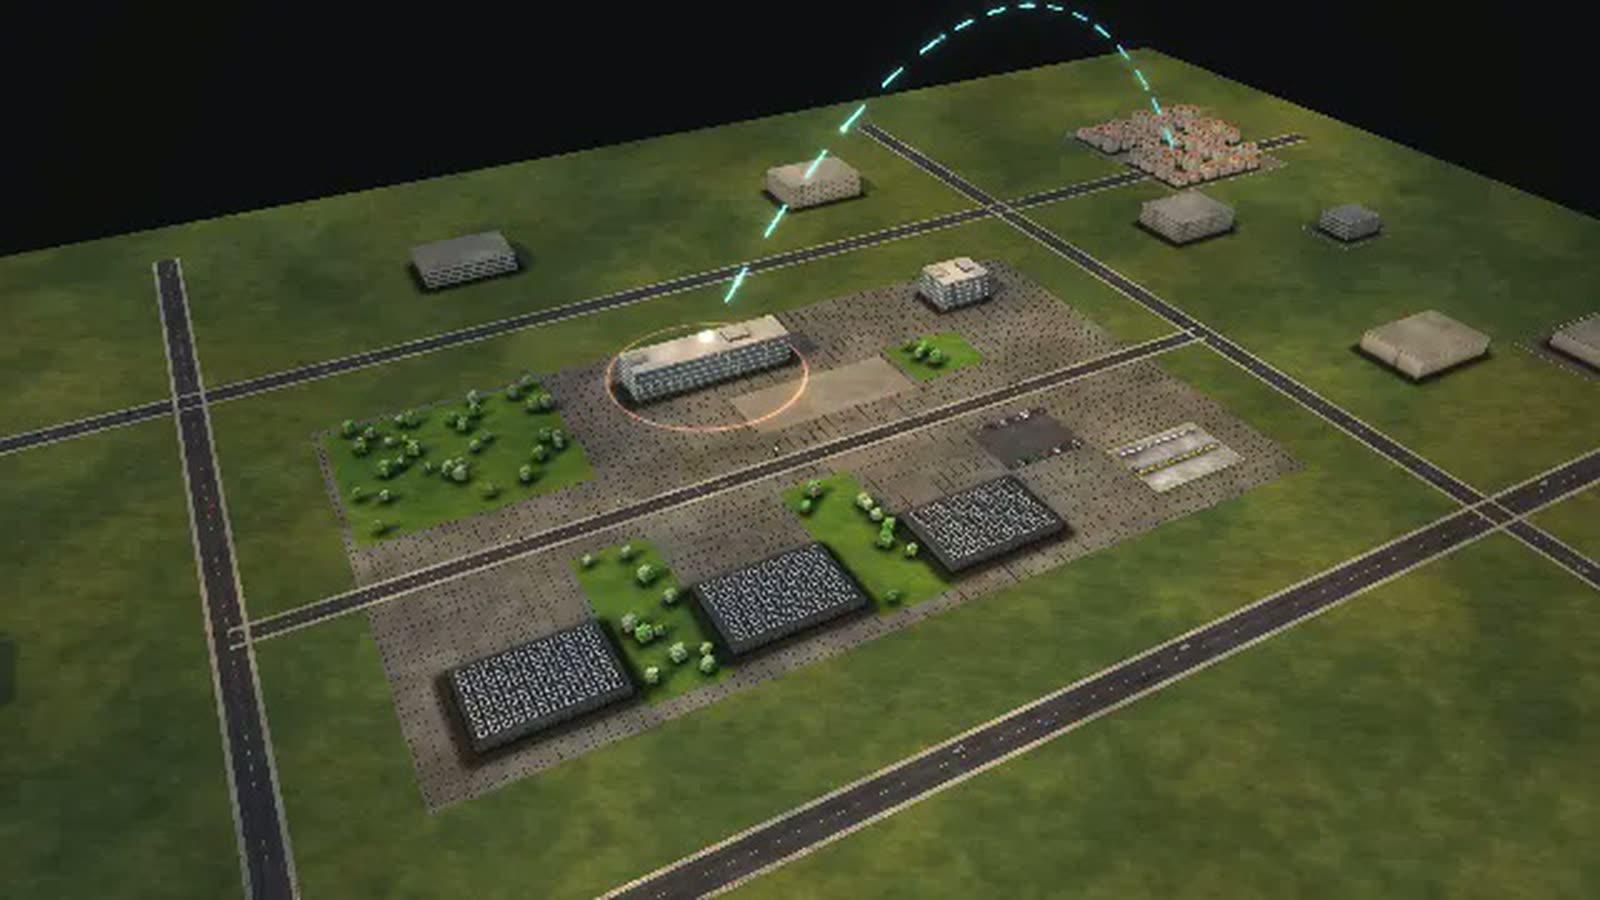
An insurer as a walkable model: a motor claim runs straight through or via claims handler, loss adjuster and workshop to payment and recovery.
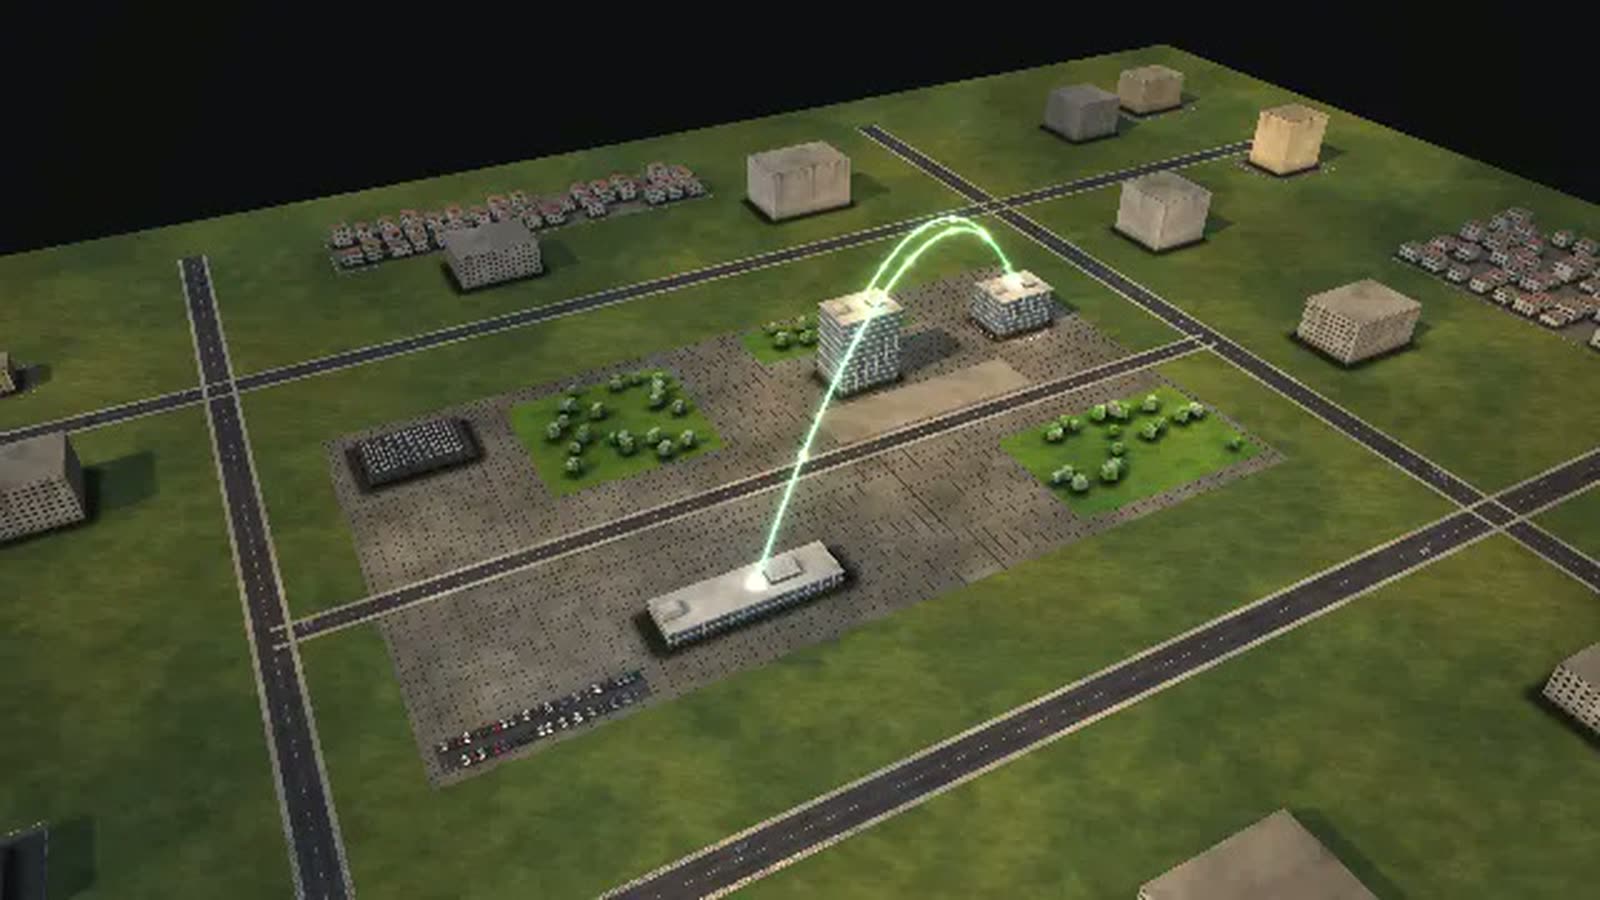
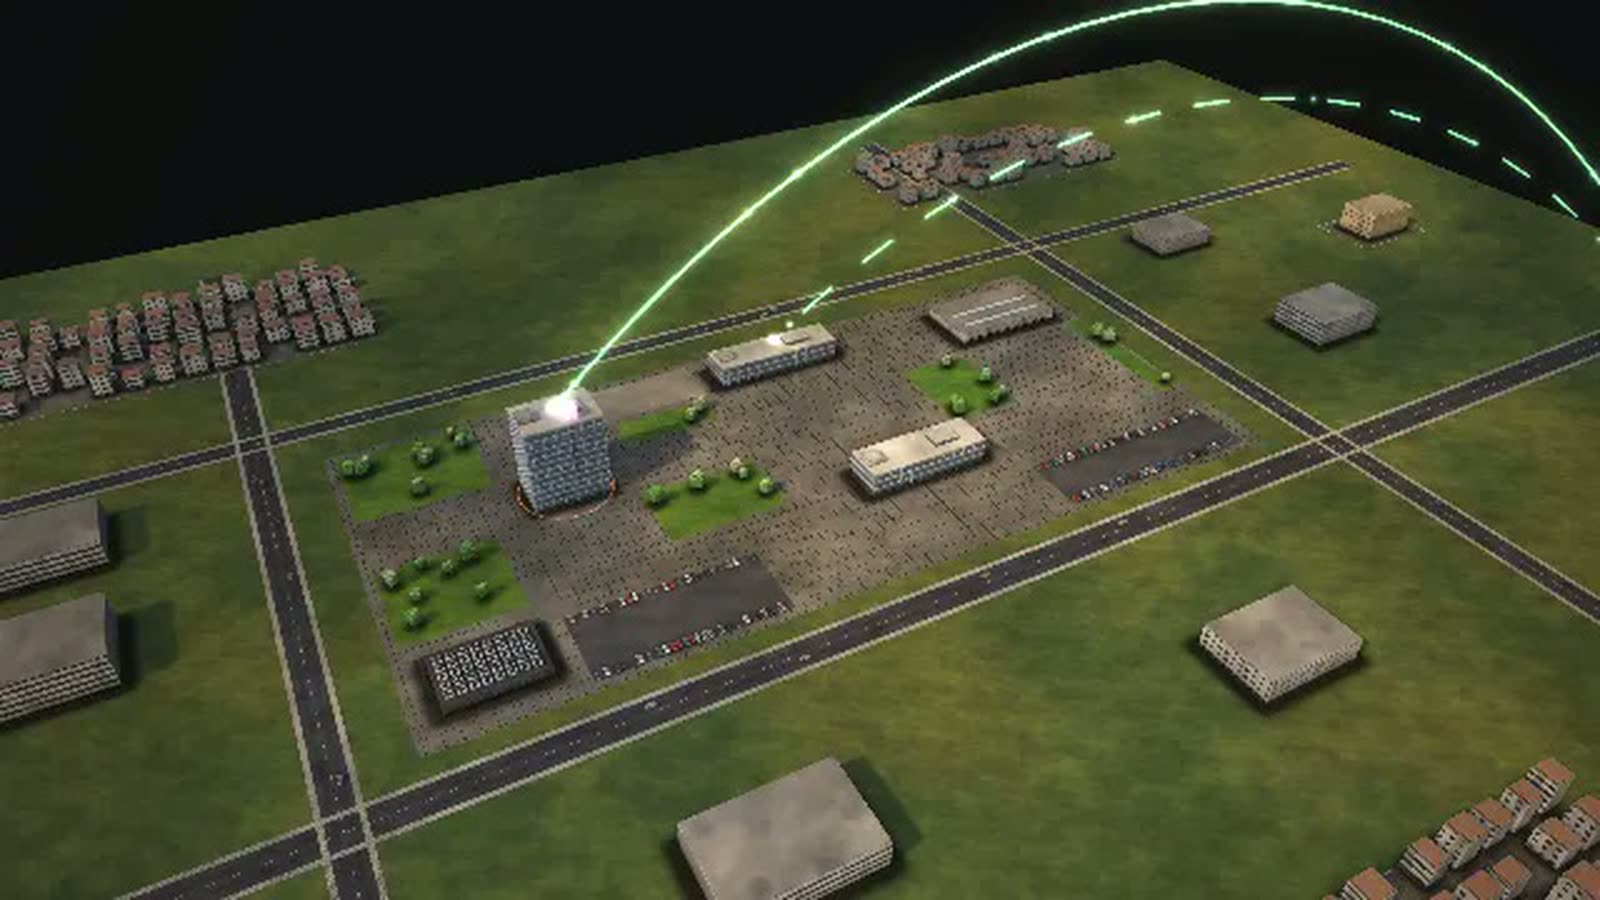
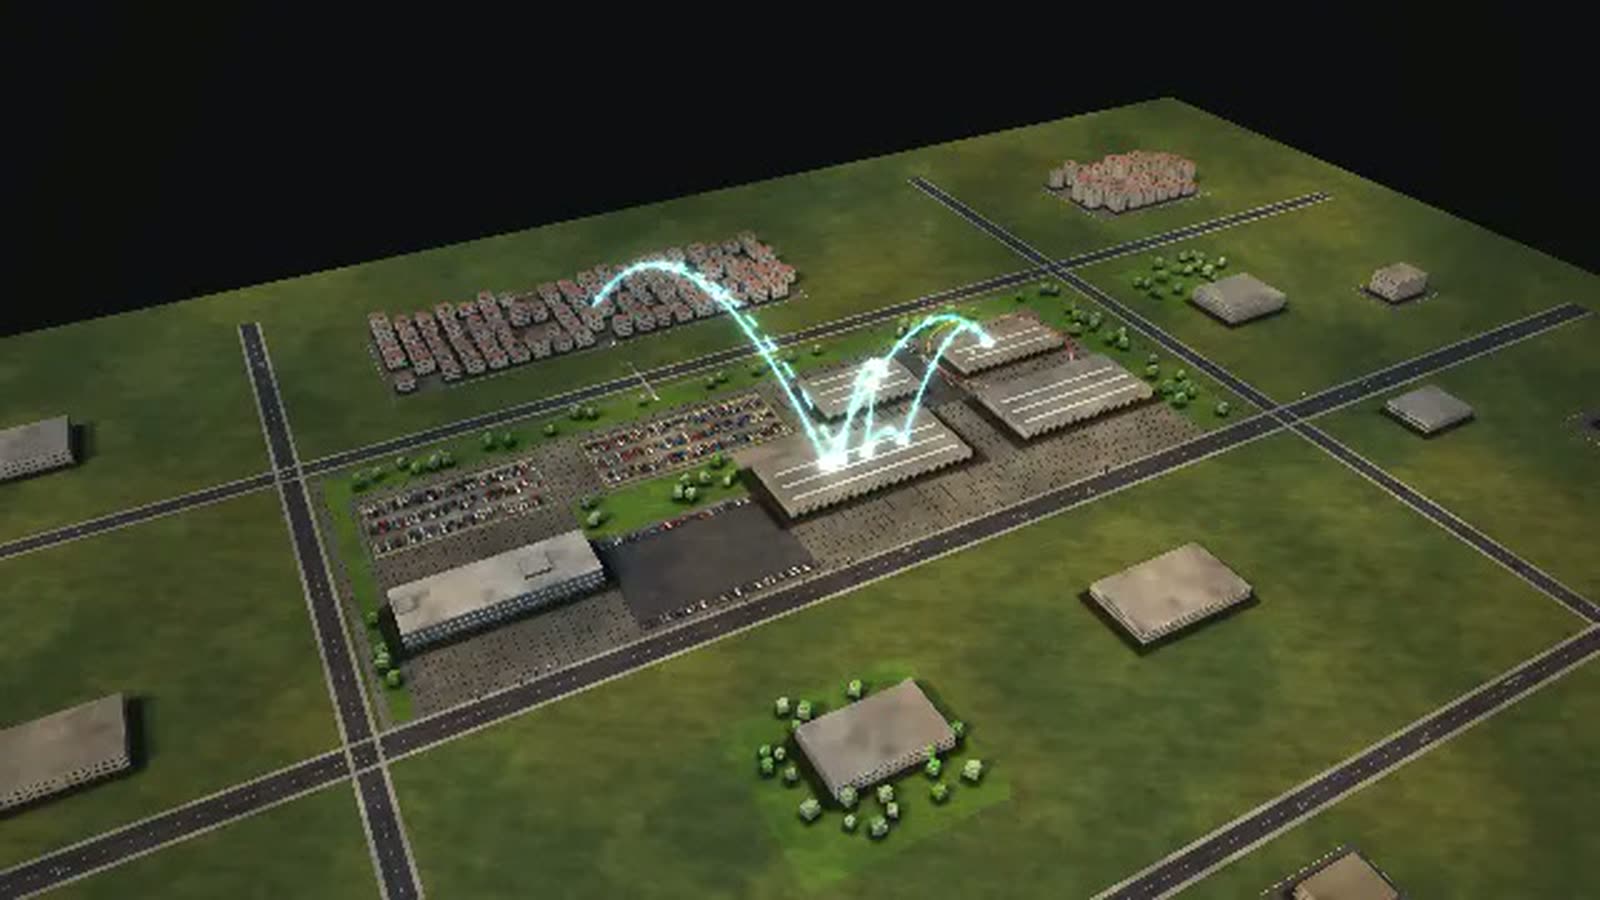
All data are fictional – HALDEN VERSICHERUNG does not exist. The model can be fitted to your real data and then shows what stays hidden today: claim reports per day and region, storms included, or straight-through rates and wrong payments by claim type.
The motor claims handling process at an insurer, as a running model. At the fictional HALDEN VERSICHERUNG, a policyholder reports an accident by phone or in the app. Triage and fraud scoring decide the route: straight-through processing with nobody touching the claim, or claims handler, loss adjuster and workshop through to payment and recovery from the other party's insurer. The target in the model: paid within 21 days.
The site has group headquarters, a claims centre and an operations and IT building. A hailstorm brings four times as many reports for two days, and the loss adjusters visibly become the bottleneck. More straight-through processing shifts load from the claims centre to automatic checks, though wrong payments may rise. With claims steering, cars go to partner workshops. Alongside, a new product is created and a storm is handled with reinsurance.
The shares of straight-through processing, assessments and recovery are model assumptions. Documented in the sources: life business in its own company and the four key functions under Solvency II. This page is for the board, claims management, product management, sales, staff development and internal audit.
A motor claim is settled
- 01
Take the claim: An accident: the policyholder reports the claim by phone or in the app.
- 02
Triage and fraud scoring: A rule and a fraud score sort: automatic, claims handler or loss adjuster.
- 03
Automatic check (straight-through): The system checks cover and amount and releases.
- 04
Claims handling: A claims handler checks cover, liability and the estimate.
- 05
Assessment: A loss adjuster inspects the car.
- 06
Repair in the workshop: The partner workshop repairs.
- 07
Settlement: The amount is fixed.
- 08
Policyholder provides more: The policyholder sends photos and invoice.
- 09
Payment: The money goes to the policyholder or workshop.
- 10
Recovery from the other party: Recovery claims from the other party's insurer.
- 11
Other insurer pays: The other side pays.
- 12
Done.
- 13
Recovered.
How an insurer can use the model
-
Internal communication
The diagram ‘Who leads whom’ shows risk management, compliance, internal audit and the actuarial function directly below the board, which makes governance readable for every department.
Pour quiBoard, supervisory board, internal comms
-
Onboarding
New claims handlers follow a motor claim from report to payment and see when the loss adjuster, the workshop and recovery come into play.
Pour quiNew staff in claims service and motor claims
-
Training
Trainees trigger ‘Claims system outage’: for four hours reports are taken on paper and nothing is settled. Afterwards they see how long the backlog lingers.
Pour quiApprentices, claims teams
-
Explaining to customers
Show policyholders and sales what happens after a big storm: crisis team, quick estimate of the total loss, reinsurance, report to the supervisor.
Pour quiSales, agents, brokers, policyholders
-
Strategic overview
More straight-through processing, claims steering or more handlers? ‘What each control does’ compares automation, partner workshops and staff, each with its own risk.
Pour quiBoard, claims management, finance
What is shown – why – for whom
| Ce qui est montré | Pourquoi | Pour qui |
|---|---|---|
| Diagram ‘How a case flows’: straight-through versus manual handling | PourquoiShows how many claims run without people. | Pour quiHead of claims, board |
| Diagram ‘Where it gets tight’ during the hailstorm | PourquoiShows the loss adjusters as the bottleneck. | Pour quiHead of claims, crisis planning |
| Diagram ‘What each control does’: straight-through, claims steering, handlers | PourquoiCompares automation, partner workshops and staff. | Pour quiBoard, finance |
| Diagram ‘Where the site gets tight’: the claims centre | PourquoiShows the load inside the building. | Pour quiSite management, workforce planning |
| Diagram ‘Who leads whom’ with the four key functions | PourquoiShows governance under Solvency II. | Pour quiSupervisory board, supervisors, training |
| Process ‘A storm hits many policyholders’ with reinsurance | PourquoiExplains how large loss events are handled. | Pour quiCustomers, sales |
| Process ‘A new product is created’ | PourquoiShows product approval with a target market. | Pour quiProduct management, sales |
Departments in the model
-
Management board
Runs the insurer and is responsible for the own risk and solvency assessment.
-
Product management
Develops products for a defined target market.
-
Sales management
Manages agencies and brokers, trains on new products.
-
Actuarial
Calculates premiums, reserves and natural hazards – also a statutory key function.
-
Risk management
Key function under Solvency II: measures whether capital covers the risks.
-
Compliance
Key function: compliance, including product approvals.
-
Internal audit
Key function: audits independently.
-
Reinsurance
Buys protection for peak risks and claims it after catastrophes.
-
Claims service
Takes claims by phone and in the app.
-
Motor claims
Checks, steers and settles accidents and glass damage.
-
Property claims
Storm, water, fire – many times more in a catastrophe.
-
Recovery
Recovers money from the other party's insurer.
-
Policy administration
Policies, changes, cancellations.
-
Collection and payment
Collects premiums and pays claims.
-
IT
Policy system, claims system, app.
-
Facilities
Building, canteen, mail.
All processes in the model
A motor claim is settled
- 01Take the claim: An accident: the policyholder reports the claim by phone or in the app.
- 02Triage and fraud scoring: A rule and a fraud score sort: automatic, claims handler or loss adjuster.
- 03Automatic check (straight-through): The system checks cover and amount and releases.
- 04Claims handling: A claims handler checks cover, liability and the estimate.
- 05Assessment: A loss adjuster inspects the car.
- 06Repair in the workshop: The partner workshop repairs.
- 07Settlement: The amount is fixed.
- 08Policyholder provides more: The policyholder sends photos and invoice.
- 09Payment: The money goes to the policyholder or workshop.
- 10Recovery from the other party: Recovery claims from the other party's insurer.
- 11Other insurer pays: The other side pays.
- 12Done.
- 13Recovered.
A new product is created
- 01Need and target market: Product management plans a home insurance with cover against heavy rain and flooding.
- 02Pricing with natural hazard model: The actuaries calculate with hazard zones how expensive heavy rain can get.
- 03Buy reinsurance cover: Reinsurance asks for cover for peaks.
- 04Reinsurer's offer: The reinsurer offers capacity and price.
- 05Product committee (monthly): The product committee with risk management and compliance approves – or sends back.
- 06IT builds the product in, sales is trained – at the same time.
- 07Rating engine and policy system: Rating engine and policy system are adapted.
- 08Sales training: Agencies and brokers learn the product.
- 09All ready.
- 10Launch and sales monitoring: Launch, then product management monitors sales.
- 11On the market.
A storm hits many policyholders
- 01Crisis team after the storm: After a hailstorm the crisis team meets: extra adjusters, extra shifts.
- 02Quick estimate of the total loss: The actuaries estimate the total loss from the first reports and the weather model.
- 03Report to board and reinsurer: Report to board and reinsurer.
- 04Retained.
- 05Claim reinsurance and check solvency – at the same time.
- 06Claim reinsurance: Evidence to the reinsurer.
- 07Reimbursement by reinsurer: The reinsurer reimburses.
- 08Solvency report: Risk management recalculates solvency.
- 09Supervisor takes note: The supervisor is informed.
- 10Reimbursed and reported.
- 11Closed.
What you can change
Controls
- Claims volume: Ice and wildlife accidents in winter bring many more claims.
- Straight-through processing: More claims go through automatically; wrong payments may rise (model assumption).
- Motor claims handlers: How many claims are handled at once.
- Claims steering: Claims go to partner workshops, which repair faster (model assumption).
Disruptions
- Hailstorm: For two days four times as many reports, loss adjusters are fully booked.
- Claims system outage: Four hours without the claims system: reports on paper, nothing is settled.
- Adjuster shortage: For a week every assessment takes two and a half times as long.
What the model gives an insurer
-
01
Two routes, one picture
In ‘How a case flows’ the stream of claims splits right after triage: automatic or by hand. You see how many run without anyone touching them.
-
02
The hailstorm in advance
The simulation runs queues. Four times the reports for two days show exactly when the loss adjusters are fully booked.
-
03
Governance you can walk through
Key functions appear as departments below the board, and the life and asset management companies as separate entities – not as a paragraph in a report.
-
04
From product to claim
A new product with a natural hazard model, reinsurance and a monthly product committee runs in the same model as daily claims handling.
-
05
For the boardroom and the training room
Walkable in the browser and on large projections, with controls and disruptions that make every run turn out differently.
Basis and limits
Fictional insurer · model based on researched industry structures and regulation · no forecast for real insurers
1 case = 1 claim, 1 product or 1 storm · 1 figure ≈ 20 employees
All volumes, durations, rates and capacities are model assumptions, not values of a real insurer.
Shares of straight-through, adjuster and recovery as well as the effect of claims steering are model assumptions.
Documented: separation of lines (life in a separate company), four key functions under Solvency II, product approval with target market.
Public sources the model is based on:
- Solvency-II-Richtlinie 2009/138/EG
- EIOPA: Solvency II
- Versicherungsaufsichtsgesetz (VAG)
- Richtlinie (EU) 2016/97 (Versicherungsvertrieb)
- GDV Statistik
Your insurance company as a model
Would you like to see your claims handling, straight-through rate or storm plan like this? Write or call us and we'll clarify together which data the model needs. The password to open HALDEN in the simulation is available on request.
cube4tec.de/spiele/minimal-organization/
Poser une question à ce sujet
Minimal Organization: Versicherung
Similar business models
-
Bank
A bank as a walkable model: a business loan from first vote to disbursement, with sales and risk kept apart up to the board, in a running simulation.
-
Health insurer
A statutory health insurer as a walkable model: how a wheelchair application moves from quote to decision, when the medical service steps in and where deadlines get tight.
-
Car dealership
A franchised car dealership with workshop as a walkable model: how a car gets from reception to handover in one day and where lifts, parts or inspections slow it down.
-
Payment service provider
A payment service provider as a walkable model: a card payment from authorisation in milliseconds to the payout to the merchant in the morning.
-
Heating, plumbing and electrical contractor
A heating, plumbing and electrical contractor as a walkable model: what happens after a breakdown call, why the right part in the van matters and when the emergency service hits its limit.
-
Online retail
An order from click to doorstep as a walkable model: payment check, warehouse, packing, trucks, sortation and delivery in a running simulation.
-
Search engine
A search and advertising group as a walkable model: auctions in milliseconds, experiments over weeks, and a new ad campaign that waits for people.
-
Cloud provider
A cloud provider as a walkable model: support cases, zone outages and new data centres on three time scales, in a running simulation.
All data are fictional – HALDEN VERSICHERUNG does not exist. The model can be fitted to your real data and then shows what stays hidden today: claim reports per day and region, storms included, or straight-through rates and wrong payments by claim type.