
Simulation · Minimal Organization · Energy and water
Electricity grid operator
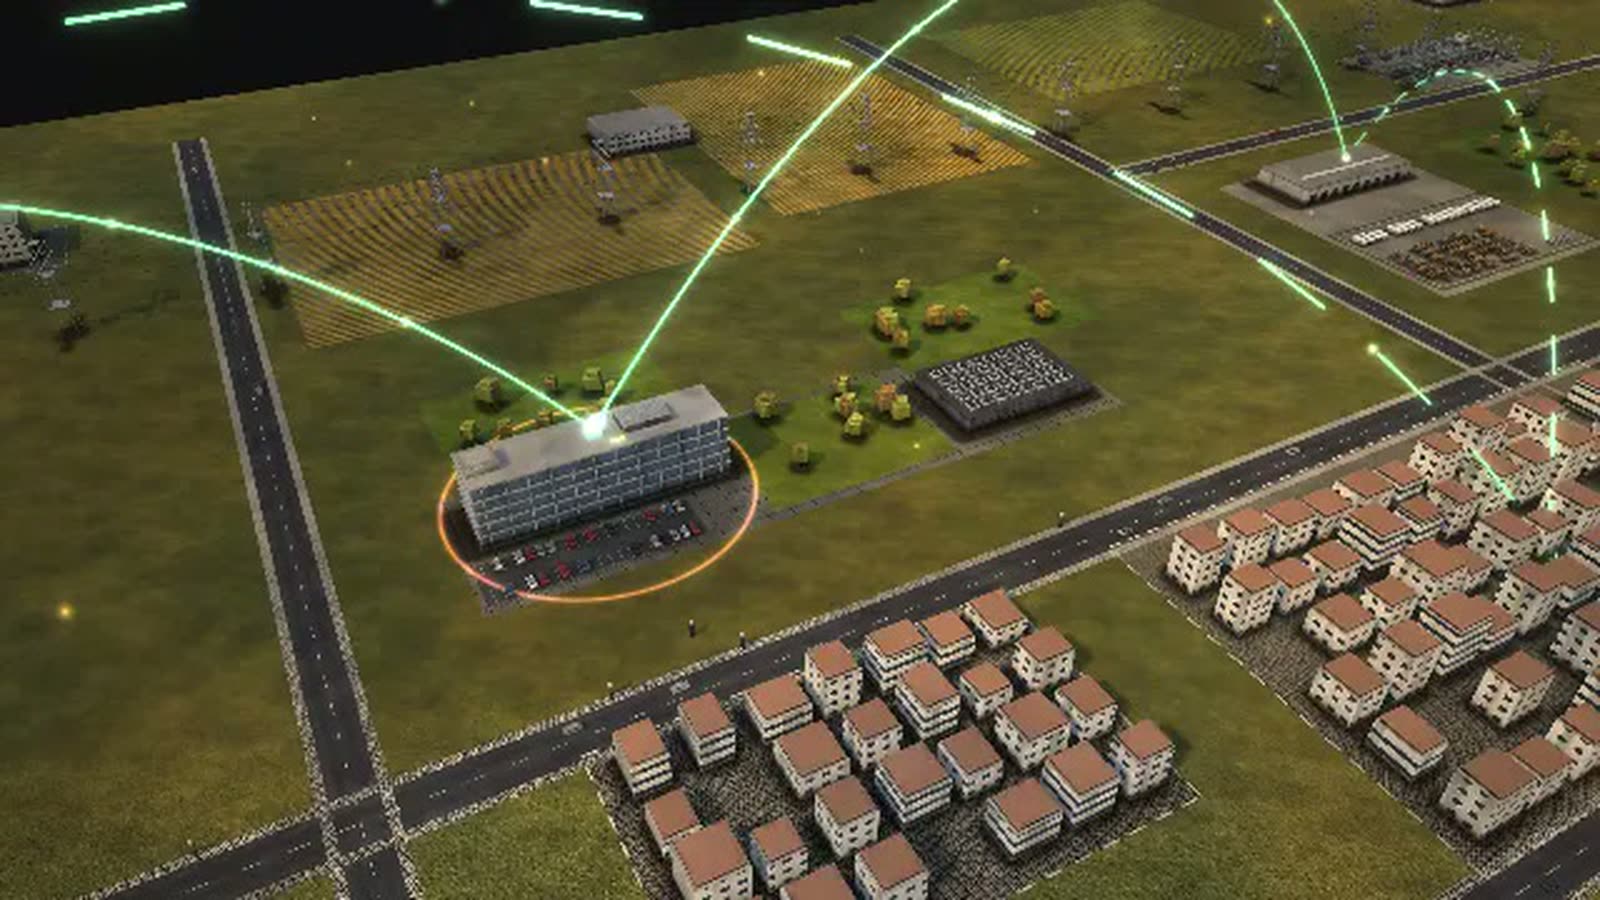
A grid operator as a walkable model: see how a solar system or heat pump gets connected and when grid planning becomes the bottleneck.
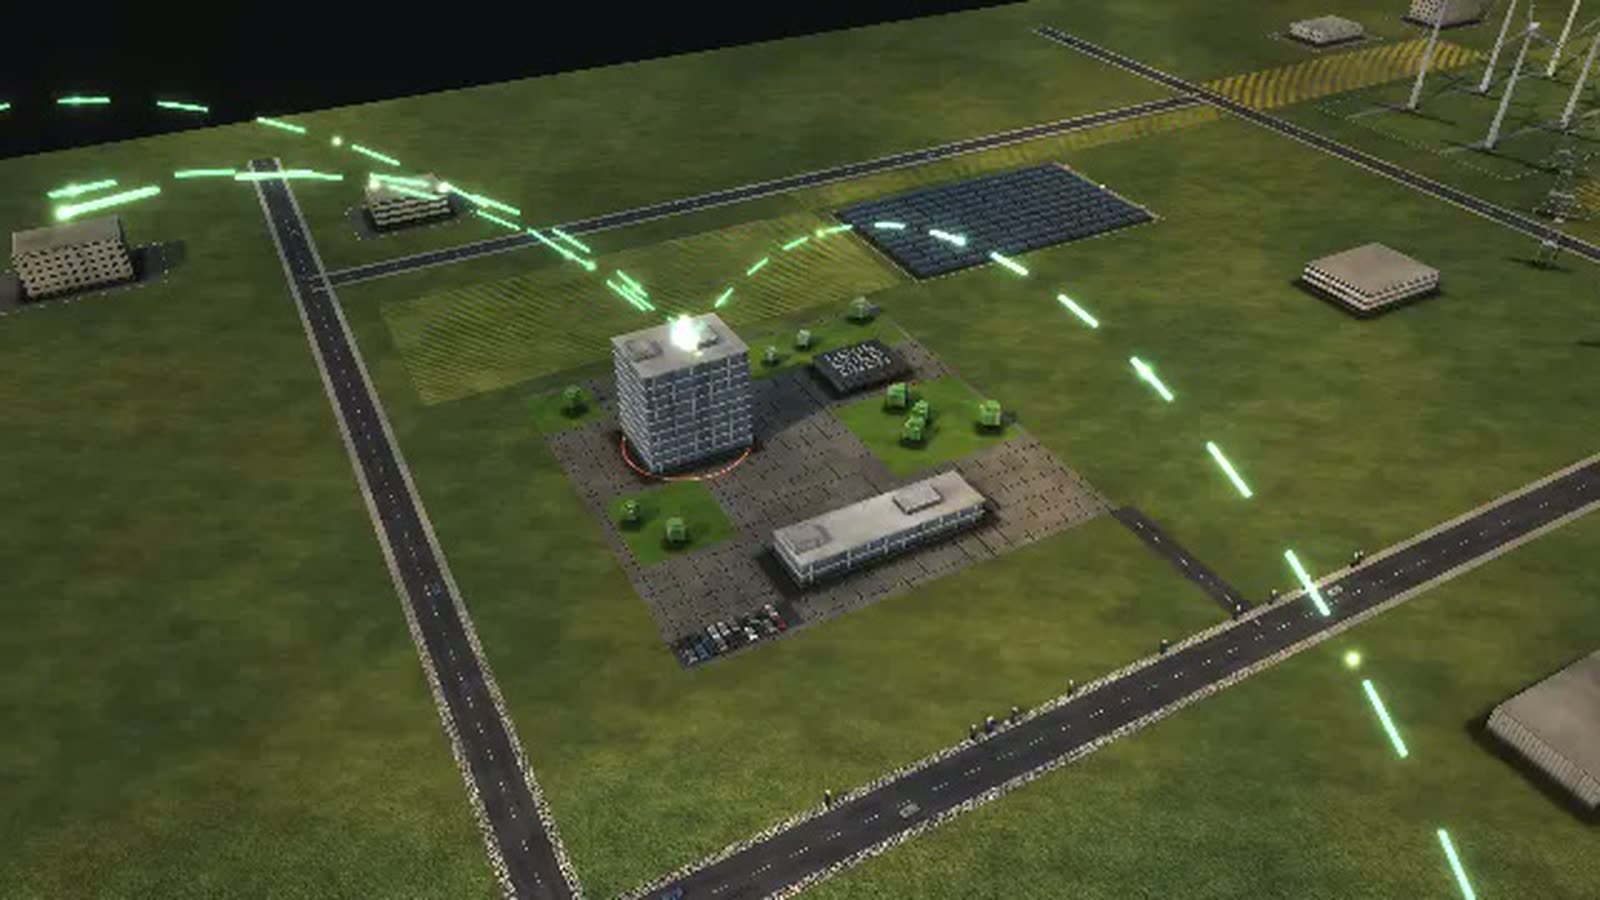
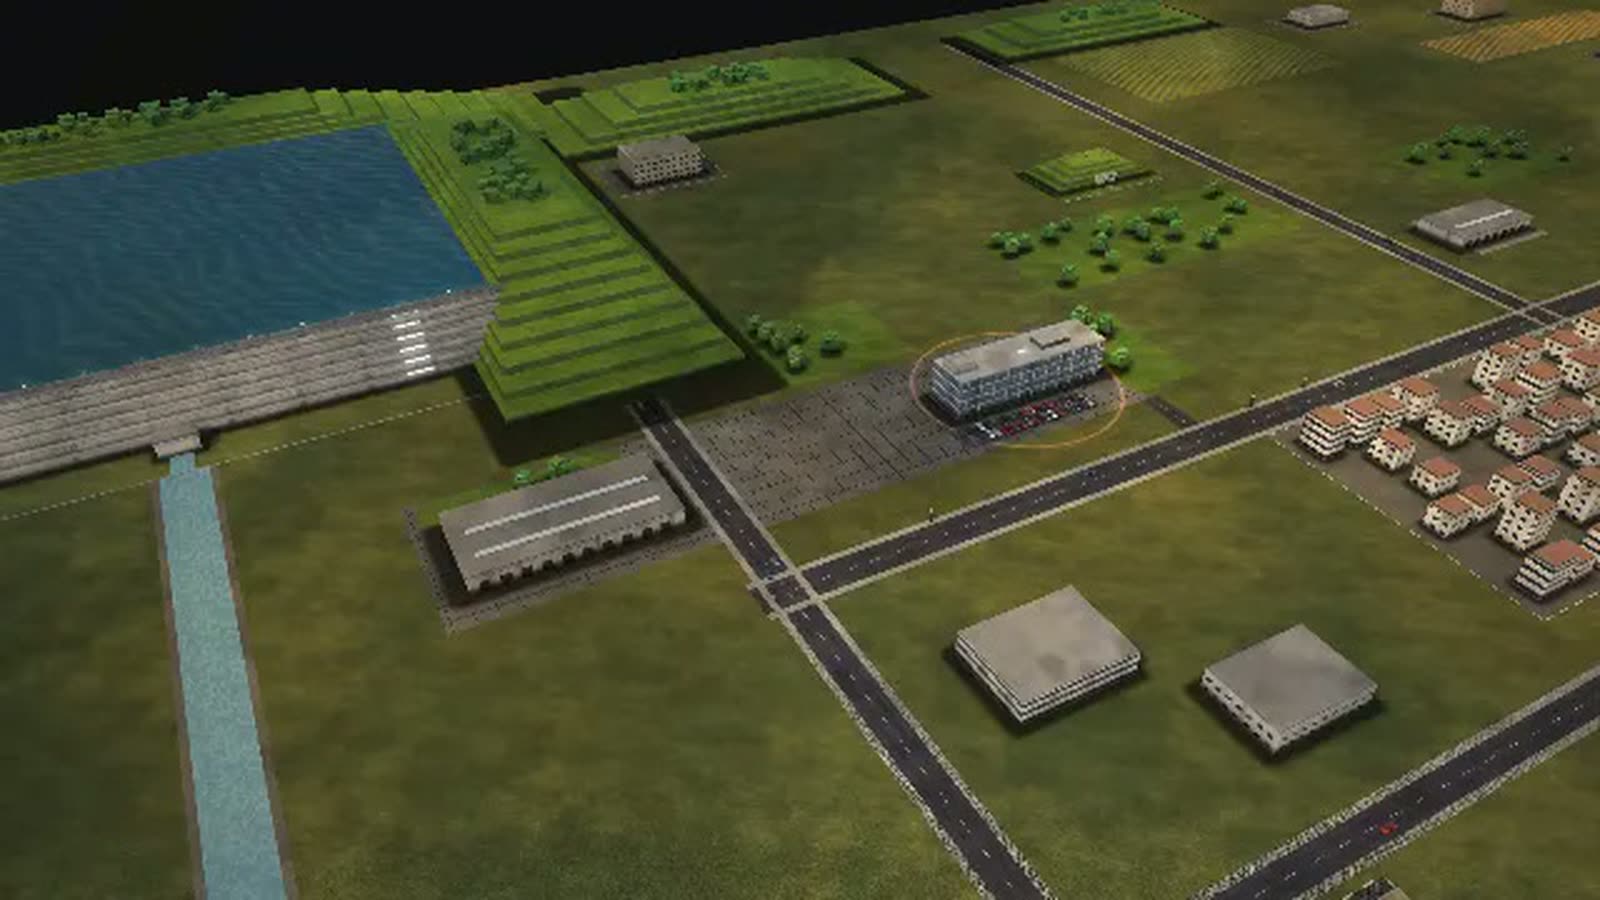
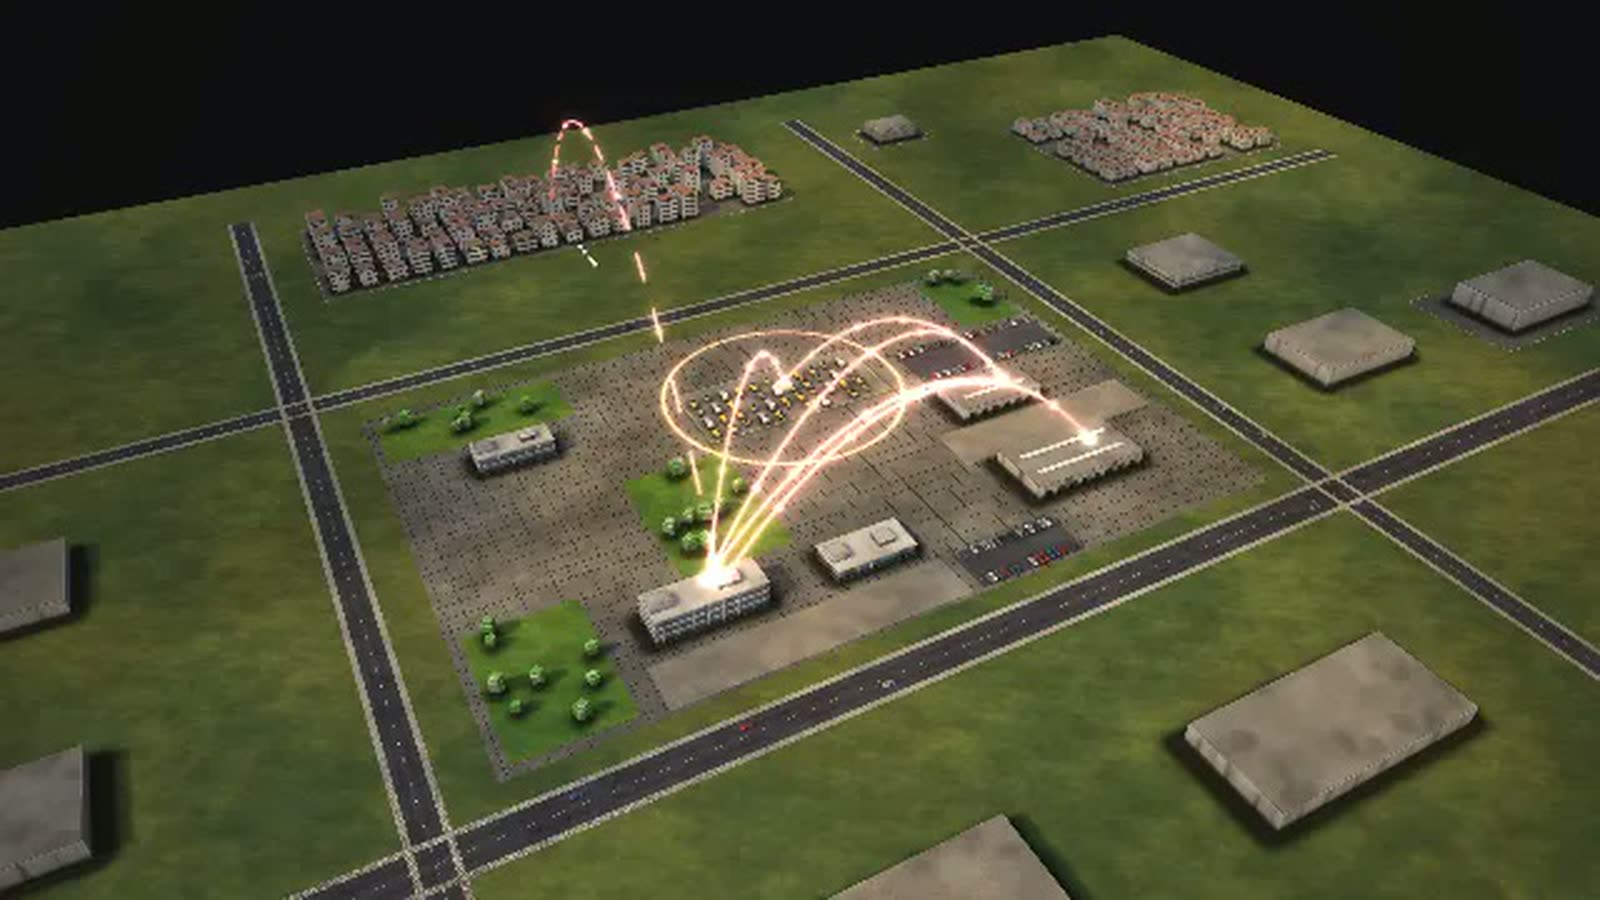
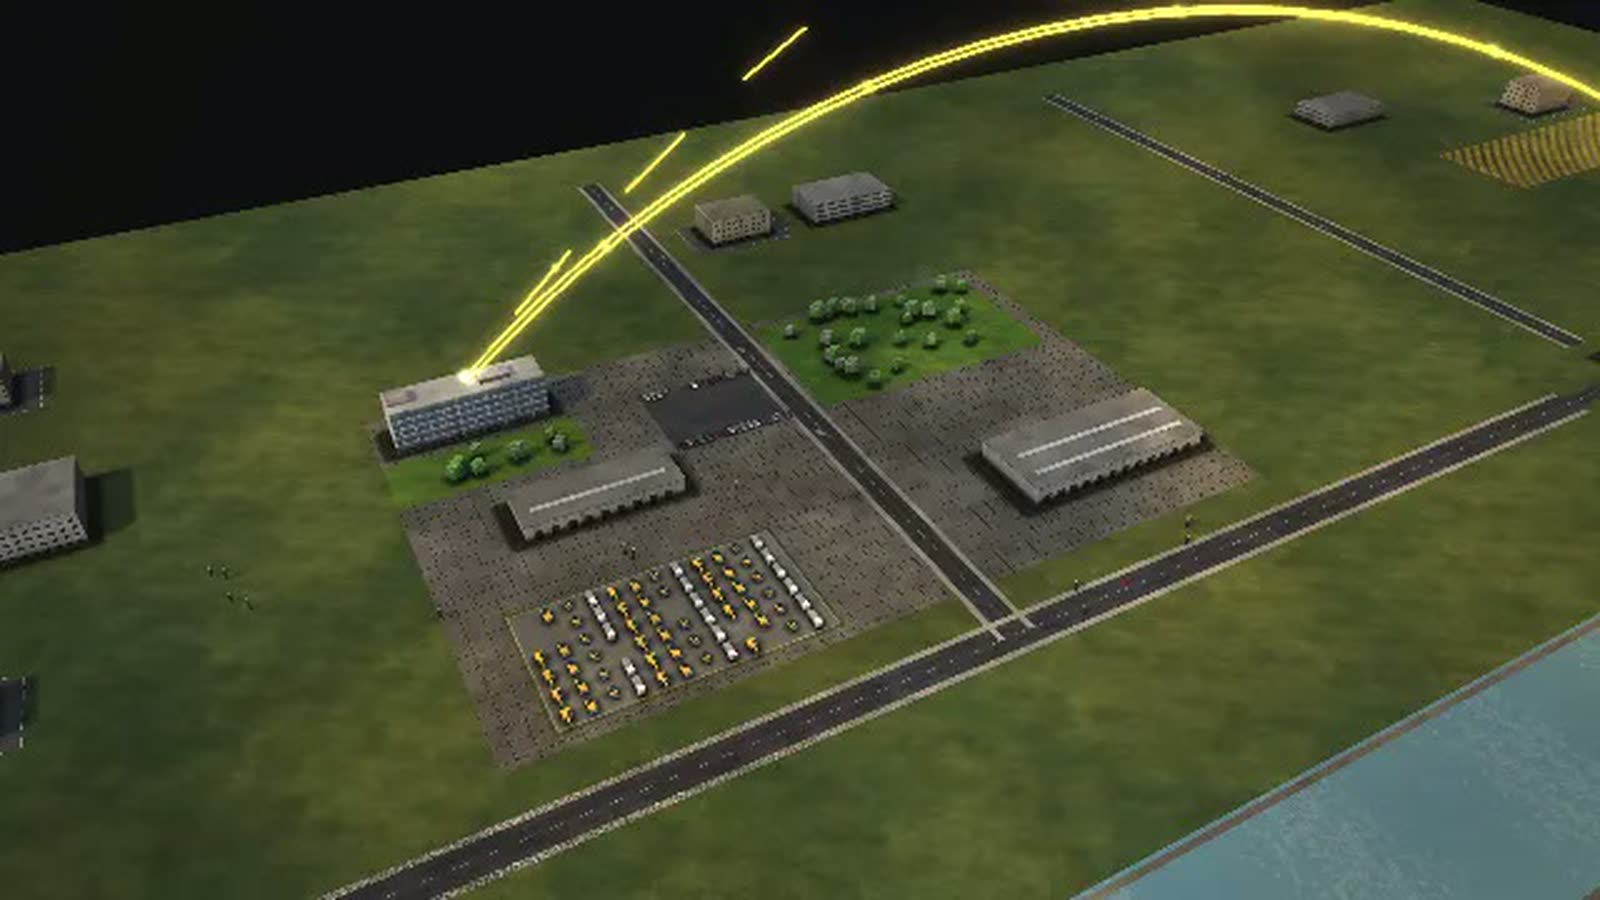
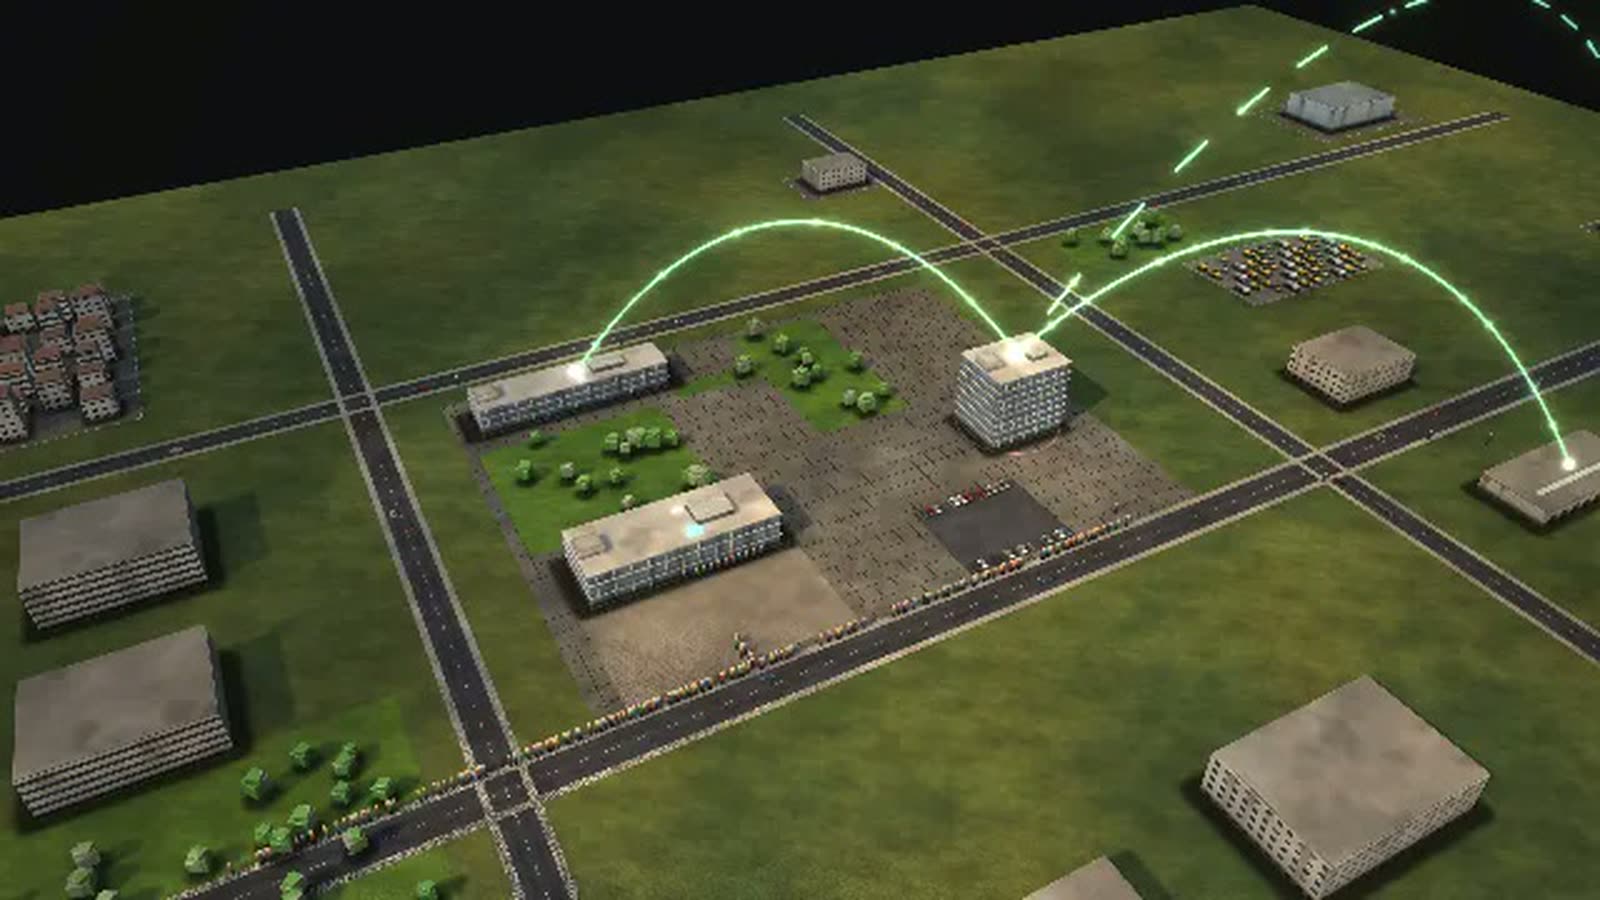
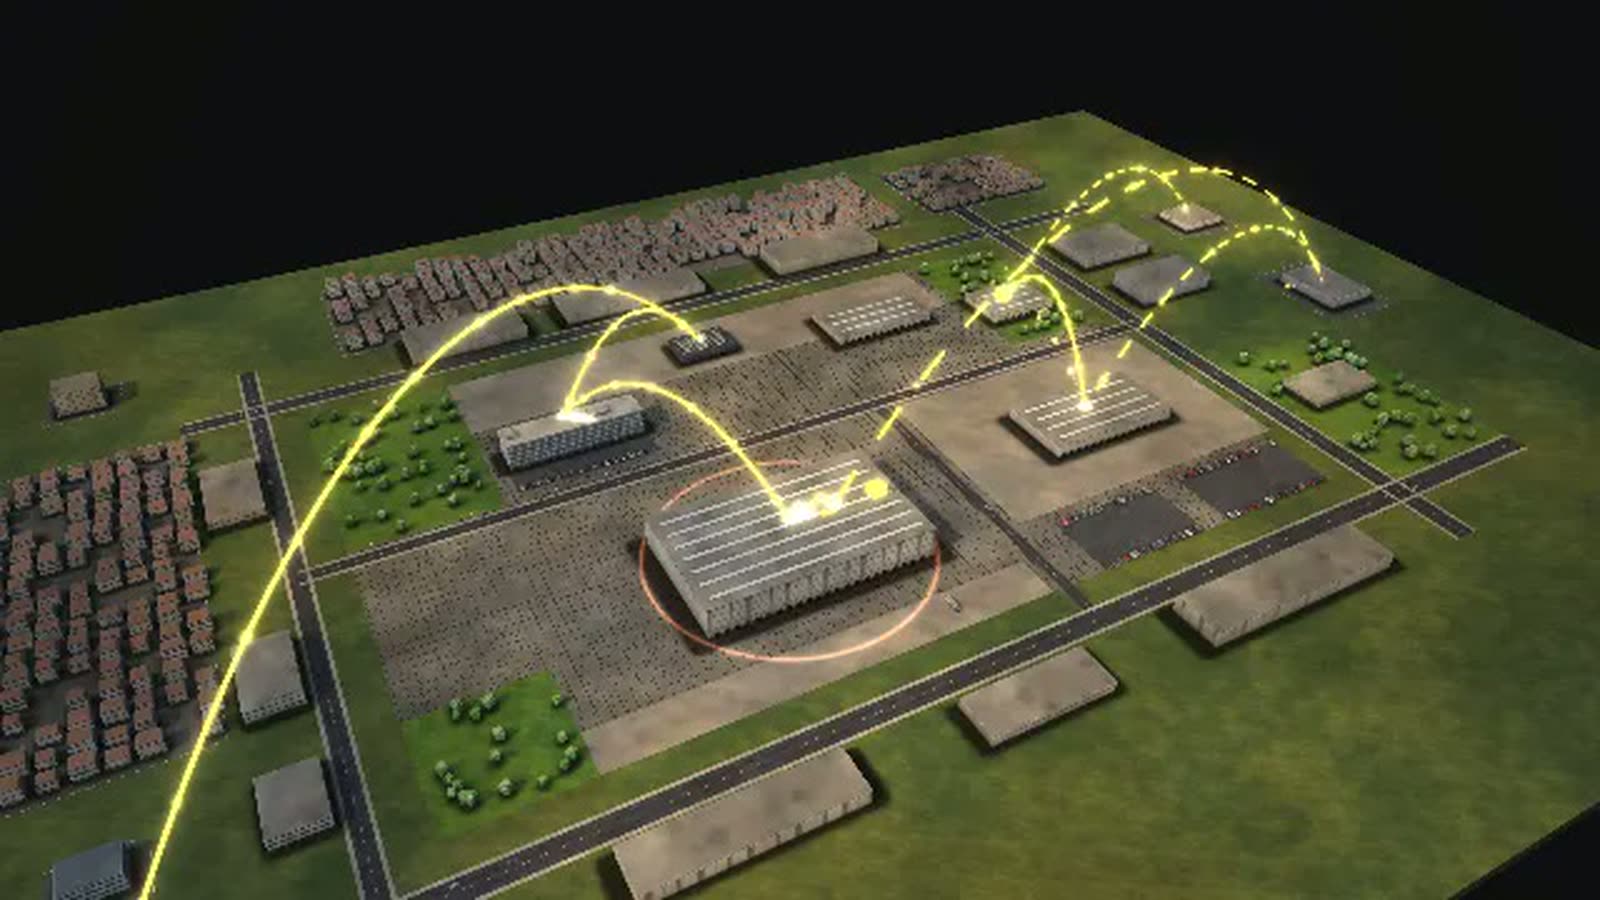
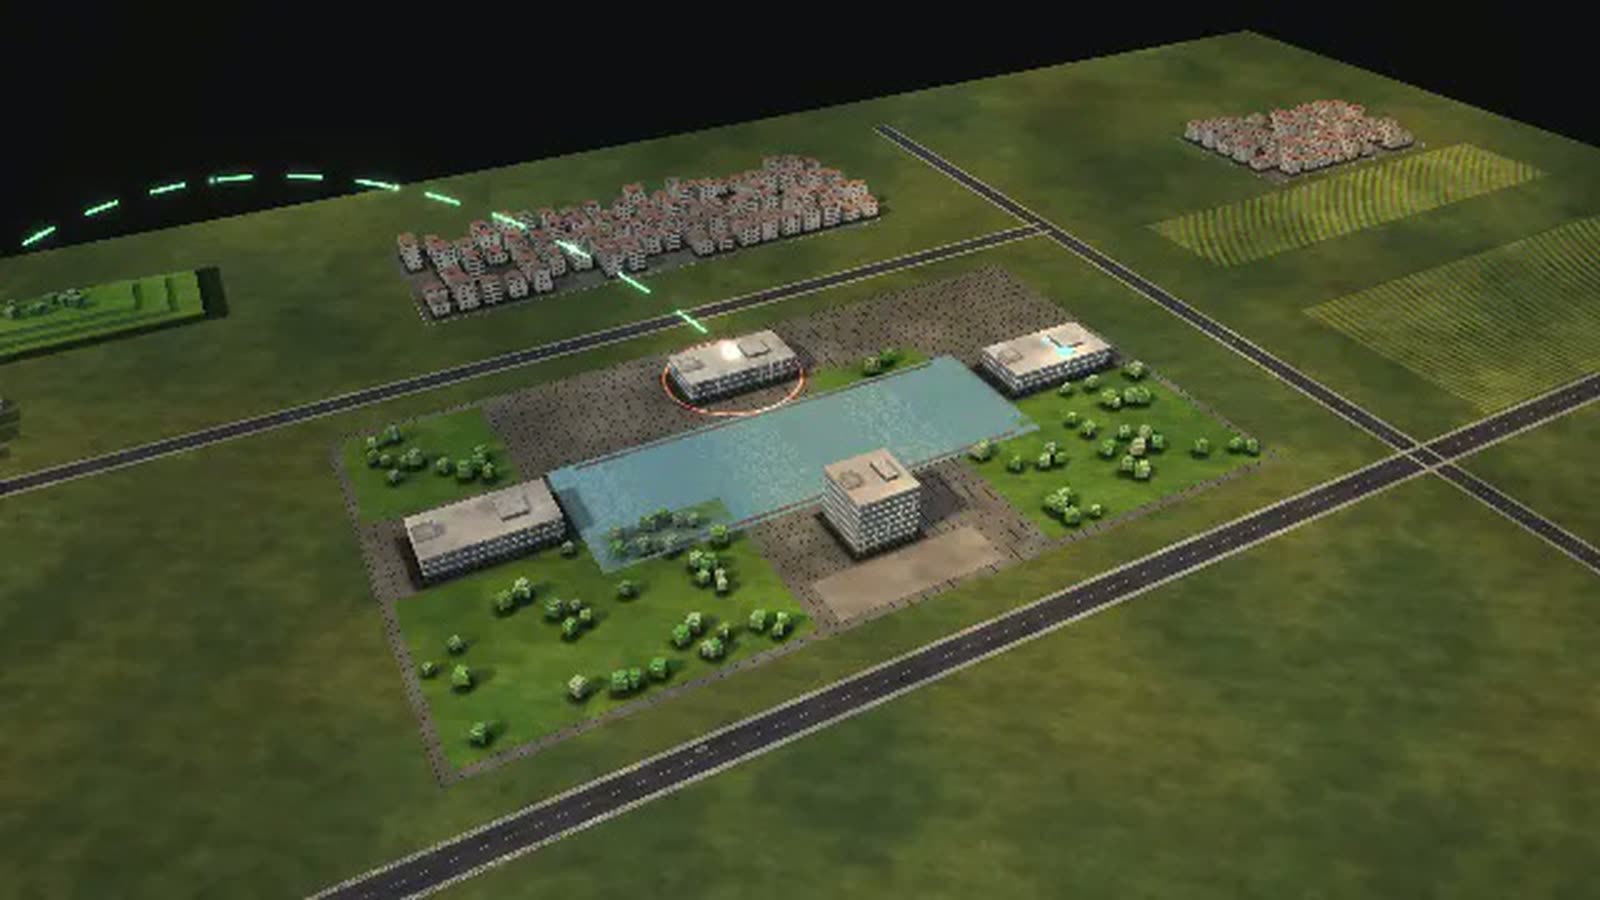
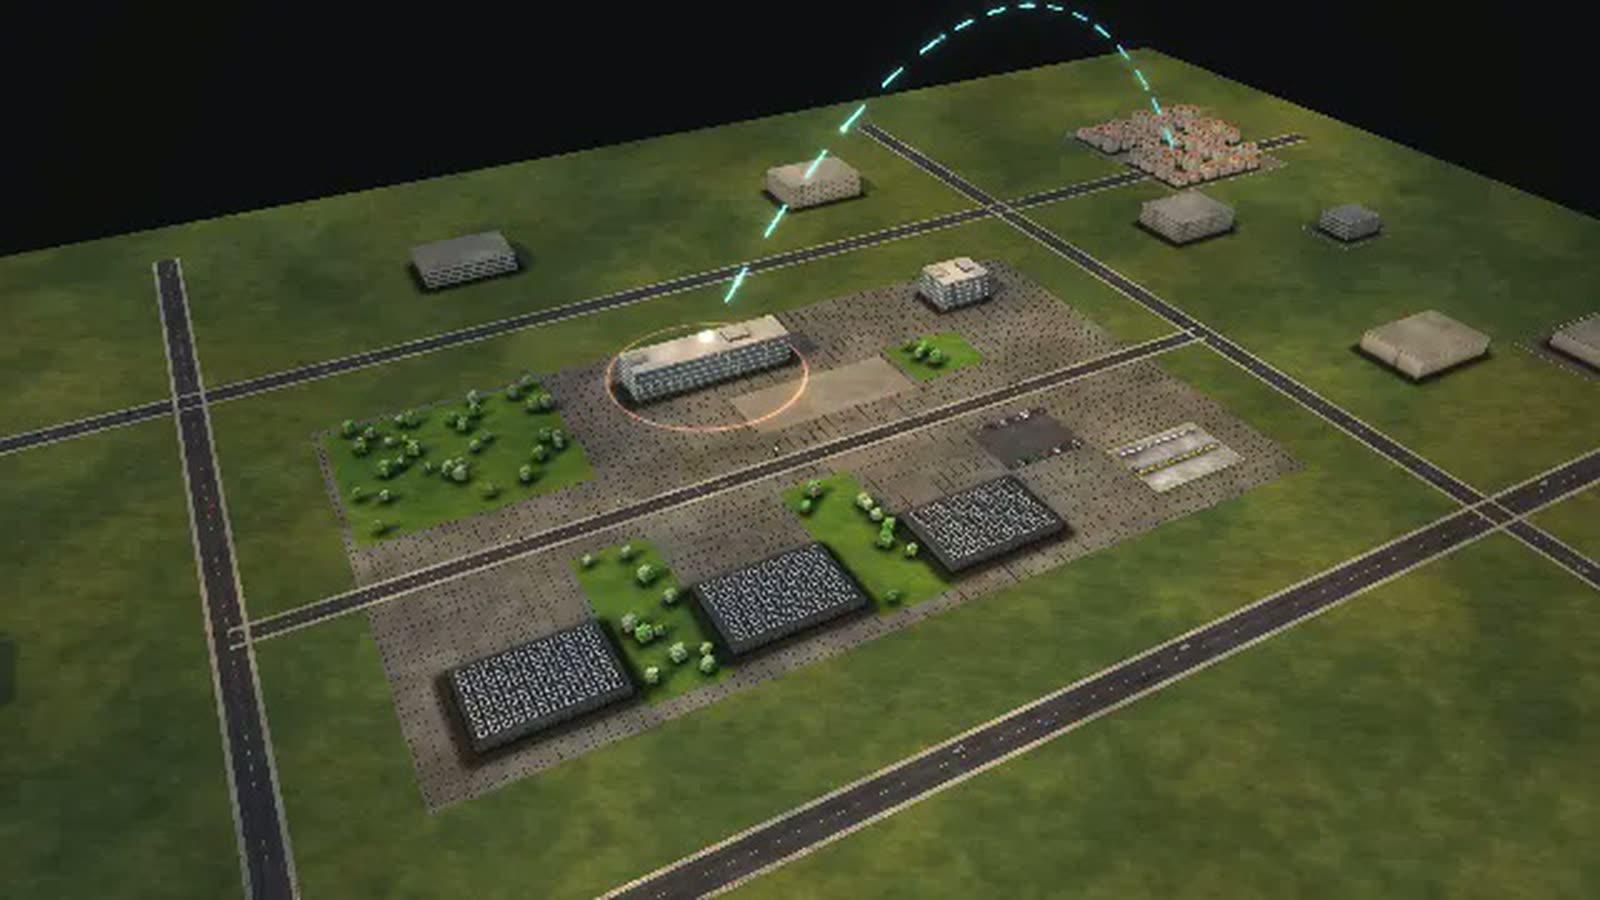
NETZ VELMERAU and all its quantities are invented. Fitted to your grid, the model shows things that appear on no single map today – such as real connection requests per local grid or the loading of your secondary substations.
How does the grid connection of a solar system or heat pump work? The fictional grid operator NETZ VELMERAU shows the process step by step. It connects everyone who asks, keeps the grid running around the clock and rebuilds it at the same time for heat pumps and solar.
The path of a connection request: an installer registers a solar system on the portal, small systems take the simplified route, larger ones go to grid planning for a load flow study, the approval goes out with a timetable, a contractor reinforces the grid where needed, then come meter exchange and register entry. Target in the model: timetable within eight weeks.
In a heat pump boom, grid planners become the bottleneck. Standardised connection packages take work off them, and remote-controlled substations let the control centre switch faster. The page is aimed at management, grid planning, operations, the control centre, metering and regulatory management.
A solar system or heat pump is to be connected
- 01
Installer submits the request: An installer registers a solar system with storage on the portal.
- 02
Grid connection checks the request: Small systems pass the simplified route, larger ones go to load flow.
- 03
Installer submits missing documents: The installer submits the data sheet.
- 04
Grid planning checks compatibility: Grid planning calculates: can the local feeder take the feed-in?
- 05
Approval with timetable: The approval goes out, with timetable and conditions.
- 06
Contractor reinforces the grid: A contractor lays a stronger cable.
- 07
Installer reports completion: The installer builds the system and reports completion.
- 08
Appointment at the customer: An appointment for the meter exchange is arranged.
- 09
Meter exchange: Metering installs a bidirectional meter.
- 10
Register and feed-in payment: Check against the market master data register, payment starts.
- 11
Connected.
How a grid operator can use the model
-
Internal communication
Control centre, three substations, grid depot, yard and administration on one site. Asset management, operations and connections see how their processes interlock – from request to fault.
Pour quiManagement, communications, all divisions
-
Onboarding
‘Who sits where – and reports to whom’ shows locations and responsibilities. New staff see which department takes over when, for a connection request or a cable fault.
Pour quiNew staff in connections, operations and metering
-
Training
Apprentices trigger ‘Storm’ and follow ‘A medium-voltage cable fails’: alarm, remote switching, fault location, excavation, cable joint, switching back to normal.
Pour quiElectrical apprentices, work-study students, fault crews
-
Explaining to installers and municipalities
Installers and local councils see where eight weeks pass and where years pass, as with a new substation. ‘Where the time goes’ makes the difference clear without jargon.
Pour quiConnections team, customer service, municipalities, installers
-
Strategic overview
Connection packages, more grid planners, remote-controlled substations and the pace of the smart meter rollout side by side. ‘What each control does’ ranks the levers for faster connections.
Pour quiManagement, regulatory management, asset management
What is shown – why – for whom
| Ce qui est montré | Pourquoi | Pour qui |
|---|---|---|
| Diagram ‘Where it gets tight’ in a heat pump boom | Pourquoishows grid planning at its limit | Pour quiManagement, grid planning |
| Diagram ‘What each control does’: connection packages, grid planners, remote-controlled substations | Pourquoiranks the levers for faster connections | Pour quiManagement, regulatory management |
| Diagram ‘The path across the site’: control centre, substations, depot | Pourquoishows the routes taken during faults | Pour quiGrid operations, control centre |
| Diagram ‘Where the time goes’: grid connection and substation | Pourquoishows where eight weeks pass and where years pass | Pour quiInstallers, municipalities |
| Diagram ‘Who sits where – and reports to whom’ | Pourquoishows locations and responsibilities | Pour quiOnboarding |
| Disruption ‘Storm’ with the process ‘A medium-voltage cable fails’ | Pourquoishows fault location and repair under pressure | Pour quiControl centre, crisis team |
| Process ‘A smart meter is installed’ | Pourquoisets the rollout against the number of fitters | Pour quiMetering |
Departments in the model
-
Management
Leads the grid company – independently of the group's sales.
-
Compliance officer (non-discrimination)
Ensures all suppliers are treated equally.
-
Asset management
Owner role: strategy, investment, condition of assets.
-
Grid planning
Load flow, target grid, (n-1): optimise first, then reinforce, then expand.
-
Regulatory management
Calculates costs and revenues for the regulator.
-
Grid control centre
Around the clock: switching, managing outages, planning outages.
-
Fault service
On standby: drives out, locates, repairs.
-
Maintenance
Maintains substations, stations and lines.
-
Construction and project delivery
Builds lines, stations and substations.
-
Grid connection
Checks requests for solar systems, heat pumps and charging points.
-
Customer service and outage hotline
Takes reports and informs during outages.
-
Metering
Installs meters and smart metering systems.
-
Network economics
Network charges, market communication, feed-in payments.
-
IT and control technology
Grid control system, geodata, meter data – isolated.
All processes in the model
A solar system or heat pump is to be connected
- 01Installer submits the request: An installer registers a solar system with storage on the portal.
- 02Grid connection checks the request: Small systems pass the simplified route, larger ones go to load flow.
- 03Installer submits missing documents: The installer submits the data sheet.
- 04Grid planning checks compatibility: Grid planning calculates: can the local feeder take the feed-in?
- 05Approval with timetable: The approval goes out, with timetable and conditions.
- 06Contractor reinforces the grid: A contractor lays a stronger cable.
- 07Installer reports completion: The installer builds the system and reports completion.
- 08Appointment at the customer: An appointment for the meter exchange is arranged.
- 09Meter exchange: Metering installs a bidirectional meter.
- 10Register and feed-in payment: Check against the market master data register, payment starts.
- 11Connected.
A medium-voltage cable fails
- 01Protection trips, alarm in the control room: A cable breaks down, protection trips. In the control room the section lights up red.
- 02Switch remotely: The control centre isolates the section and resupplies the rest via the ring.
- 03Hotline and fault service run in parallel.
- 04Outage hotline and outage page: The hotline takes calls, the outage page shows the area.
- 05Fault service drives out: The fault service drives to the station.
- 06The team is on site.
- 07Locating the cable fault: A test van locates the fault in the cable.
- 08Emergency generator or temporary fix: An emergency generator supplies the last customers.
- 09Contractor digs up: A contractor digs up the street.
- 10Fitting a cable joint: Fitters install a cable joint.
- 11Switch back to normal state: The control centre switches back to the normal state.
- 12Documentation for outage statistics: The fault goes into the statistics.
- 13Fixed.
A substation is built
- 01Need from the grid expansion plan: Grid planning sees: in the west capacity no longer suffices for heat pumps and charging points.
- 02Investment approval: Asset management approves the investment.
- 03Assess costs under regulation: Regulatory management assesses: will the costs be recognised?
- 04Permit and transformer run in parallel.
- 05Permit: The authority approves the substation.
- 06Order transformer (lead time): The transformer is ordered.
- 07Approved, transformer on its way.
- 08Construction: switchgear, protection, cables: Switchgear, protection and cables are built.
- 09Control centre plans the outages: The control centre plans which lines are switched off for the tie-in.
- 10Commissioning, entry into the control system: The substation goes into operation and appears on the grid display.
- 11In operation.
A smart meter is installed
- 01Plan installation: Metering plans the installation at a household with a heat pump.
- 02Appointment at the customer: Appointment at the customer.
- 03Meter exchange: The fitters install meter and gateway.
- 04Set up and connect the gateway: The gateway is set up and securely connected.
- 05Installed.
What you can change
Controls
- Connection requests: Subsidy schemes make requests jump.
- Standardised connection packages: More requests take the simplified route, grid planning is relieved (model assumption).
- Grid planners: How many load flow studies run at once.
- Remote-controlled substations: The control centre switches faster (model assumption).
- Smart meter rollout: More installations tie up the same fitters.
Disruptions
- Storm: For a day trees fall into lines: twenty times as many faults, location and repair take longer.
- Excavator damages a cable: For two hours faults pile up in a construction area.
- Grid control system fails: For two hours the control centre cannot switch remotely.
- Transformer shortage: For a year transformers take even longer.
What the model gives a grid operator
-
01
The bottleneck has a name
Set connection requests to heat pump boom and the queue at grid planning visibly grows – and a tip at the bottleneck names the control that relieves it.
-
02
Operating and expanding at once
Connection, cable fault, substation build and smart meter installation run in parallel. More installations tie up the same fitters, and the model shows where that gets tight.
-
03
Faults with routes
In a storm, ‘The path across the site’ shows the fault crews moving between control centre, depot and substations.
-
04
Supply chains in view
The ‘Transformer shortage’ disruption stretches the substation build. It shows what a year of extra lead time means for grid expansion.
-
05
For committees and big screens
A browser is enough, and large projections work too – so the model can be shown in council committees, at installer events or in your own lobby.
Basis and limits
Fictional grid operator · model based on researched industry structures · no forecast for real companies
1 case = 1 connection request, 1 fault, 1 substation or 10 smart meters · 1 figure ≈ 25 employees
All volumes, durations, rates and capacities are model assumptions, not values of a real grid operator.
Here the target counts as met when the installer has the timetable; construction and meter exchange follow.
Documented: timetable for connection requests within eight weeks, reporting of interruptions over three minutes, unbundling from sales.
Public sources the model is based on:
- Energiewirtschaftsgesetz (u. a. §§ 7, 7a, 11, 14a, 14d, 52)
- Bundesnetzagentur: Monitoringbericht
- Netzentwicklungsplan Strom (NOVA-Prinzip)
- Anreizregulierungsverordnung
- Erneuerbare-Energien-Gesetz § 8
Your grid as a model
Want to show your connection process, your control centre or your grid expansion? We talk about your data and goals. For a first impression you get the password to the simulation from us – just ask.
cube4tec.de/spiele/minimal-organization/
Poser une question à ce sujet
Minimal Organization: Stromnetzbetreiber
Similar business models
-
Energy supplier
An energy group without its own grid as a walkable model: supplier switching within 24 hours, power trading until noon, and gas, wind and solar on one site.
-
Water and wastewater utility
A water utility as a walkable model: from the reservoir to the treatment plant, with the path of a drinking water sample through the lab to the public health office.
-
Heating, plumbing and electrical contractor
A heating, plumbing and electrical contractor as a walkable model: what happens after a breakdown call, why the right part in the van matters and when the emergency service hits its limit.
-
Construction group
A construction and infrastructure group as a walkable model: see how a viaduct is built section by section and where frost, inspections and variations cost time.
-
City administration
A large city's administration as a walkable model: see how a building application moves through the departments, how council and committees meet and where people queue at the counter.
-
Online retail
An order from click to doorstep as a walkable model: payment check, warehouse, packing, trucks, sortation and delivery in a running simulation.
-
Search engine
A search and advertising group as a walkable model: auctions in milliseconds, experiments over weeks, and a new ad campaign that waits for people.
-
Cloud provider
A cloud provider as a walkable model: support cases, zone outages and new data centres on three time scales, in a running simulation.
NETZ VELMERAU and all its quantities are invented. Fitted to your grid, the model shows things that appear on no single map today – such as real connection requests per local grid or the loading of your secondary substations.