
Simulation · Minimal Organization · Logistics and transport
Parcel service
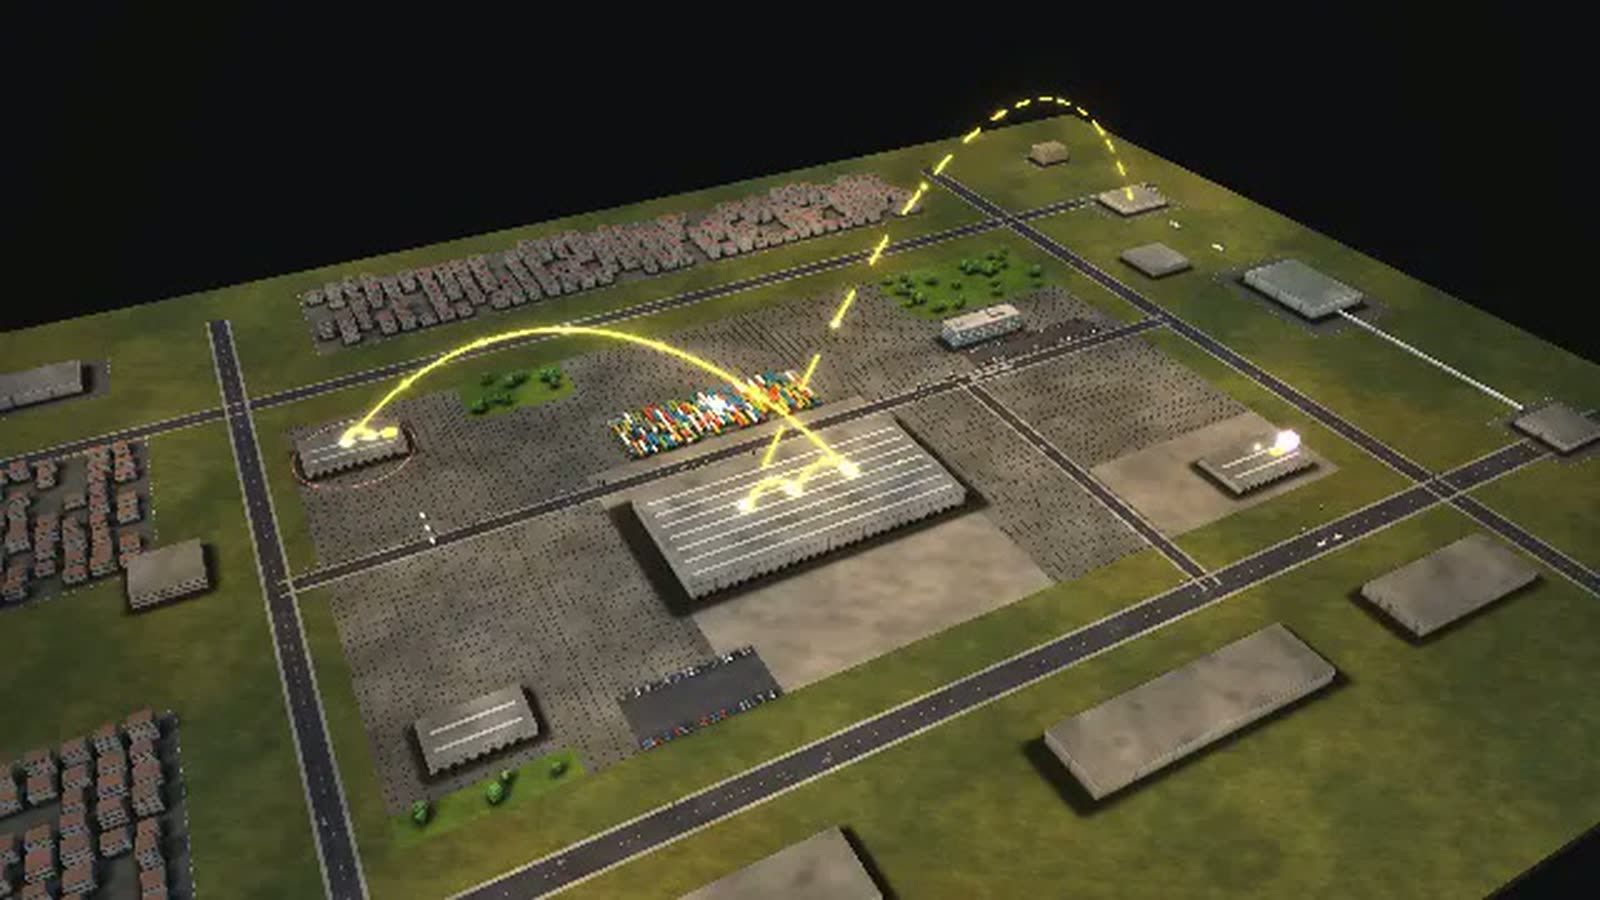
A parcel service as a walkable model: the overnight run through the hub, sorter and shuttles, then the morning route to the doorstep.
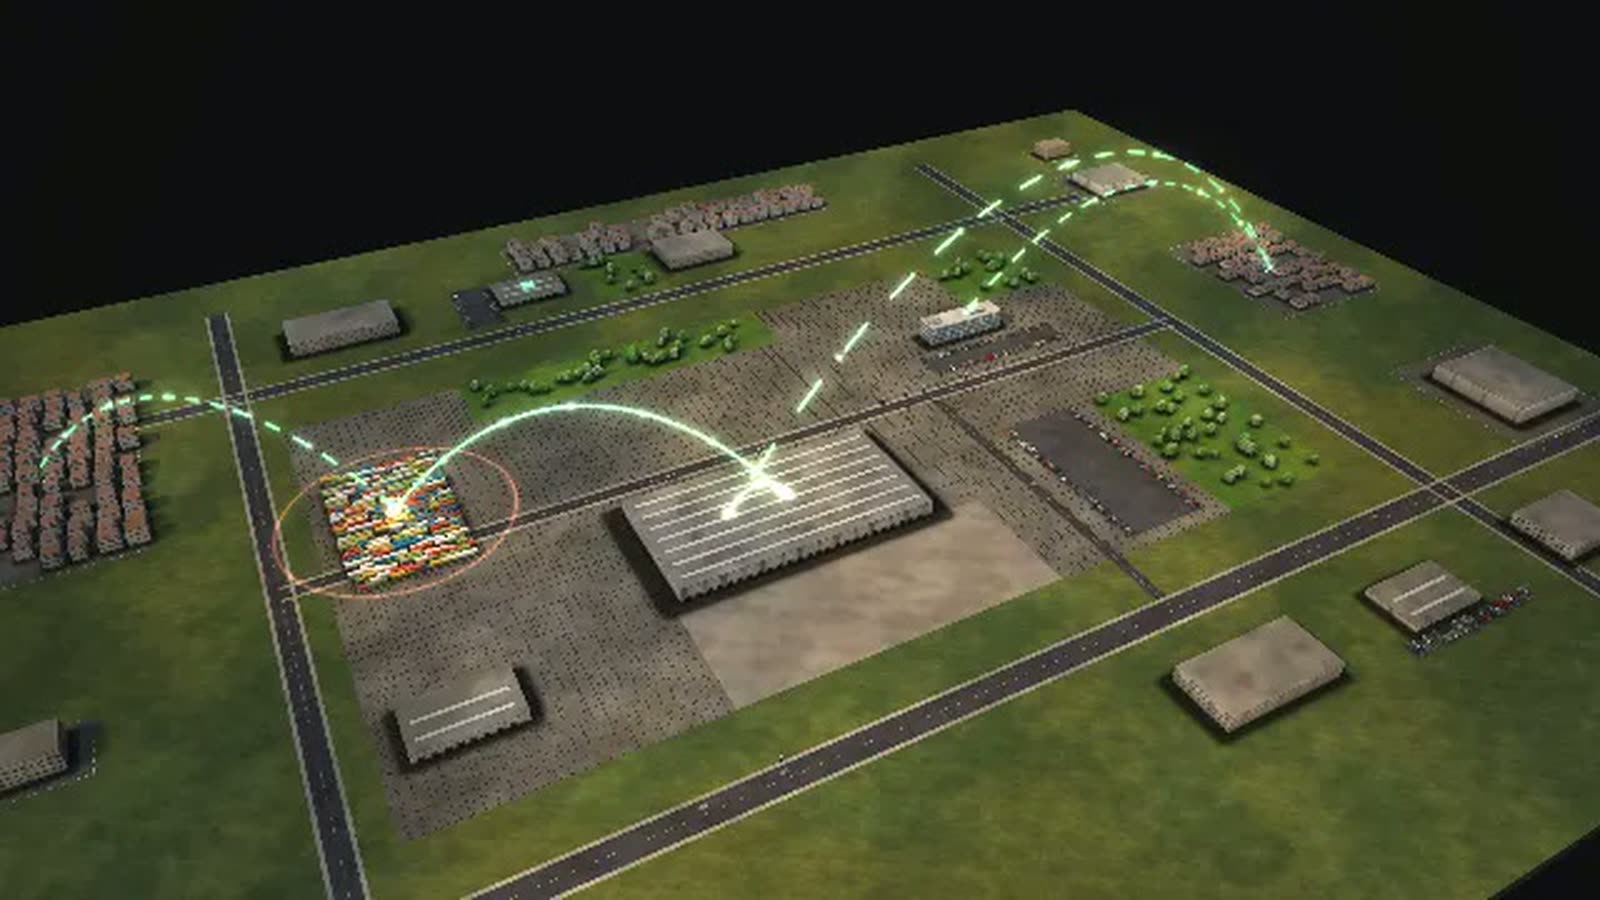
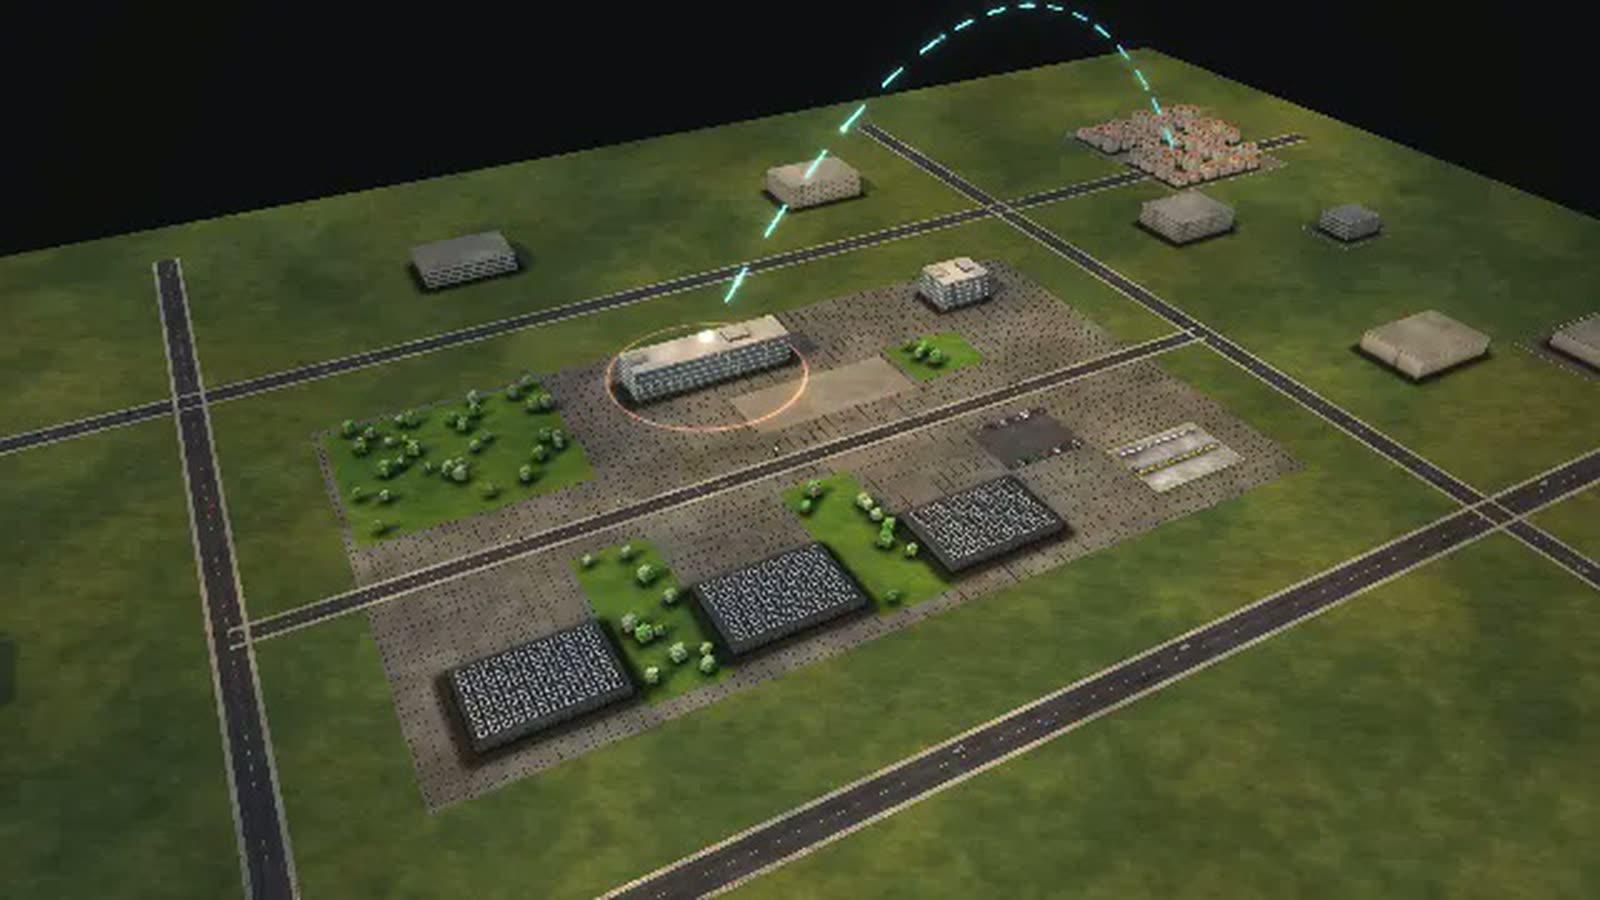
All data are fictional – QUENDO PAKET does not exist. The model can be fitted to your network's real data and filled with what today only sits in lists: parcel volumes per hour and dock door, or first-attempt delivery rates per district.
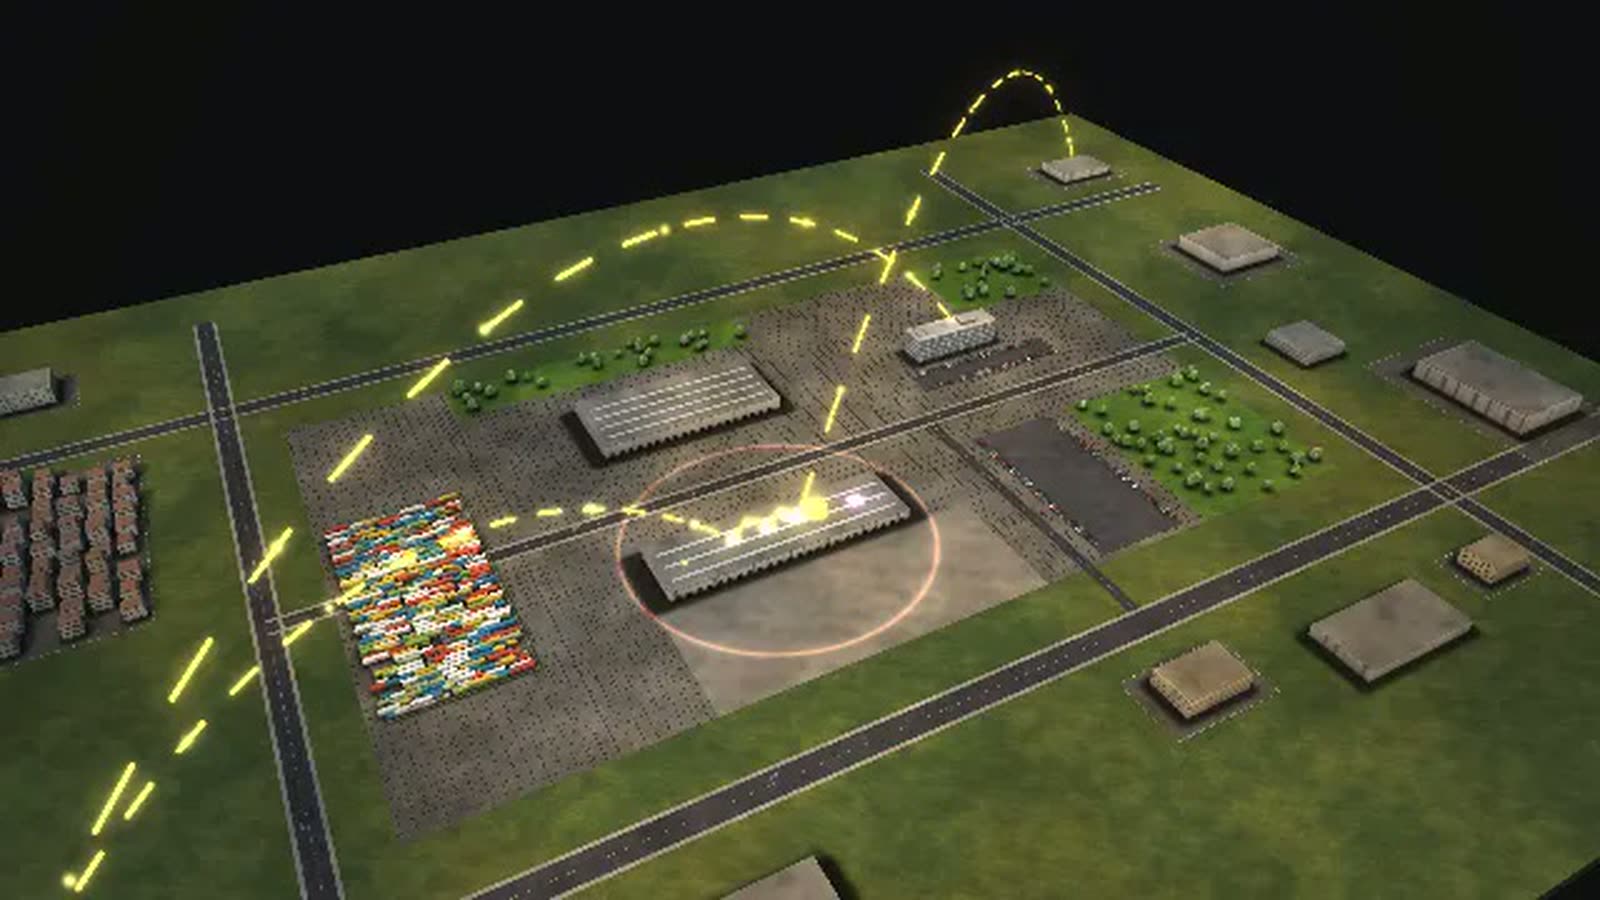
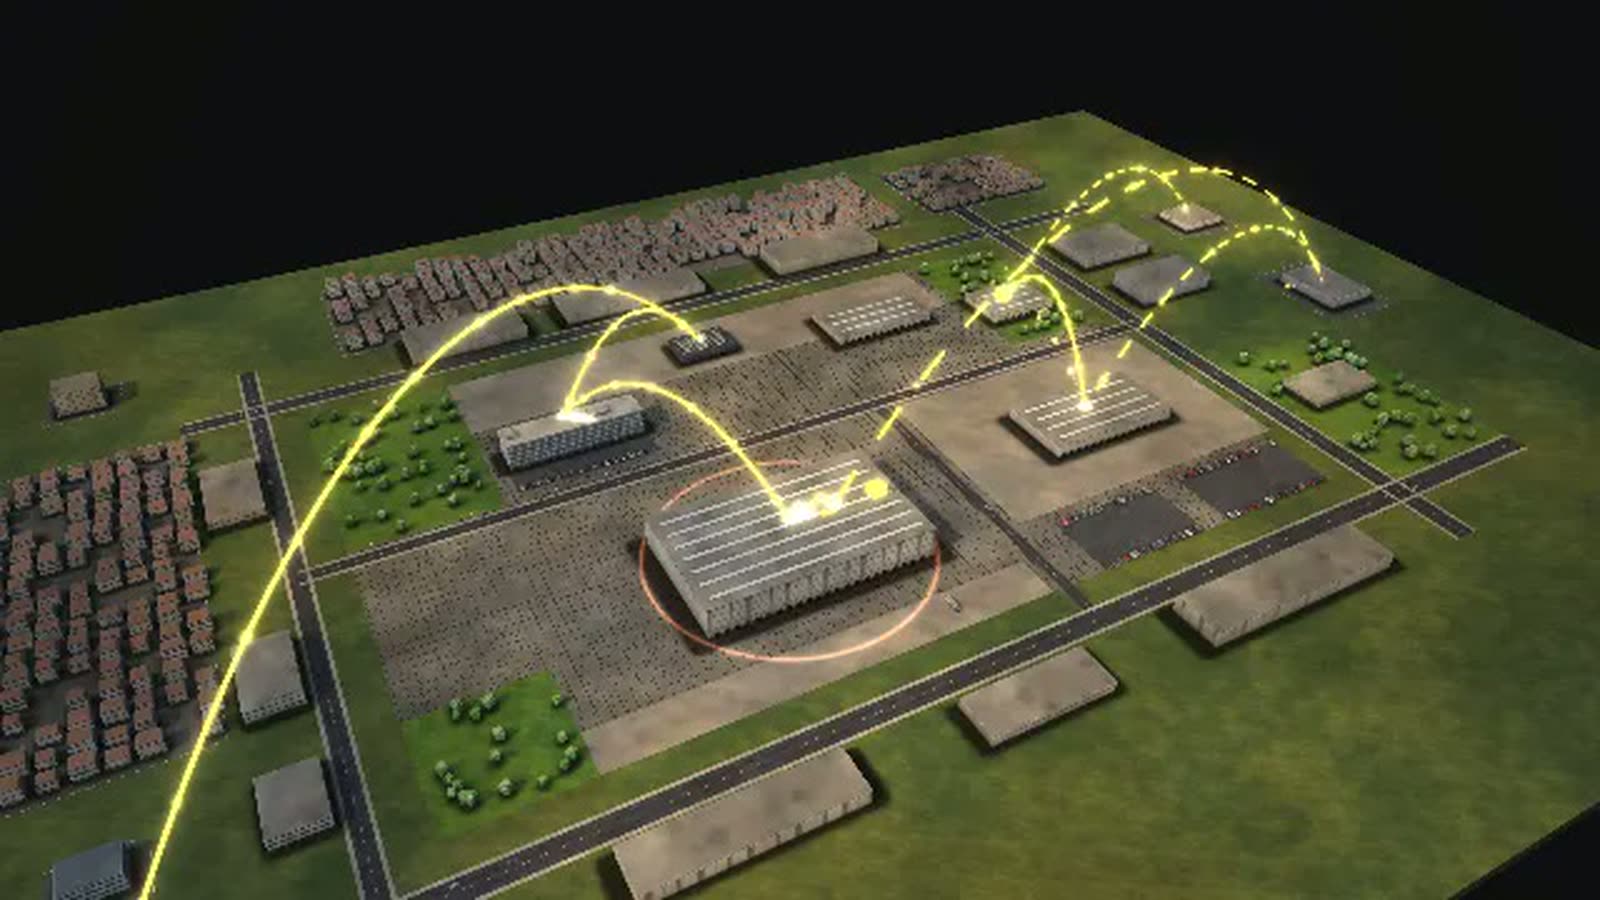
A parcel hub process simulation – and everything that follows. At QUENDO PAKET, a fictional parcel and express service, thousands of parcels run through the hub at night, and at eight in the morning the delivery routes head out. The overnight run moves like a wave through the dock doors, the sorter and the shuttles to delivery stations north and south. The target in the model: delivered the day after arriving at the hub.
The site holds the parcel hub, the swap body yard, network control and administration, two delivery stations, and fleet and workshop. Before Christmas, or when trucks are stuck in traffic, the wave arrives too late and the parcel misses the morning route. Safe places and lockers decide how often nobody is home. If the sorter breaks down, parcels are sorted by hand and everything takes three times as long.
The subcontractor share, first-attempt delivery rate and arrival times are model assumptions. Documented in the sources: hub-and-spoke with an overnight run, main contractor liability for subcontractors, and postal regulation. This page is for network planning, hub and shift management, delivery, sales and senior management.
A parcel arrives overnight
- 01
Trucks from the network: A truck from another hub arrives at night.
- 02
Unloading at the doors: The swap body is unloaded, every parcel scanned.
- 03
Sorting system: The sorter reads the label and sends the parcel to the chute of its delivery station.
- 04
Shuttle to delivery stations (hourly): Every hour a shuttle goes to the delivery stations.
- 05
District sorting north: At delivery station north parcels are sorted by district and stop order.
- 06
District sorting south: At delivery station south parcels are sorted by district and stop order.
- 07
Route start north (8 am): Routes leave at 8 am. Whatever is not there goes tomorrow.
- 08
Route start south (8 am): Routes leave at 8 am. Whatever is not there goes tomorrow.
- 09
Delivery (own drivers): A courier brings the parcel to the door.
- 10
Delivery (subcontractors): A driver from a partner company delivers.
- 11
Failed attempt: back to the depot: Nobody home: the parcel comes back and goes out again tomorrow.
- 12
Collection at parcel shop: The parcel waits at a parcel shop or locker.
- 13
Delivered.
- 14
Left with a neighbour.
- 15
Collected.
How a parcel service can use the model
-
Internal communication
Hub, swap body yard, network control and delivery stations in one picture: night shift and morning shift see how their work interlocks.
Pour quiSenior management, site management, internal comms
-
Onboarding
‘The path across the site’ shows newcomers the routes and handovers in the hub: dock doors, sorter, swap bodies, shuttle to the stations north and south.
Pour quiNew staff in hub, loading and delivery
-
Training
The disruption ‘Sorter breakdown’ brings three hours of partial failure. The control tower switches to manual sorting, and the backlog becomes visible on the site.
Pour quiHub and engineering trainees, shift leads
-
Explaining to customers
Show shippers why the 10:30 pm cut-off matters: trucks into the network, sorting during the night, routes out at 8 am.
Pour quiBusiness sales, customer service, shippers
-
Strategic overview
More safe places and lockers, an upgraded sorter or more routes per station: the controls show what keeps the morning route on time before Christmas.
Pour quiSenior management, network planning, product development
What is shown – why – for whom
| Ce qui est montré | Pourquoi | Pour qui |
|---|---|---|
| Diagram ‘Year, week, day’: trucks at 10:30 pm, sorting at night, routes at 8 am | PourquoiExplains the overnight run. | Pour quiNetwork planning, shippers |
| Diagram ‘The path across the site’: dock doors, sorter, swap bodies, delivery stations | PourquoiShows routes and handovers in the hub. | Pour quiHub management, shift leads |
| Diagram ‘Where it gets tight’ before Christmas | PourquoiShows which station puts the morning route at risk. | Pour quiNetwork control tower, senior management |
| Diagram ‘Where the site gets tight’ when the sorter breaks down | PourquoiShows the backlog in the hub. | Pour quiEngineering, hub management |
| Diagram ‘How a case flows’: own drivers, subcontractors, parcel shop | PourquoiShows the share of each delivery route. | Pour quiDelivery, procurement |
| Control ‘Safe places and lockers’ | PourquoiShows the value of fewer second delivery attempts. | Pour quiProduct development, local authorities |
| Resources view above the delivery stations in the morning | PourquoiShows where parcels are left behind. | Pour quiDelivery station managers |
Departments in the model
-
Management board
Leads network, sales and finance.
-
Network control tower
Monitors volumes, trucks and systems across the network at night and decides on disruptions: wait, reroute, sort by hand.
-
Network and line planning
Plans which trucks run between hubs and when.
-
Business sales
Wins shippers and agrees pick-up times and prices.
-
Customer service
Helps with queries, lost and damaged parcels.
-
Finance
Bills shippers and pays subcontractors.
-
IT and tracking
Every scan becomes an event in tracking.
-
Security and compliance
Checks subcontractors, working hours and safety.
-
Hub inbound
Unloads trucks and swap bodies and puts parcels on the belt.
-
Sorting
The system reads every label and sends the parcel to the right chute.
-
Loading
Loads trucks to delivery stations and other hubs – at fixed departure times.
-
Pick-up
Collects parcels from business customers in the afternoon.
-
Delivery
Sorts by district and drives the routes – about 150 stops per route (model assumption).
-
Fleet and workshop
Keeps vans and trucks running, charges the electric fleet.
All processes in the model
A parcel arrives overnight
- 01Trucks from the network: A truck from another hub arrives at night.
- 02Unloading at the doors: The swap body is unloaded, every parcel scanned.
- 03Sorting system: The sorter reads the label and sends the parcel to the chute of its delivery station.
- 04Shuttle to delivery stations (hourly): Every hour a shuttle goes to the delivery stations.
- 05District sorting north: At delivery station north parcels are sorted by district and stop order.
- 06District sorting south: At delivery station south parcels are sorted by district and stop order.
- 07Route start north (8 am): Routes leave at 8 am. Whatever is not there goes tomorrow.
- 08Route start south (8 am): Routes leave at 8 am. Whatever is not there goes tomorrow.
- 09Delivery (own drivers): A courier brings the parcel to the door.
- 10Delivery (subcontractors): A driver from a partner company delivers.
- 11Failed attempt: back to the depot: Nobody home: the parcel comes back and goes out again tomorrow.
- 12Collection at parcel shop: The parcel waits at a parcel shop or locker.
- 13Delivered.
- 14Left with a neighbour.
- 15Collected.
A shipper sends parcels
- 01Pick-up round at shipper: In the afternoon a driver collects parcels from the online shop.
- 02Unloading at the doors: Unloading and inbound scan.
- 03Sorting system: The sorter sorts by destination region.
- 04Line haul into the network (10:30 pm): At 10:30 pm trucks leave into the network.
- 05Destination hub in the network: Another hub takes over and delivers the next day.
- 06Stays in the region for tomorrow's delivery.
- 07In the network on its way to the recipient.
A return goes back
- 01Drop-off at parcel shop: A customer drops her return at a parcel shop.
- 02Parcel shop collection (5 pm): At 5 pm the parcel shops are emptied.
- 03Unloading at the doors: Arrival at the hub.
- 04Sorting system: Sorted to the retailer's returns warehouse.
- 05Line haul into the network (10:30 pm): Line-haul departure.
- 06Retailer returns warehouse: The retailer's returns warehouse receives the consolidated shipment.
- 07Arrived at the retailer.
What you can change
Controls
- Parcel volume: More parcels across the network – much more in December.
- Sorting system: How many parcels the sorter handles per hour (belts, staff).
- Routes per station: How many parcels can go out on routes in the morning.
- Safe places and lockers: More safe places means fewer "nobody home".
- Line-haul trucks: How many parcels leave into the network at 10:30 pm.
Disruptions
- Sorter breakdown: Three hours of partial failure: the control tower switches to manual sorting – everything takes three times as long.
- Trucks stuck in traffic: For six hours trucks from the network arrive late.
- Black ice: A day of black ice: routes take almost twice as long.
What the model gives a parcel service
-
01
The night made visible
What normally happens out of sight inside the hub runs in the model as a wave across the site, station by station.
-
02
Pre-Christmas bottleneck
The simulation works with queues. As volumes rise, ‘Where it gets tight’ shows which station endangers the morning route.
-
03
Fewer second attempts
The ‘Safe places and lockers’ control shows how much less often nobody is home – a point worth making when talking to local authorities.
-
04
Disruptions without damage
Sorter breakdown, trucks stuck in traffic, black ice: trigger any disruption and see how long the network needs to catch up.
-
05
For the control room and the big screen
Walkable in the browser and on large projections; 14 diagrams are calculated live from the running model.
Basis and limits
Fictional parcel service · model based on researched industry structures · no forecast for real companies
1 case in the model = 200 parcels · 1 figure ≈ 25 employees
All volumes, durations, rates and capacities are model assumptions, not values of a real parcel service.
Share of subcontractors, first-attempt rate and arrival times: model assumptions.
Documented: hub-and-spoke network with overnight transport, subcontractor liability, postal supervision by the Federal Network Agency.
Public sources the model is based on:
- Bundesnetzagentur: Marktbeobachtung Post
- BIEK KEP-Studie 2023
- Paketboten-Schutz-Gesetz (BMAS)
- Postgesetz (PostG 2024)
Your parcel network as a model
Would you like to see your hub, delivery stations or Christmas peak like this? Call or write to us and we'll discuss which sorting and delivery data the model needs. The QUENDO PAKET password is available on request.
cube4tec.de/spiele/minimal-organization/
Poser une question à ce sujet
Minimal Organization: Paketdienst
Similar business models
-
Freight forwarder
A freight forwarder as a walkable model: groupage, ocean and air freight, cross-docking and customs in a running simulation.
-
Online retail
An order from click to doorstep as a walkable model: payment check, warehouse, packing, trucks, sortation and delivery in a running simulation.
-
Food retail
A food retailer as a walkable model: fresh produce from automatic ordering through the night in the distribution centre to the shelf before opening.
-
Container shipping line
A container line with its own terminal as a walkable model: gate, yard, stowage plan and quay cranes, timed by a fixed schedule.
-
Industrial bakery
An industrial bakery with 120 shops as a walkable model: how rolls get from the night plan to the counter by 6 am and where oven, proofer or routes hold them up.
-
Airport
An airport as a walkable model: passengers from check-in through security to the gate, plus baggage, turnaround and winter operations.
-
Search engine
A search and advertising group as a walkable model: auctions in milliseconds, experiments over weeks, and a new ad campaign that waits for people.
-
Cloud provider
A cloud provider as a walkable model: support cases, zone outages and new data centres on three time scales, in a running simulation.
All data are fictional – QUENDO PAKET does not exist. The model can be fitted to your network's real data and filled with what today only sits in lists: parcel volumes per hour and dock door, or first-attempt delivery rates per district.