
Simulation · Minimal Organization · Logistics and transport
Food retail
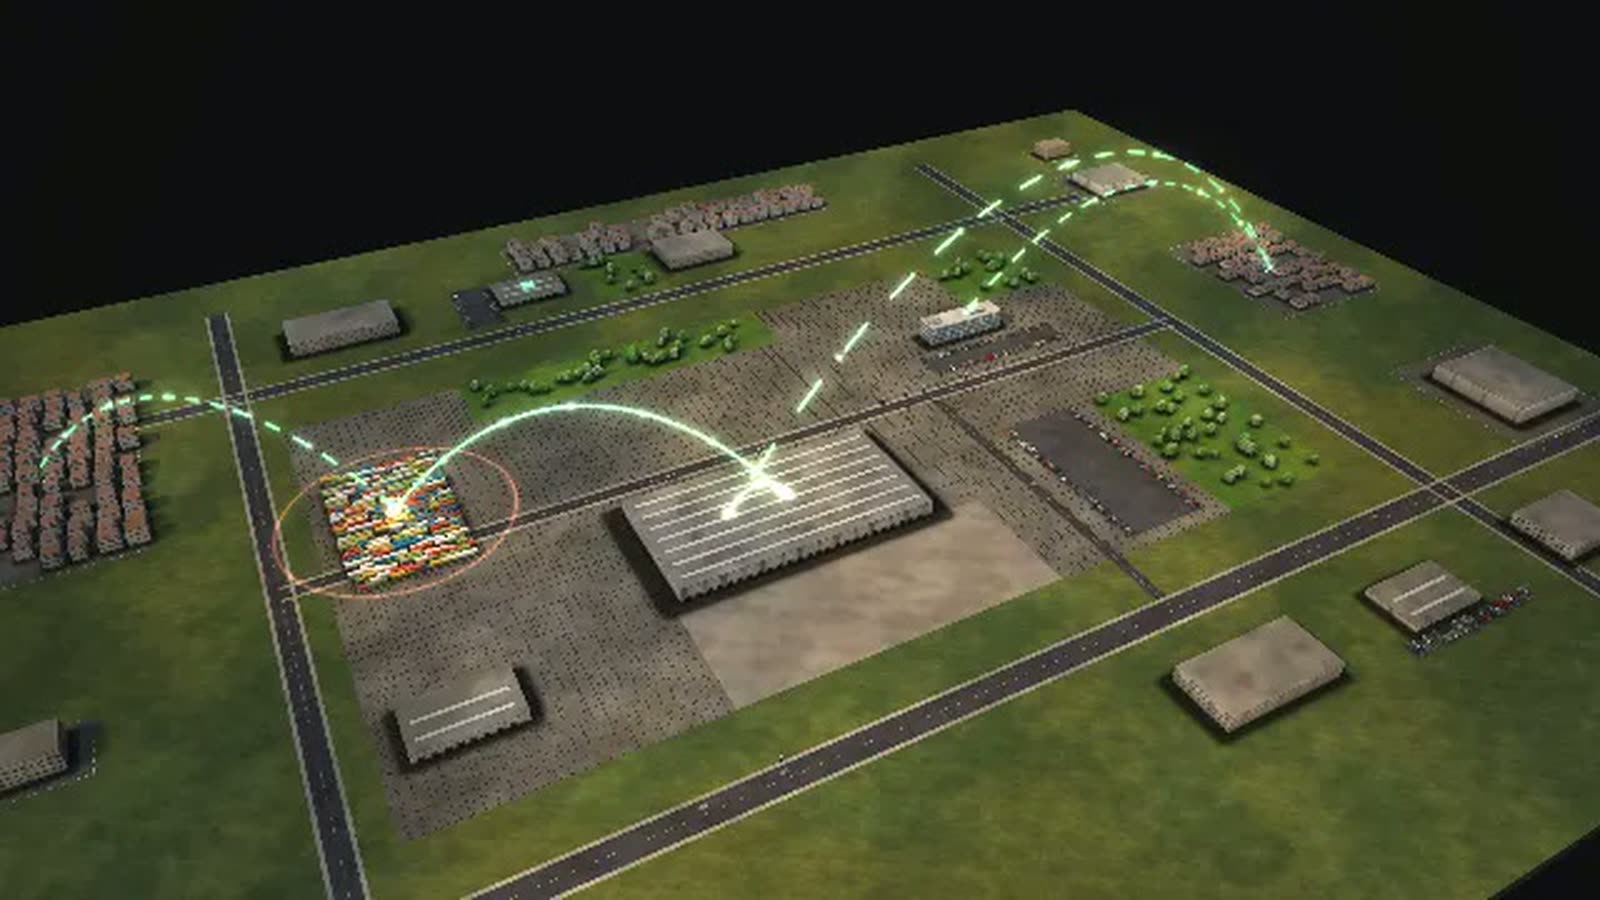
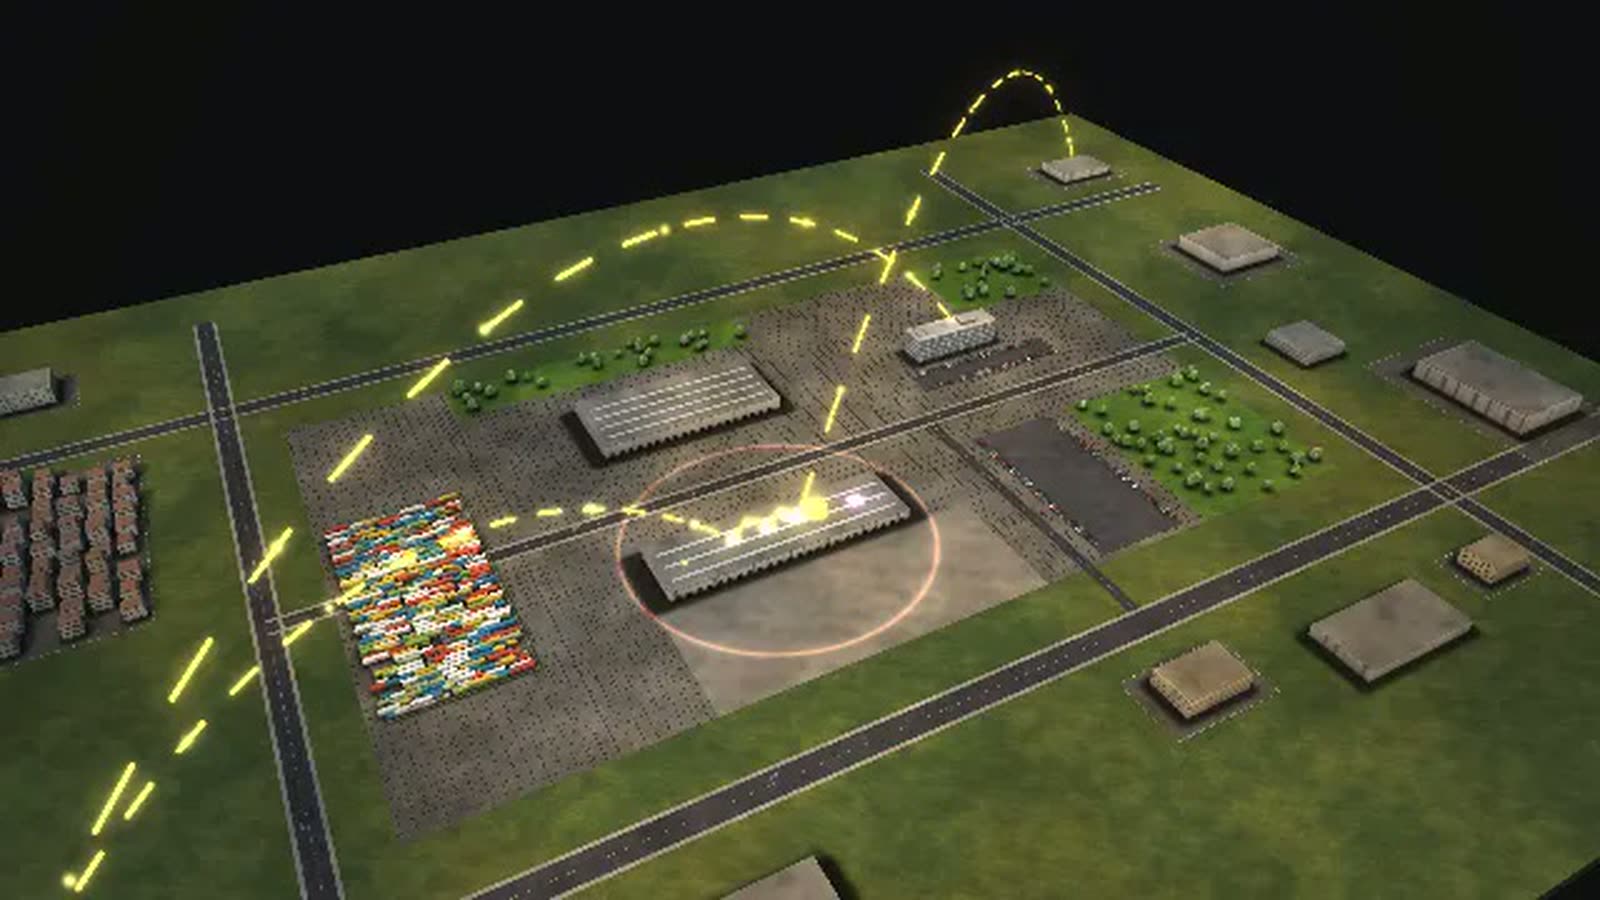
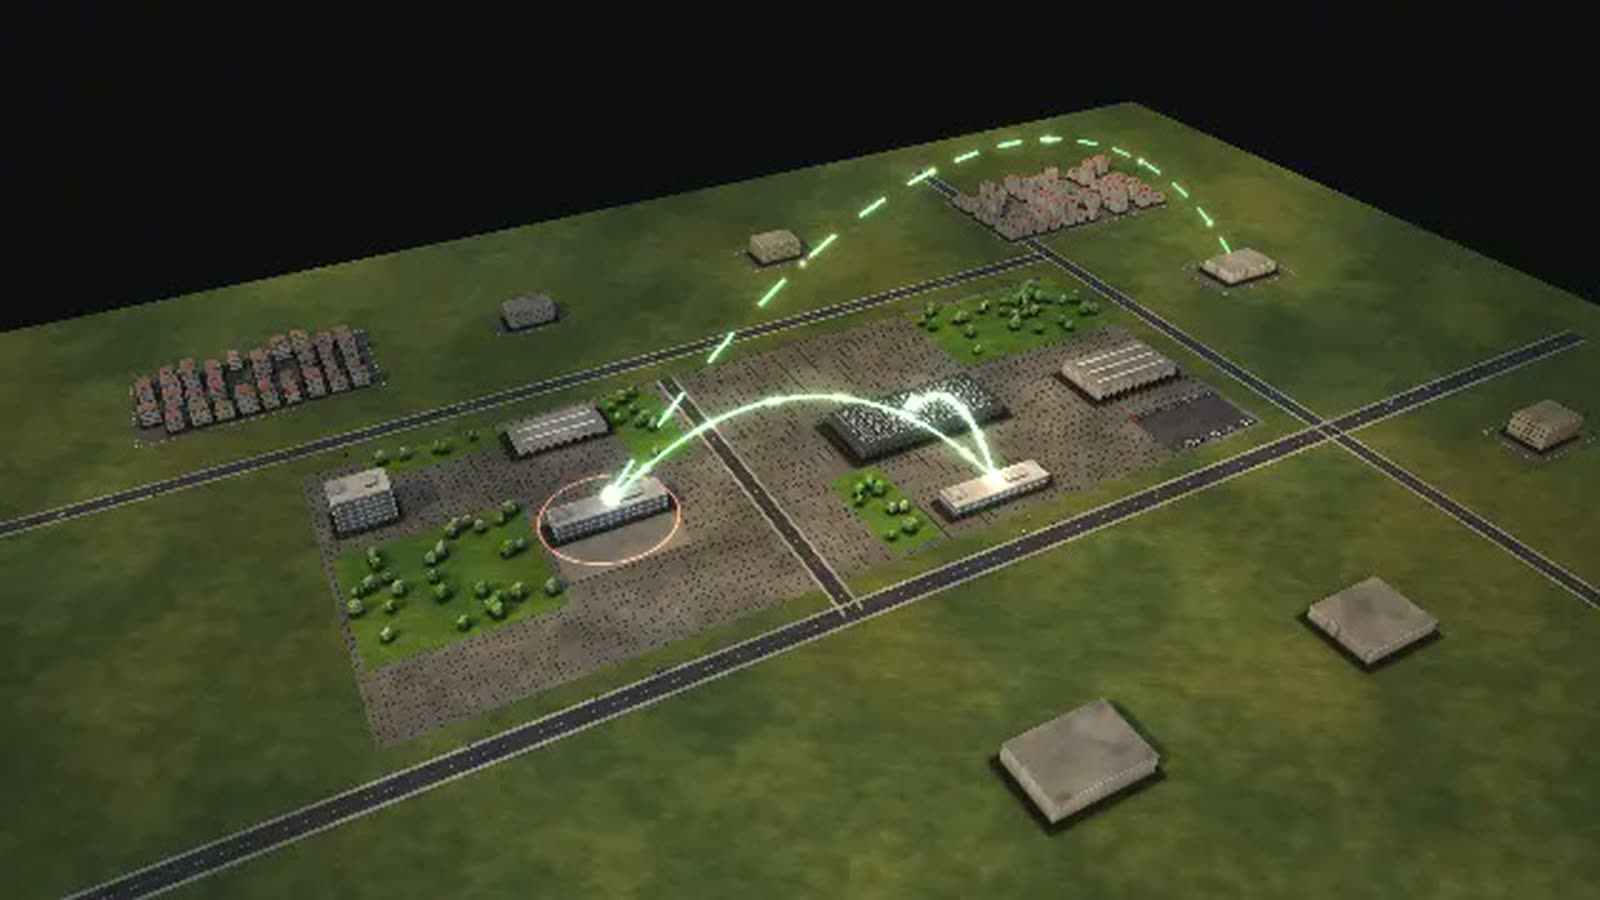
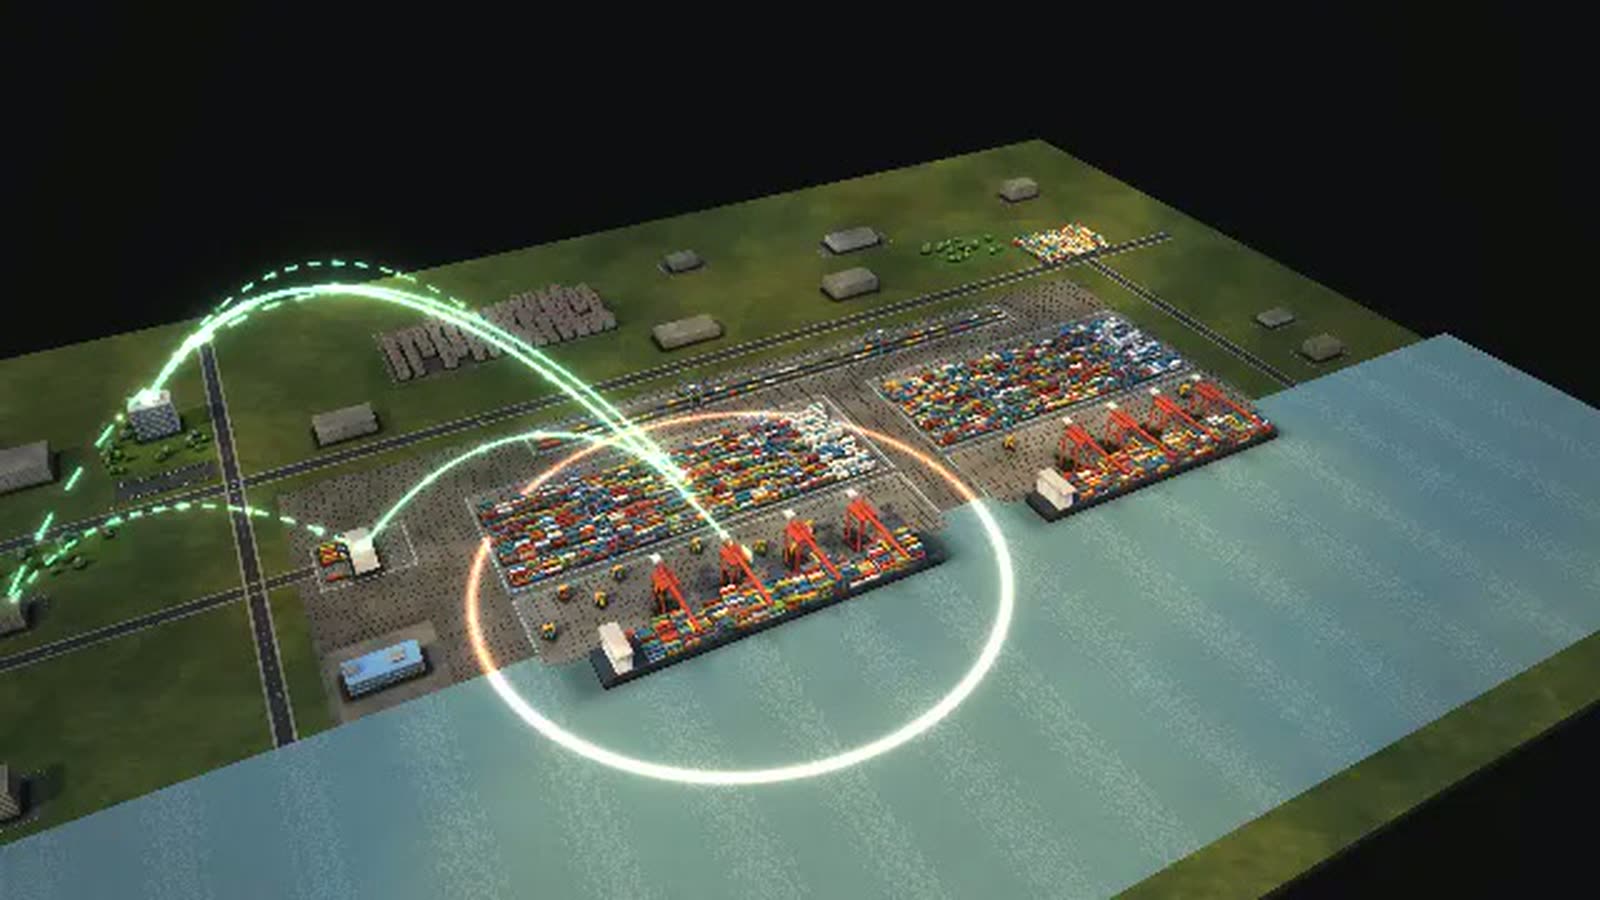
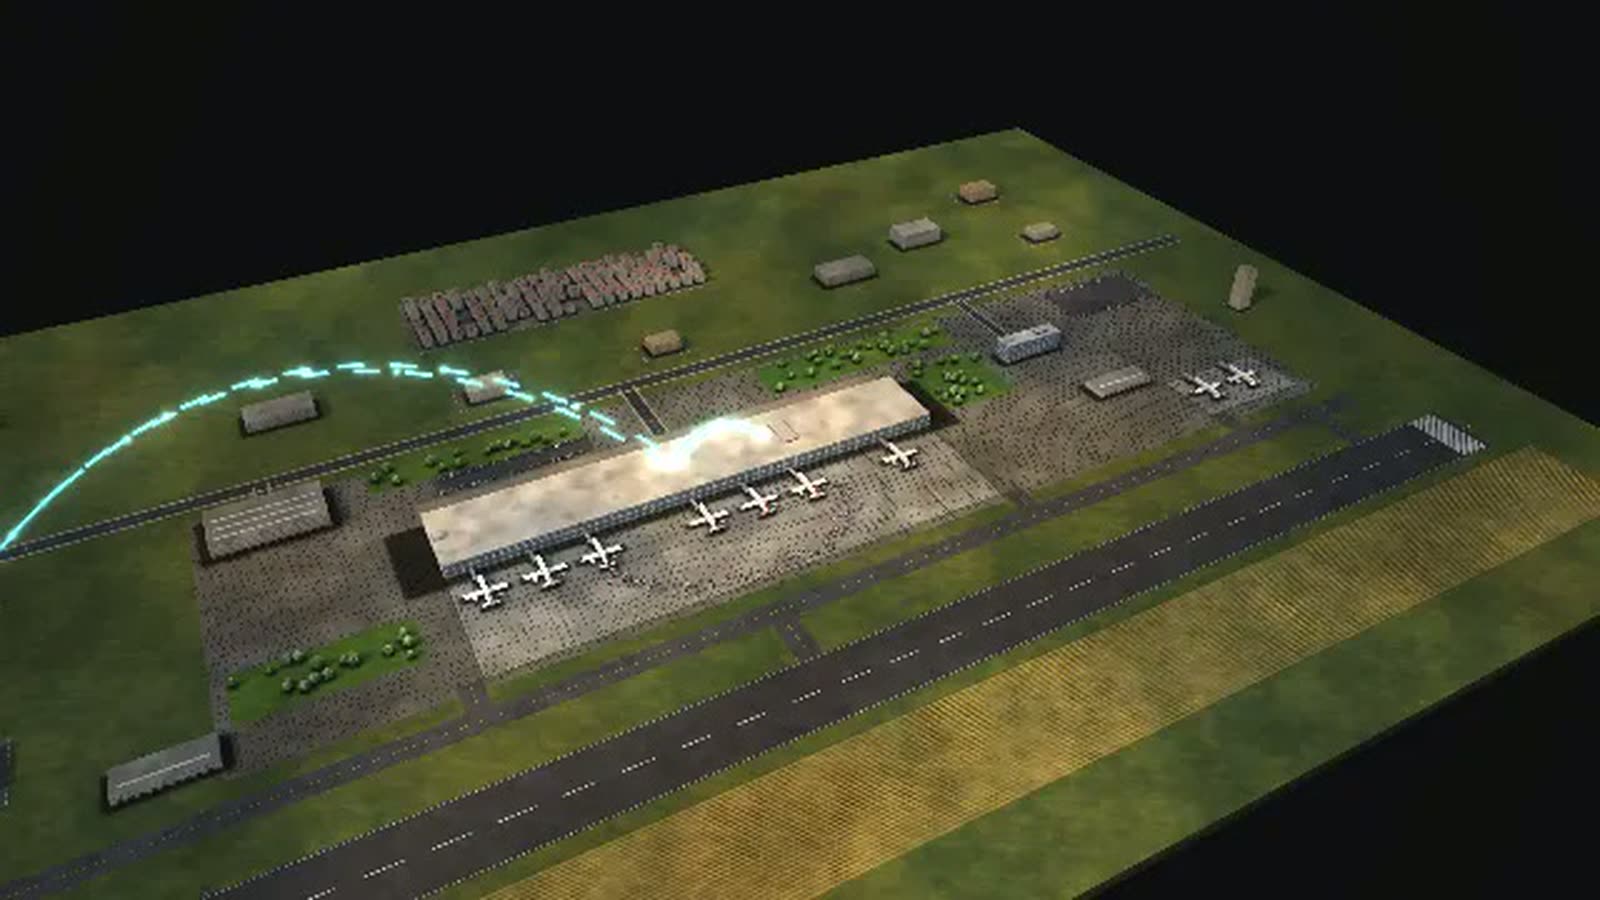
A food retailer as a walkable model: fresh produce from automatic ordering through the night in the distribution centre to the shelf before opening.
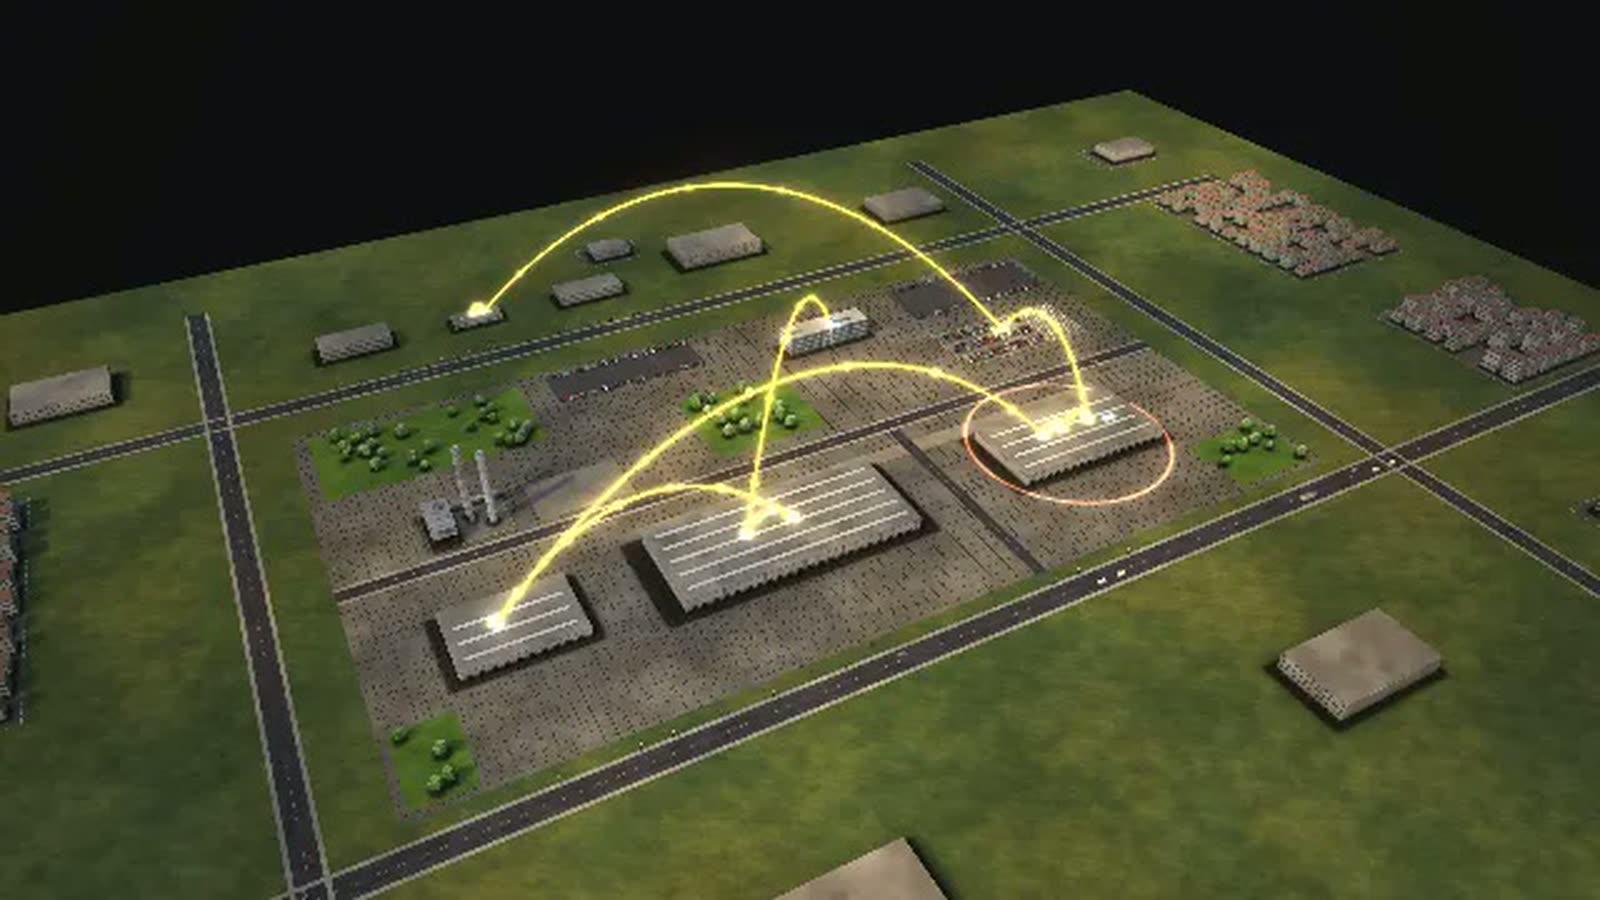
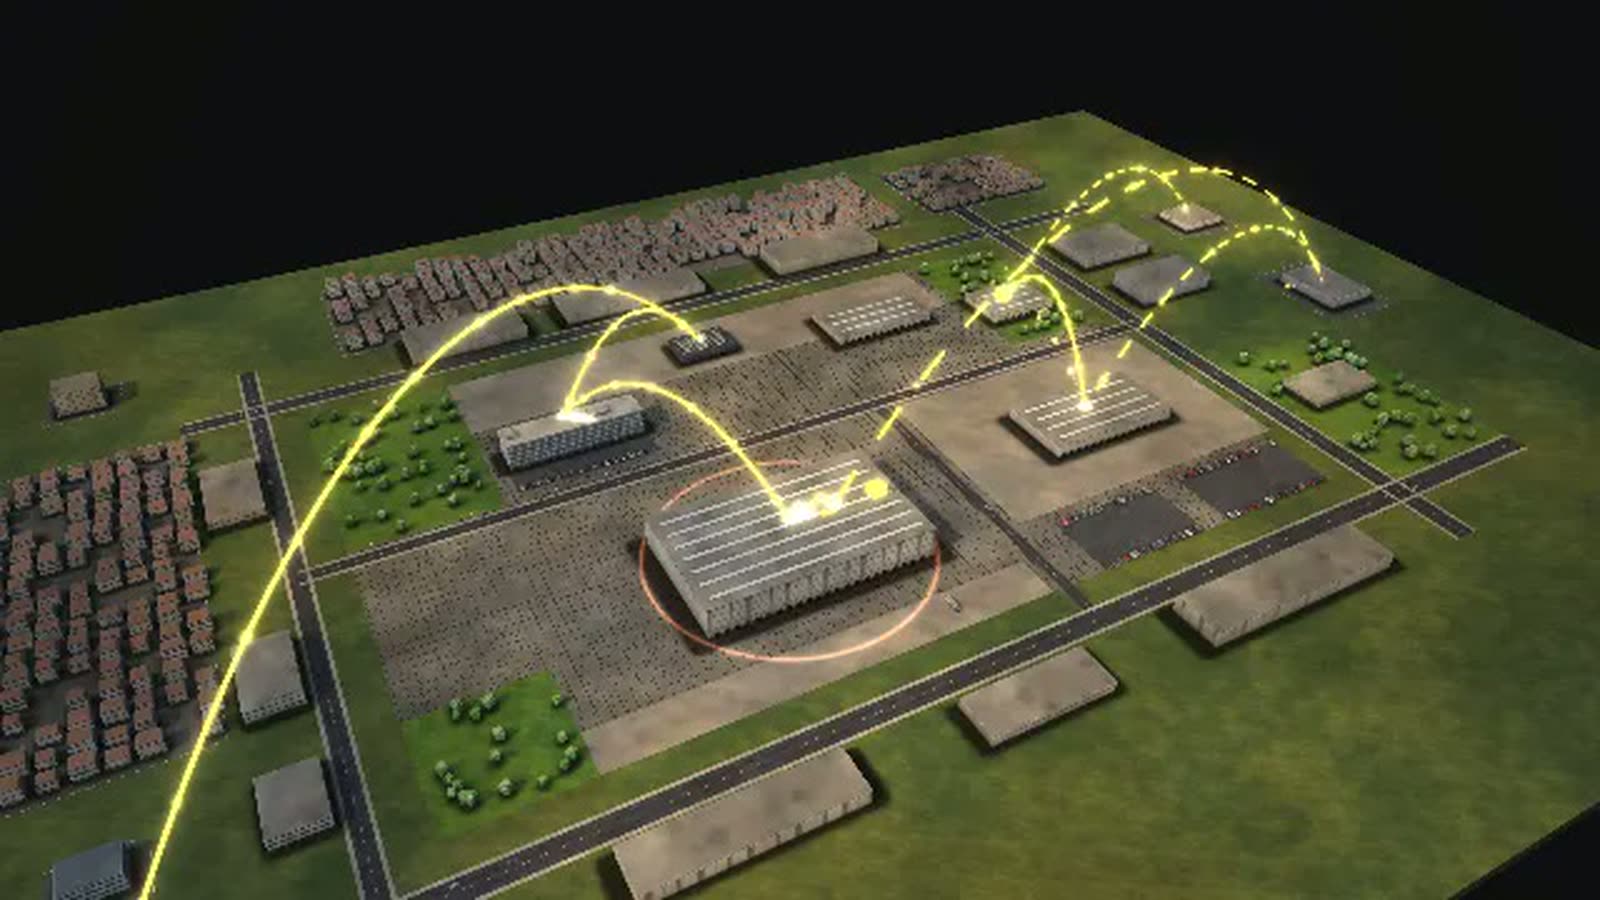
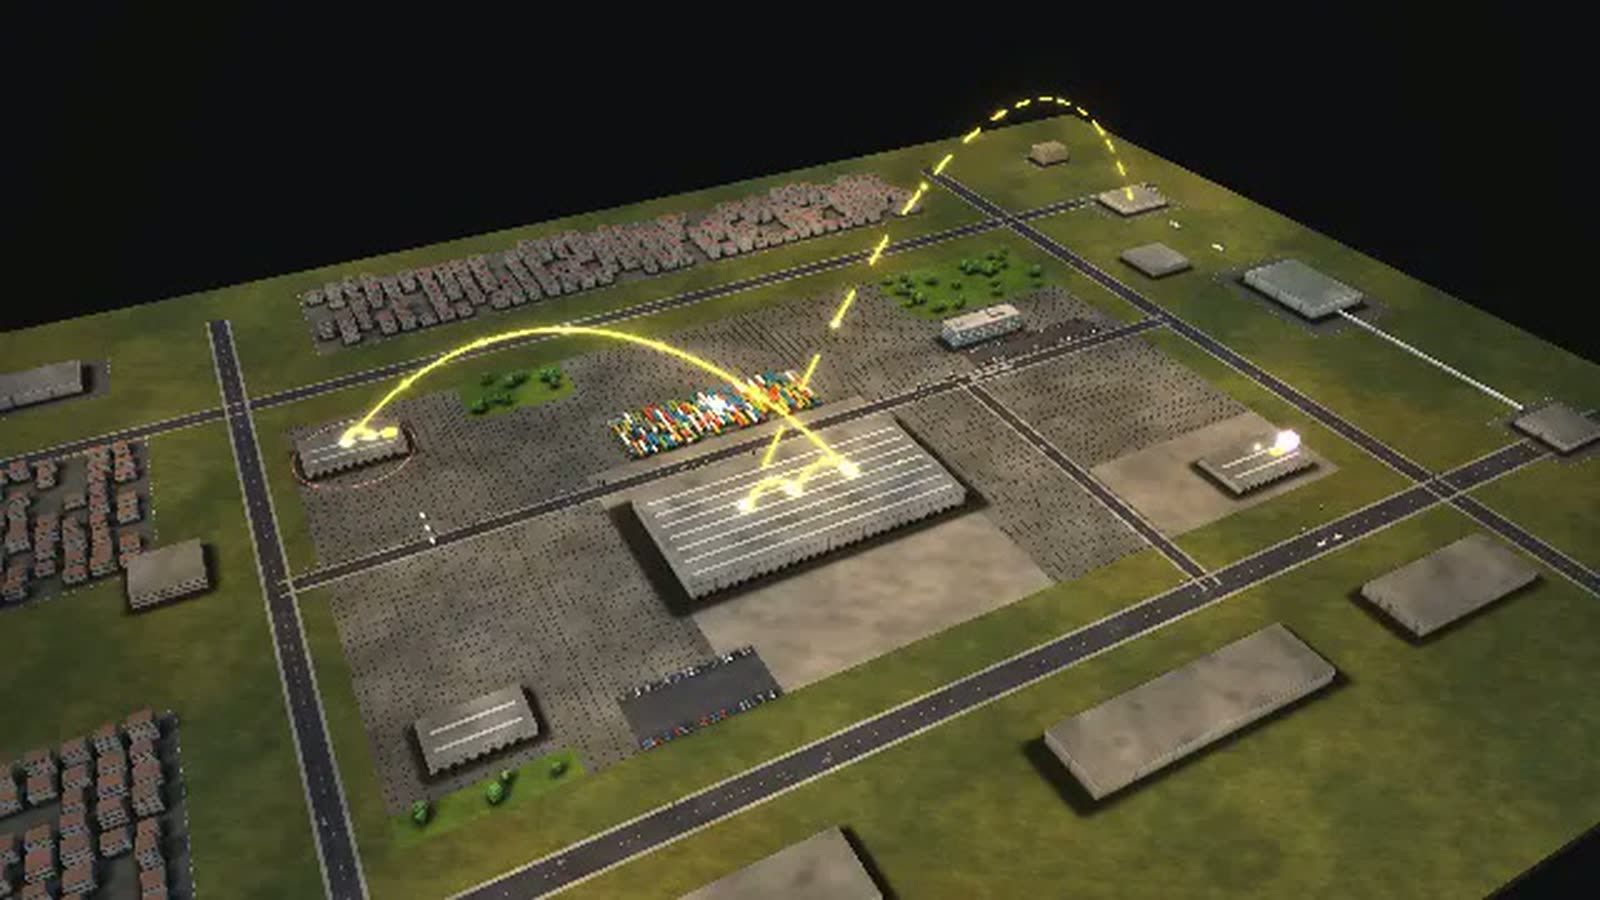
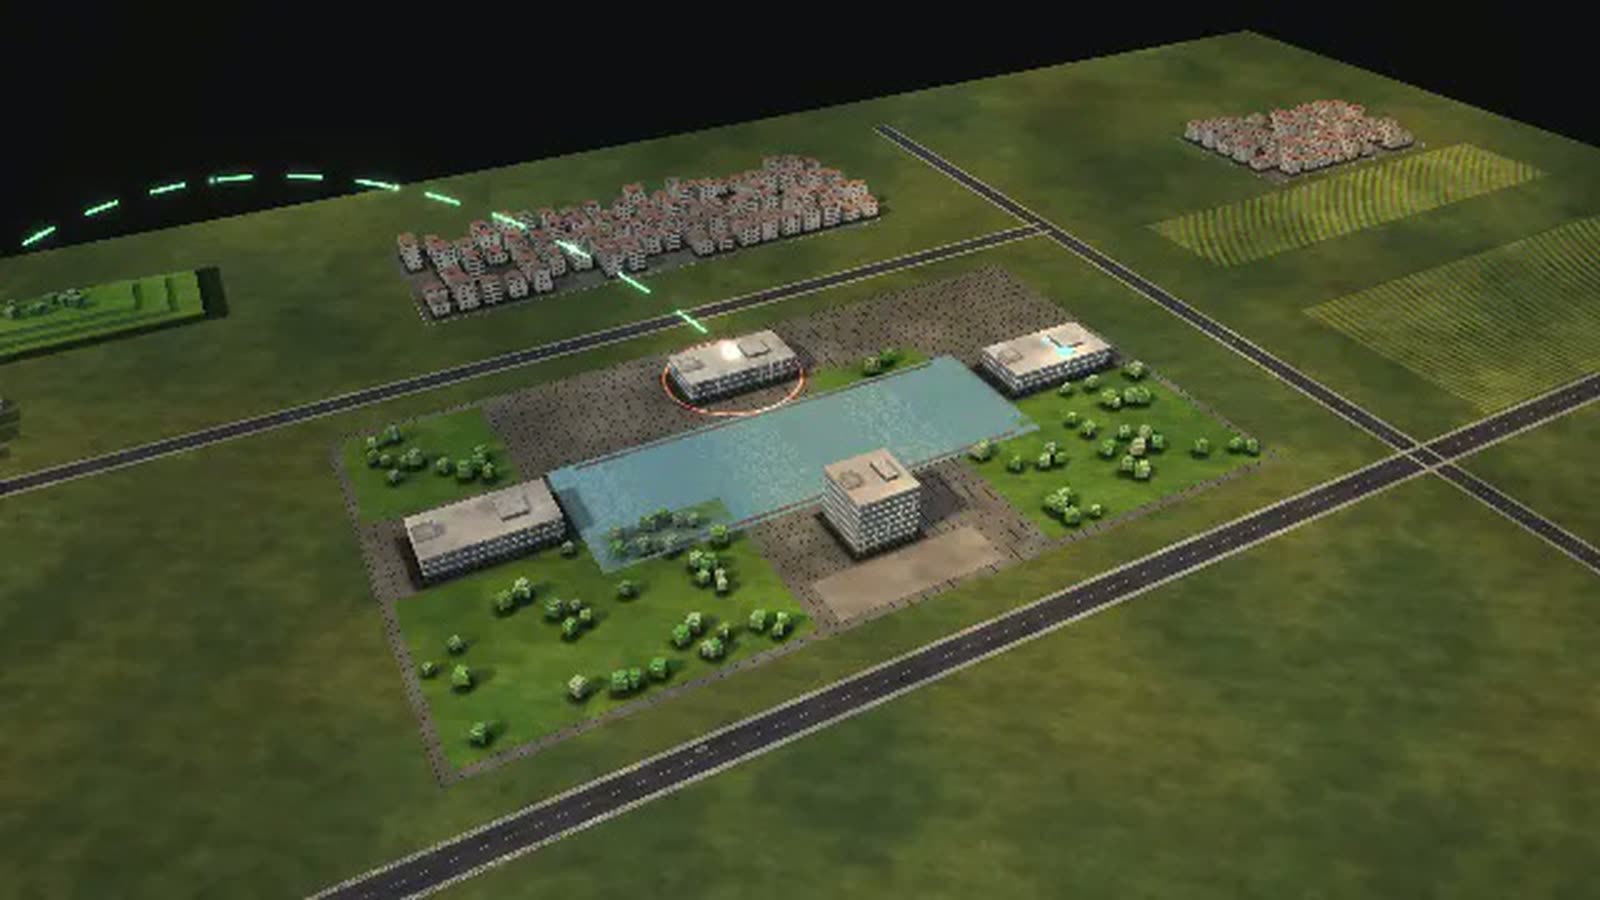
All data are fictional – FELDKORB GRUPPE does not exist. The model can be fitted to your real retail data and then shows what is scattered across systems today: order quantities per store and category, or write-offs per item and day.
Grocery fresh food logistics, step by step in a model. At the fictional FELDKORB GRUPPE, the distribution centre builds the deliveries for the stores every night – fresh, chilled and on time before opening. The main process follows fresh produce from automatic replenishment through goods-in, QA sampling and night picking to the refrigerated truck at 2 am and onto the shelf. What does not sell goes to the food bank or is written off.
The site has headquarters, the distribution centre, returnables and waste, the refrigerated truck fleet and two of the group's own stores. If the refrigeration fails, nothing may be picked for four hours. An AI forecast for fresh produce orders more precisely and reduces write-offs. Alongside, a private label is created and a product is recalled – from the finding to empty shelves.
The shares sold, reduced, donated and written off, and the effect of the forecast, are model assumptions. Documented in the sources: responsibility for safe food, recalls and labelling. This page is for senior management, logistics, buying, quality assurance, stores and sustainability.
Fresh produce reaches the shelf
- 01
Automatic replenishment: In the morning replenishment orders automatically for every store – from the sales forecast.
- 02
Delivery by suppliers: Growers deliver to the distribution centre overnight.
- 03
Goods in: Unload the truck, measure temperature, check the delivery note.
- 04
QA sampling: QA checks appearance, ripeness, temperature.
- 05
Delivery rejected.
- 06
Fresh picking (at night): At night the warehouse assembles the roll cages for every store – in the cold zone.
- 07
Refrigerated truck departure (2 am): At 2 am the refrigerated trucks leave.
- 08
Drive to the store: The truck drives to its stores.
- 09
Delivery to independent merchant: Delivery to an independent merchant.
- 10
Arrived at the merchant.
- 11
Goods receipt at the store: Goods receipt at the store.
- 12
Stocking the shelves: Goods onto the shelf, electronic price tags match.
- 13
Sales: Sales – and before the best-before date a decision: reduce, donate or write off.
- 14
Handover to the food bank: The food bank collects.
- 15
Write-off and disposal: No longer sellable: written off.
- 16
Sold.
- 17
Sold reduced.
- 18
Donated.
- 19
Disposed of.
How a food retailer can use the model
-
Internal communication
The diagram ‘Where value is created’ shows where fresh produce ends up: sold, reduced, donated, written off. One picture for staff meetings and the sustainability report.
Pour quiSenior management, sustainability, communications
-
Onboarding
New colleagues in stores and the distribution centre see the night that comes before their shelf: goods-in, sampling, picking in the cold zone, departure at 2 am.
Pour quiNew staff in stores and logistics
-
Training
‘Refrigeration failure’ shows trainees what is at stake in the cold chain: for four hours nothing may be picked, and the 2 am departure comes under pressure.
Pour quiWarehouse and retail trainees, shift leads
-
Explaining to customers
Show shoppers, independent merchants and authorities how a recall works: finding, till lock, blocking stock, clearing shelves, report to the authority.
Pour quiQuality assurance, communications, independent merchants
-
Strategic overview
AI forecast, more night-shift pickers or more refrigerated trucks? ‘What each control does’ ranks the levers against waste and late deliveries.
Pour quiSenior management, buying, head of logistics
What is shown – why – for whom
| Ce qui est montré | Pourquoi | Pour qui |
|---|---|---|
| Diagram ‘Year, week, day’: the night in the distribution centre, departure at 2 am | PourquoiExplains the rhythm of fresh produce. | Pour quiHead of logistics, stores |
| Diagram ‘What each control does’: AI forecast, night shift, refrigerated trucks | PourquoiRanks levers against write-offs and delays. | Pour quiSenior management, buying |
| Diagram ‘Where value is created’: sold, reduced, donated, written off | PourquoiShows where fresh produce ends up. | Pour quiSustainability, communications |
| Diagram ‘How a case flows’: a recall | PourquoiShows the path off the shelf. | Pour quiQuality assurance, authorities |
| Diagram ‘The path across the site’: from the distribution centre to the stores | PourquoiShows routes and return trips with returnables. | Pour quiFleet, stores |
| Disruption ‘Refrigeration failure’ | PourquoiShows the consequences for the cold chain. | Pour quiEngineering, quality |
| Resources view in night picking | PourquoiShows whether the 2 am departure holds. | Pour quiShift leads |
Departments in the model
-
Executive board
Leads buying, logistics and stores of the group.
-
Buying
Negotiates with manufacturers and growers; thin margins, large volumes.
-
Private labels
Develops own products and has them made by producers.
-
Category management
Decides what goes on the shelf.
-
Replenishment and forecasting
Orders automatically from the sales forecast – every morning for every store.
-
Quality assurance
Checks goods, cold chain and labelling; decides on recalls.
-
Supply chain due diligence
Analyses human rights and environmental risks at suppliers (supply chain act).
-
IT and merchandise system
Merchandise system, tills, forecasting – a recall locks all tills within minutes.
-
Goods in
Receives suppliers' trucks at night, measures temperatures.
-
Warehouse and picking
Assembles the roll cages for every store at night – fresh produce last.
-
Fleet
Three-compartment refrigerated trucks reach the stores before opening.
-
Group stores
Receive goods, stock shelves, advise – and decide before the best-before date.
-
Returnables and waste
Deposit, crates, recyclables and write-offs.
All processes in the model
Fresh produce reaches the shelf
- 01Automatic replenishment: In the morning replenishment orders automatically for every store – from the sales forecast.
- 02Delivery by suppliers: Growers deliver to the distribution centre overnight.
- 03Goods in: Unload the truck, measure temperature, check the delivery note.
- 04QA sampling: QA checks appearance, ripeness, temperature.
- 05Delivery rejected.
- 06Fresh picking (at night): At night the warehouse assembles the roll cages for every store – in the cold zone.
- 07Refrigerated truck departure (2 am): At 2 am the refrigerated trucks leave.
- 08Drive to the store: The truck drives to its stores.
- 09Delivery to independent merchant: Delivery to an independent merchant.
- 10Arrived at the merchant.
- 11Goods receipt at the store: Goods receipt at the store.
- 12Stocking the shelves: Goods onto the shelf, electronic price tags match.
- 13Sales: Sales – and before the best-before date a decision: reduce, donate or write off.
- 14Handover to the food bank: The food bank collects.
- 15Write-off and disposal: No longer sellable: written off.
- 16Sold.
- 17Sold reduced.
- 18Donated.
- 19Disposed of.
A private label is created
- 01Assess assortment gap: Category management sees a gap – say an affordable oat drink.
- 02Tender and supply chain review run in parallel.
- 03Tender with producers: Producers submit offers and samples.
- 04Supply chain risk analysis: Human rights and environmental risks of suppliers are assessed.
- 05Offers and risk assessment are in.
- 06Tasting and audit: Tasting and audit at the producer.
- 07Producer reworks: The producer changes recipe or packaging.
- 08Check labelling (FIC): Allergens, nutrition, origin: labelling is checked.
- 09Listing and set-up: The item is listed and set up in merchandise system and warehouse.
- 10First delivery: The first delivery goes to the stores.
- 11On the shelf.
A product is recalled
- 01Finding from a manufacturer: A manufacturer reports a finding – say bacteria in a batch.
- 02Assessment by QA: QA assesses the risk.
- 03All clear.
- 04Till lock: The merchandise system locks the item at all tills – within minutes.
- 05Warehouse locks, stores clear, authority is informed – at the same time.
- 06Lock warehouse stock: Stock locked in the distribution centre.
- 07Stores clear the shelves: Stores clear the shelves.
- 08Report to the authority: The food authority is informed and warns publicly.
- 09Everything locked and cleared.
- 10Return and destruction: Return and destroy goods, credit from the manufacturer.
- 11Recall complete.
What you can change
Controls
- Order volume: Before holidays stores order much more.
- Night-shift pickers: How many roll cages are built at night at once.
- Refrigerated trucks: How much can go to the stores at 2 am.
- AI forecast for fresh: More accurate orders: fewer write-offs (model assumption).
- QA sampling: More samples find more defects but cost time at night.
Disruptions
- Refrigeration failure: Four hours without cooling in the fresh zone: nothing may be picked.
- Supply stop: For two days deliveries arrive late – e.g. due to a price dispute or bad weather at the growers.
- Snow chaos: A day of snow: refrigerated trucks take more than twice as long.
What the model gives a food retailer
-
01
The night before the shelf
What happens between the morning order and the shelf runs in the model as a path across the site, with roll cages and refrigerated trucks.
-
02
Less waste, made visible
The ‘AI forecast for fresh’ control shows how more accurate orders cut write-offs – an assumption today, a measured value once your write-off data are in.
-
03
Easter and Christmas in advance
Queues form in the simulation as they do in reality. Raise the order volume before the holidays and see whether night picking holds the 2 am departure.
-
04
Own stores and independents
The model supplies the group's own stores as well as independent merchants. Both see the same path of the goods.
-
05
Designed by an artist
Walkable in the browser and on large projections, shaped by an artist and developer rather than built from a template kit.
Basis and limits
Fictional retail group · model based on researched industry structures · no forecast for real companies
1 case = 10 roll cages of fresh produce · 1 figure ≈ 20 employees
All volumes, durations, rates and capacities are model assumptions, not values of a real retail group.
Shares sold, reduced, donated and written off as well as the effect of AI forecasting: model assumptions.
Documented: operator responsibility for safe food and recalls, labelling duties, supply chain due diligence.
Public sources the model is based on:
- VO (EG) 178/2002 (Lebensmittelsicherheit, Rückverfolgbarkeit)
- Lieferkettensorgfaltspflichtengesetz (BAFA)
- Lebensmittelinformationsverordnung VO (EU) 1169/2011
- lebensmittelwarnung.de
Your grocery business as a model
Would you like to see your distribution centre, cold chain or write-offs like this? Drop us a line or give us a call, and together we'll clarify which merchandise and warehouse data the model needs. The password for FELDKORB is yours on request.
cube4tec.de/spiele/minimal-organization/
Poser une question à ce sujet
Minimal Organization: Lebensmittelhandel
Similar business models
-
Industrial bakery
An industrial bakery with 120 shops as a walkable model: how rolls get from the night plan to the counter by 6 am and where oven, proofer or routes hold them up.
-
Online retail
An order from click to doorstep as a walkable model: payment check, warehouse, packing, trucks, sortation and delivery in a running simulation.
-
Parcel service
A parcel service as a walkable model: the overnight run through the hub, sorter and shuttles, then the morning route to the doorstep.
-
Freight forwarder
A freight forwarder as a walkable model: groupage, ocean and air freight, cross-docking and customs in a running simulation.
-
Pharmaceutical company
A pharmaceutical plant as a walkable model: follow a batch from the cleanroom to certification by the qualified person and see where the four weeks go.
-
Container shipping line
A container line with its own terminal as a walkable model: gate, yard, stowage plan and quay cranes, timed by a fixed schedule.
-
Airport
An airport as a walkable model: passengers from check-in through security to the gate, plus baggage, turnaround and winter operations.
-
Search engine
A search and advertising group as a walkable model: auctions in milliseconds, experiments over weeks, and a new ad campaign that waits for people.
All data are fictional – FELDKORB GRUPPE does not exist. The model can be fitted to your real retail data and then shows what is scattered across systems today: order quantities per store and category, or write-offs per item and day.