
シミュレーション · Minimal Organization · Energy and water
Water and wastewater utility
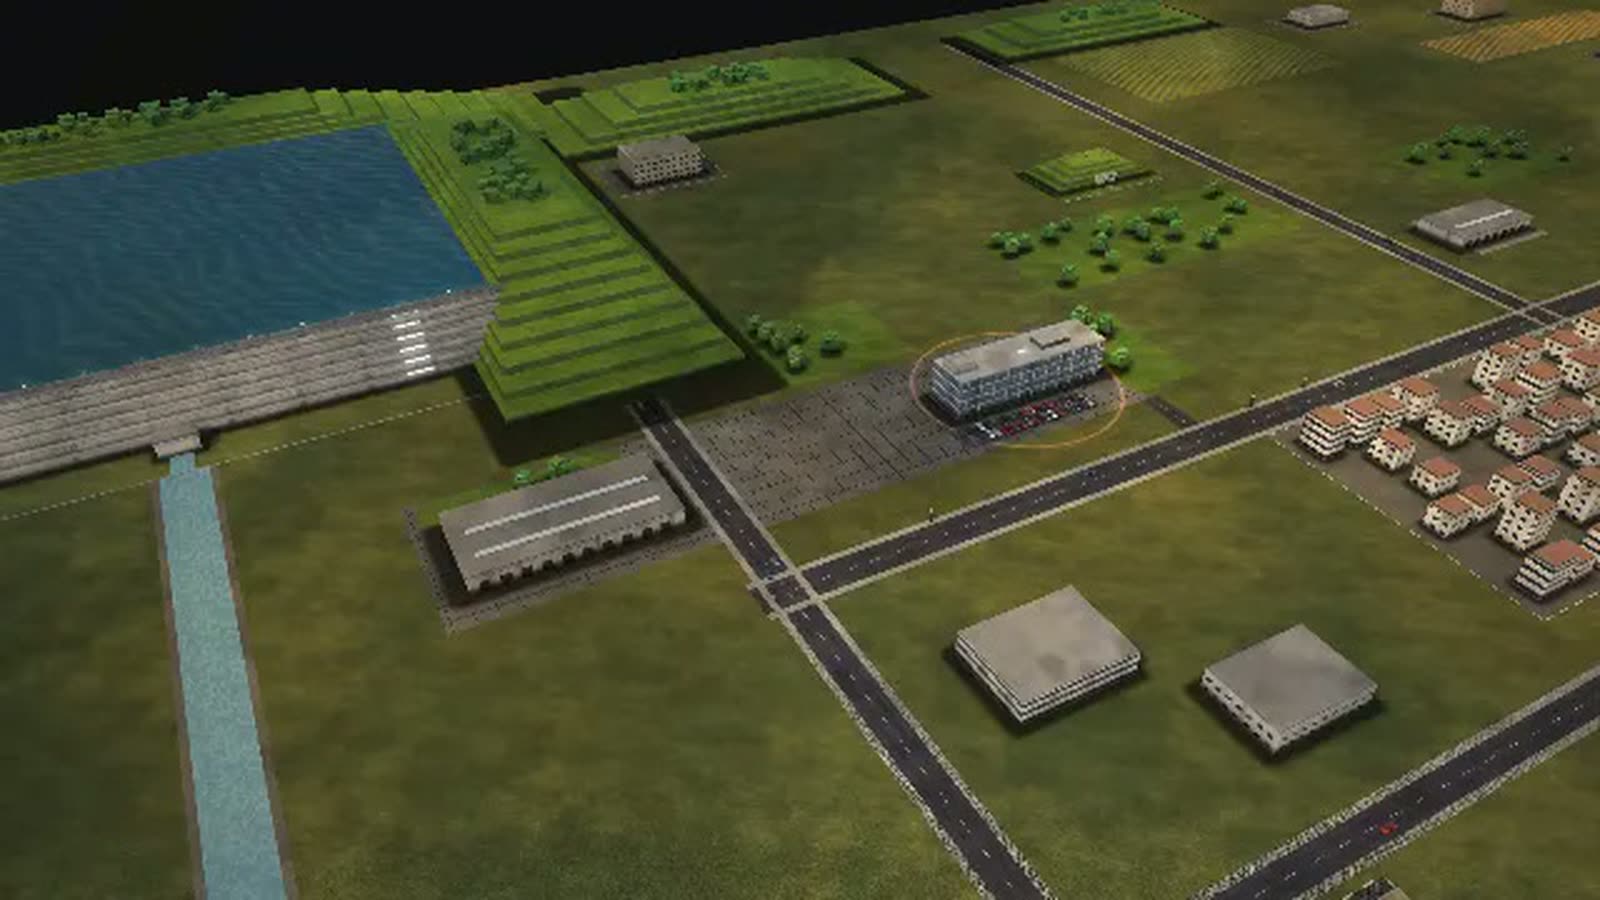
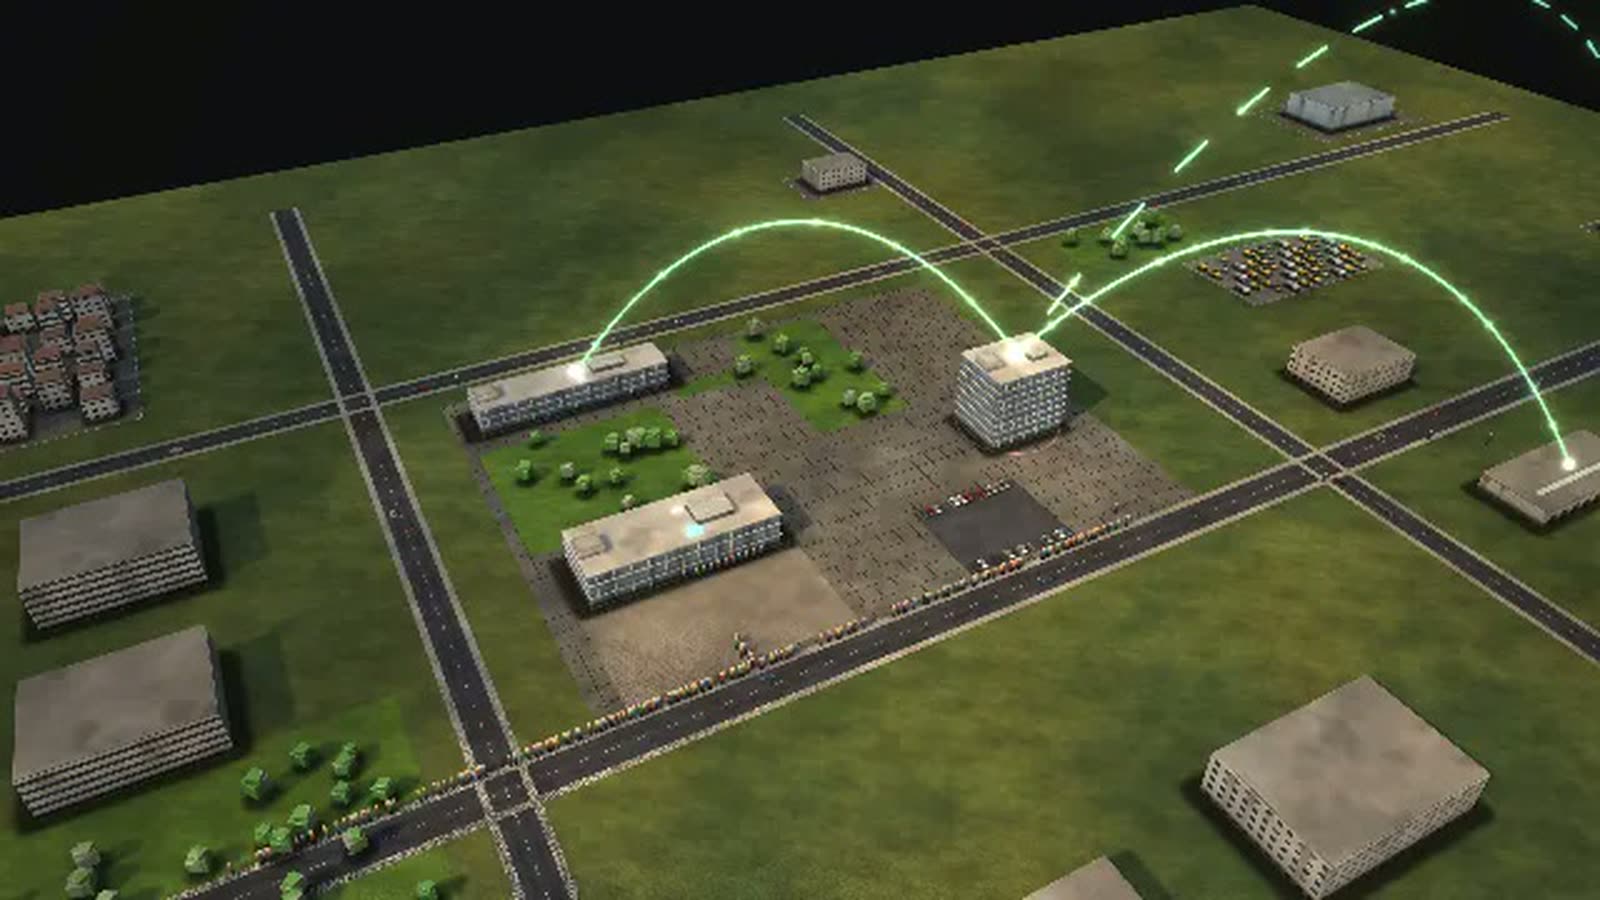
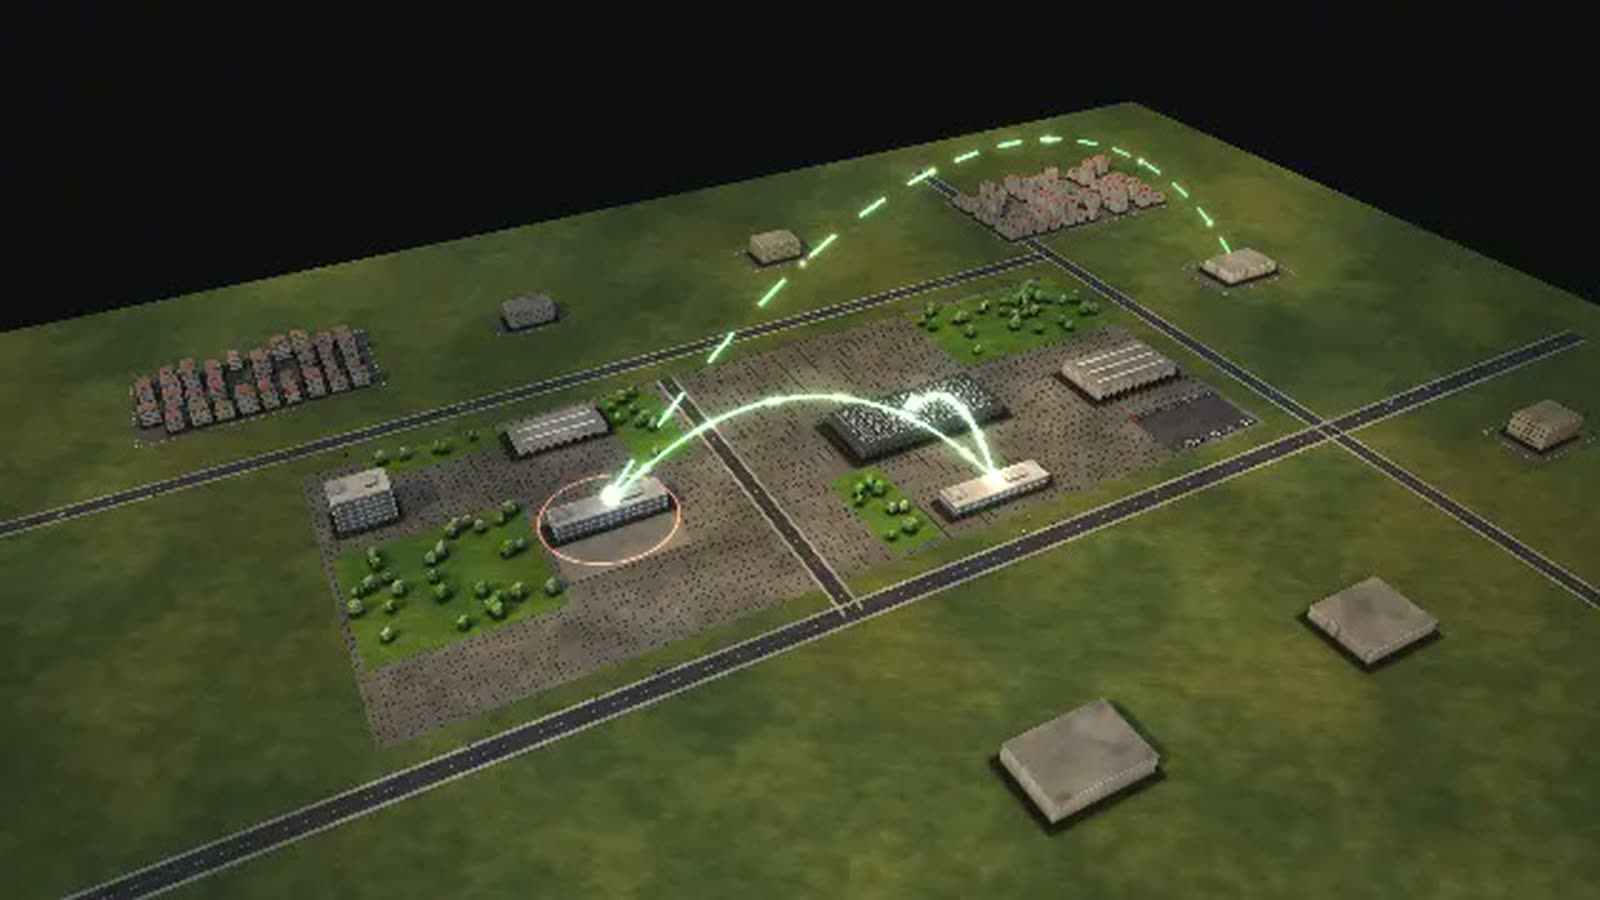
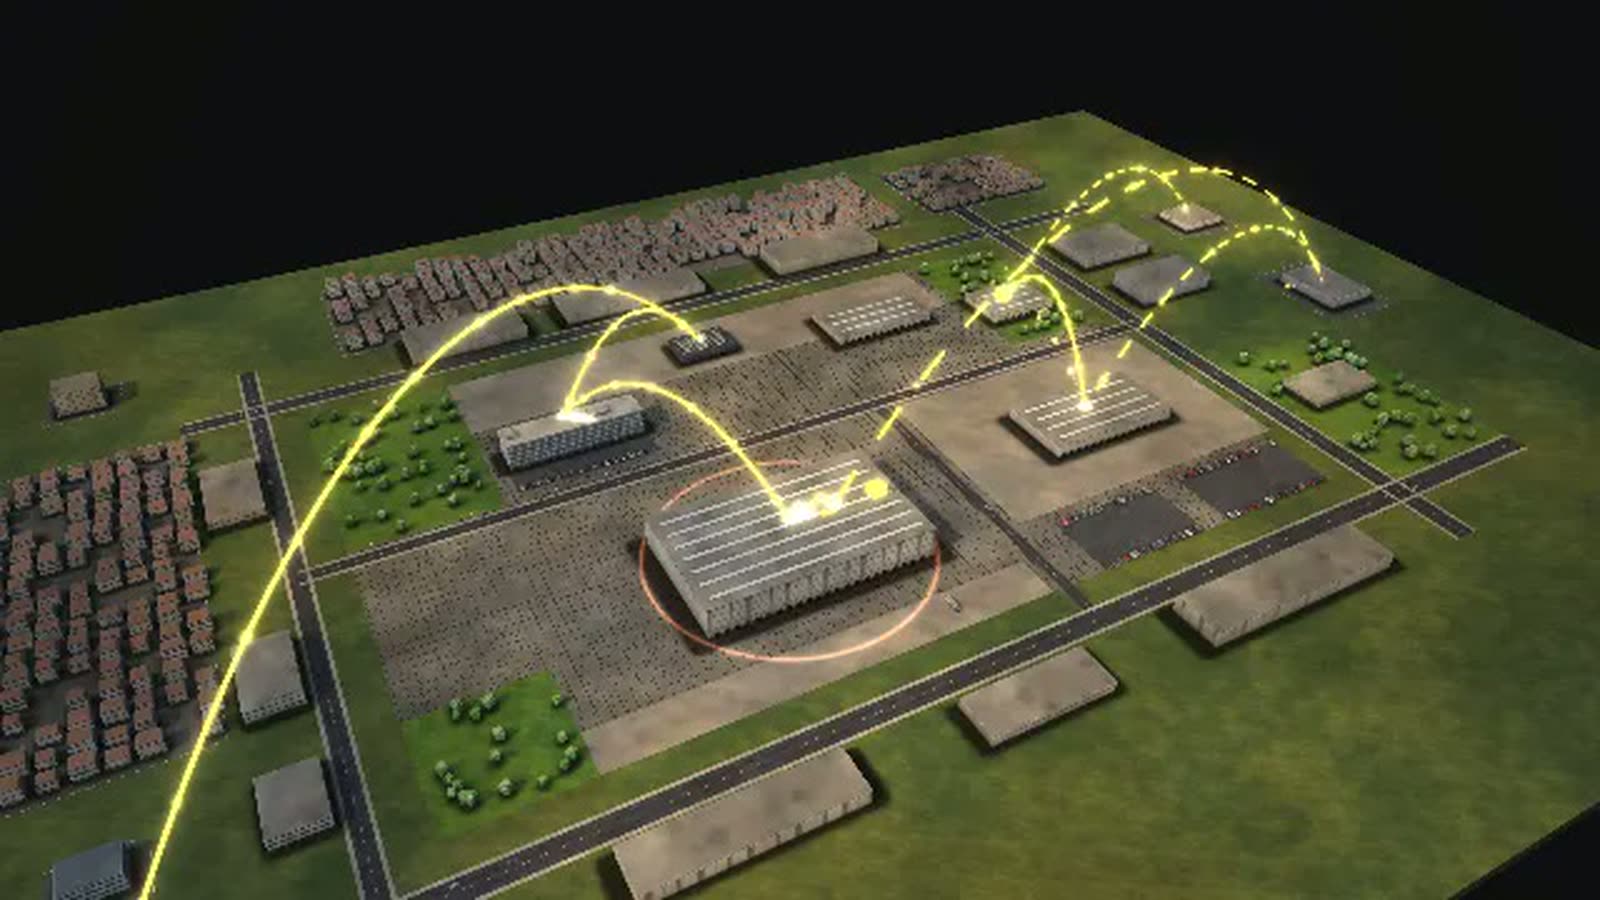
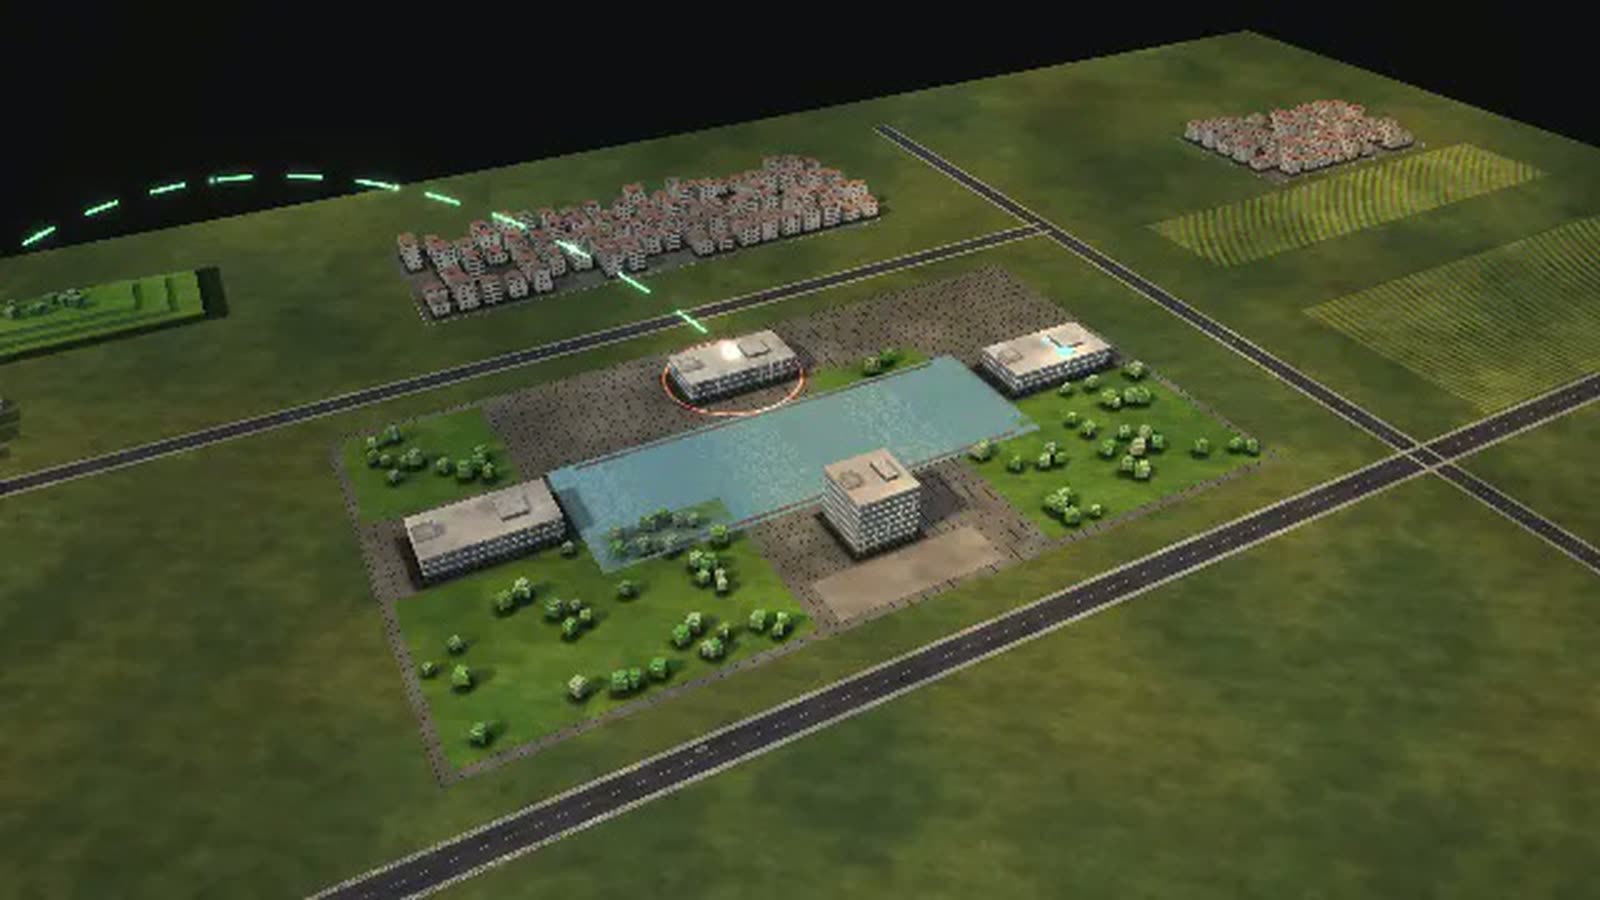
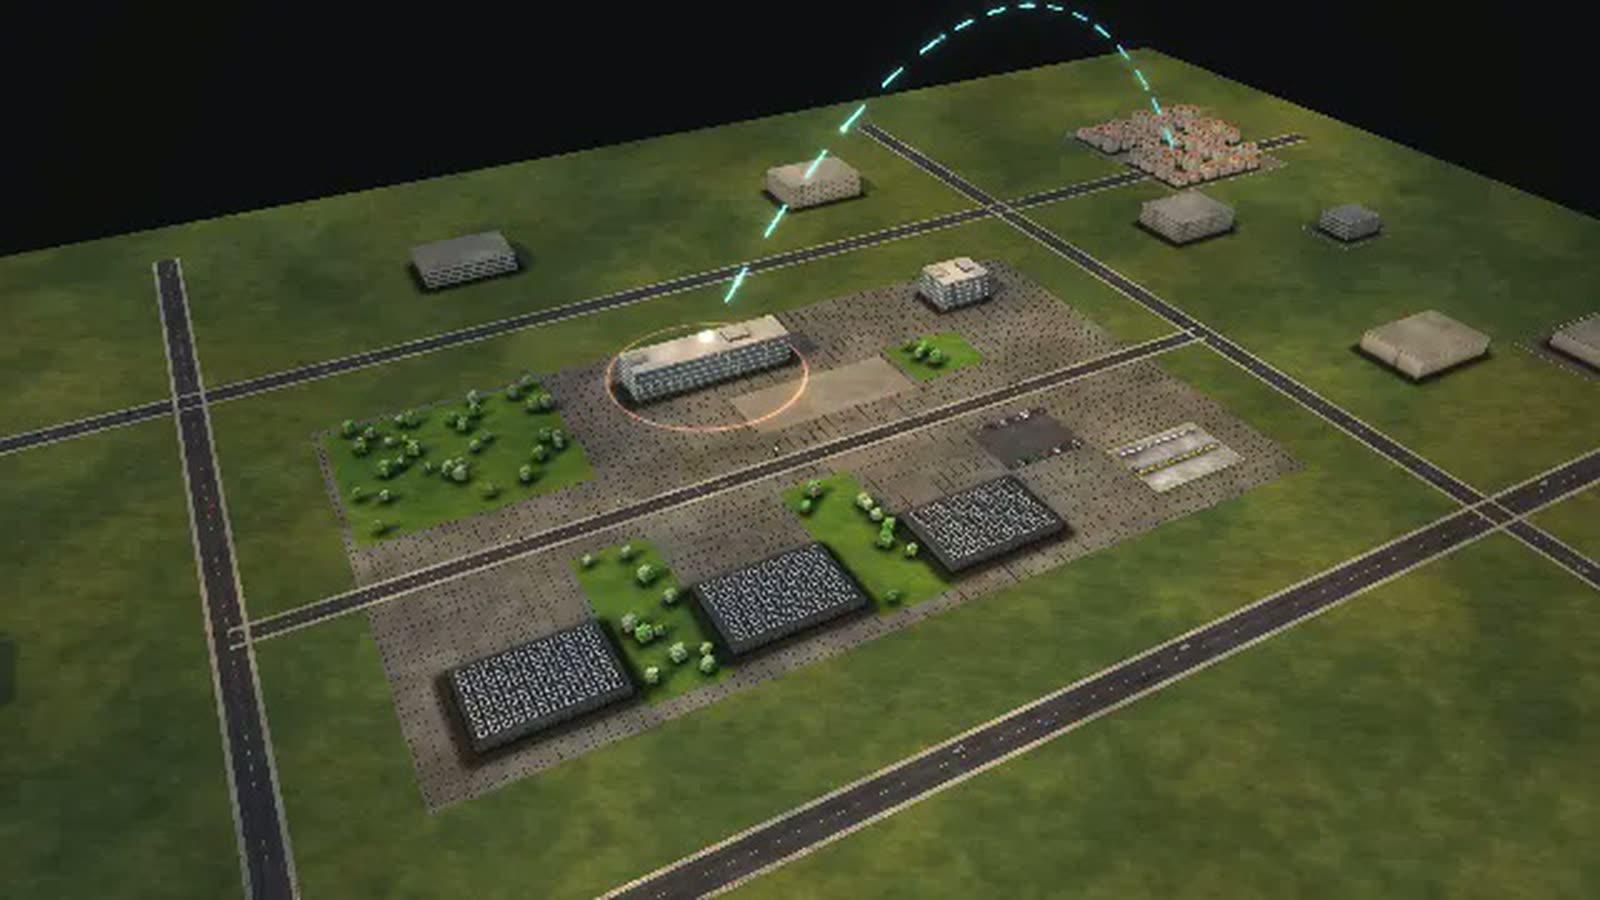
A water utility as a walkable model: from the reservoir to the treatment plant, with the path of a drinking water sample through the lab to the public health office.
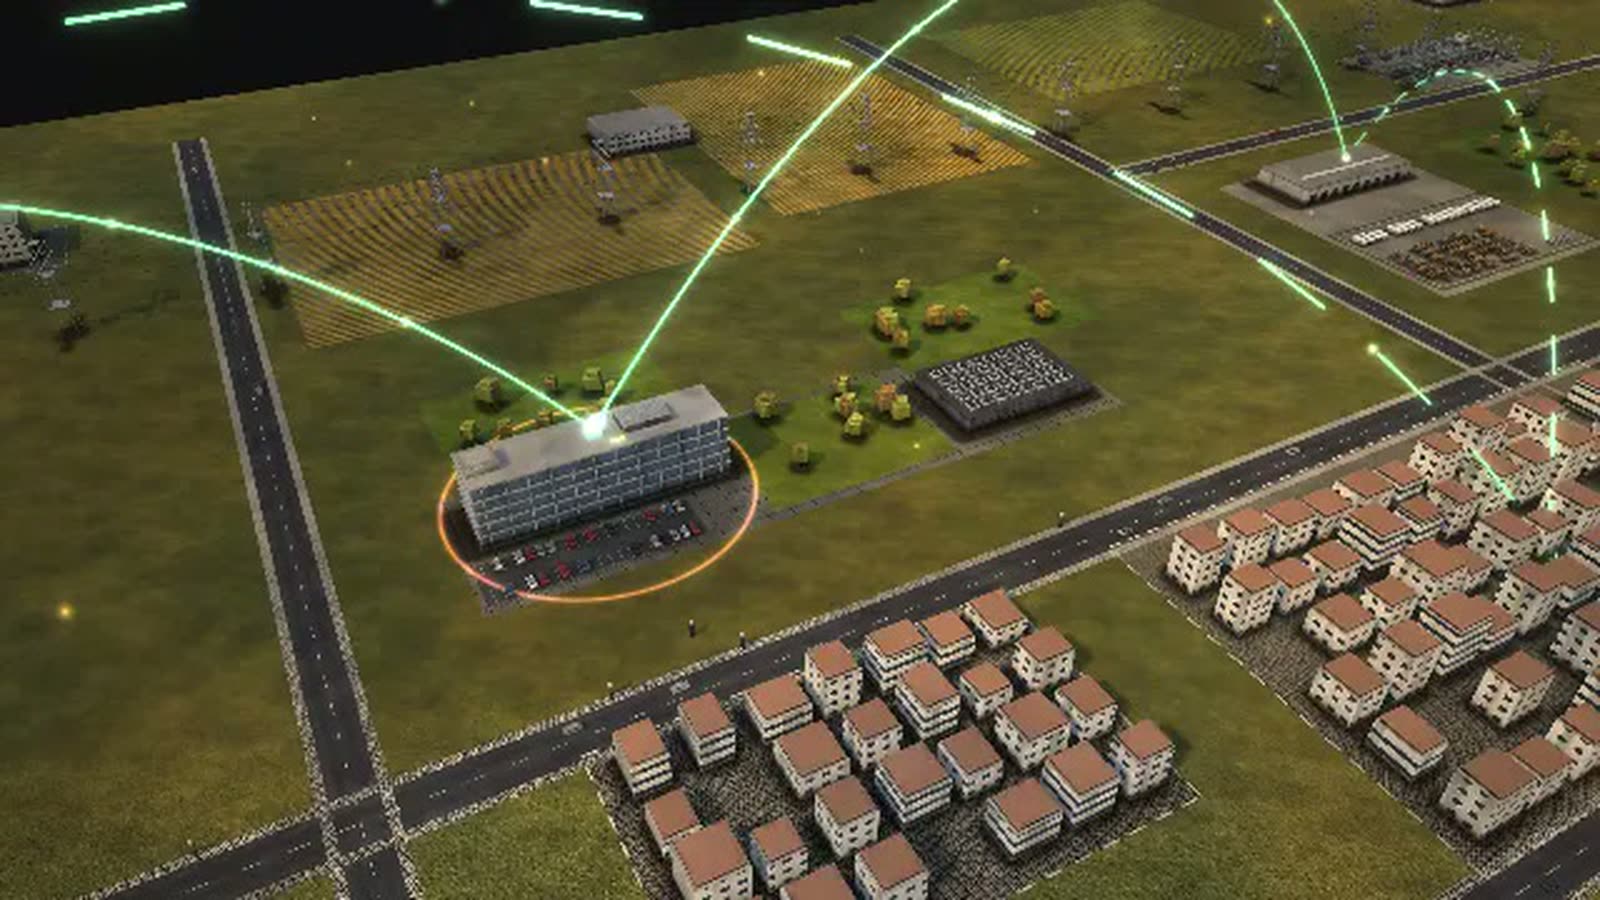
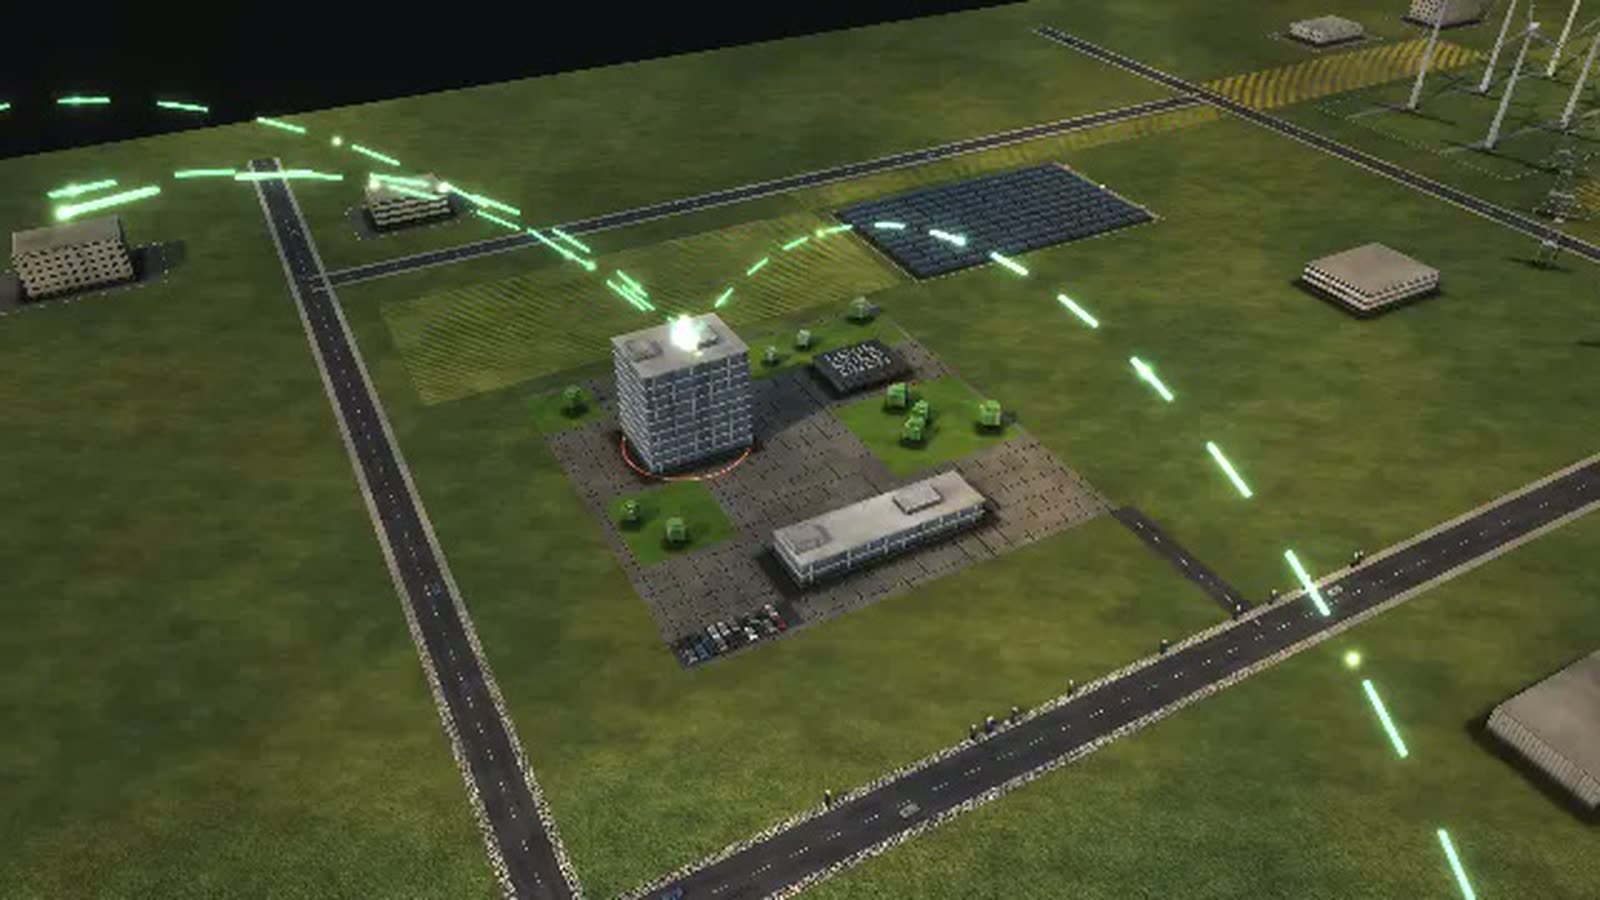
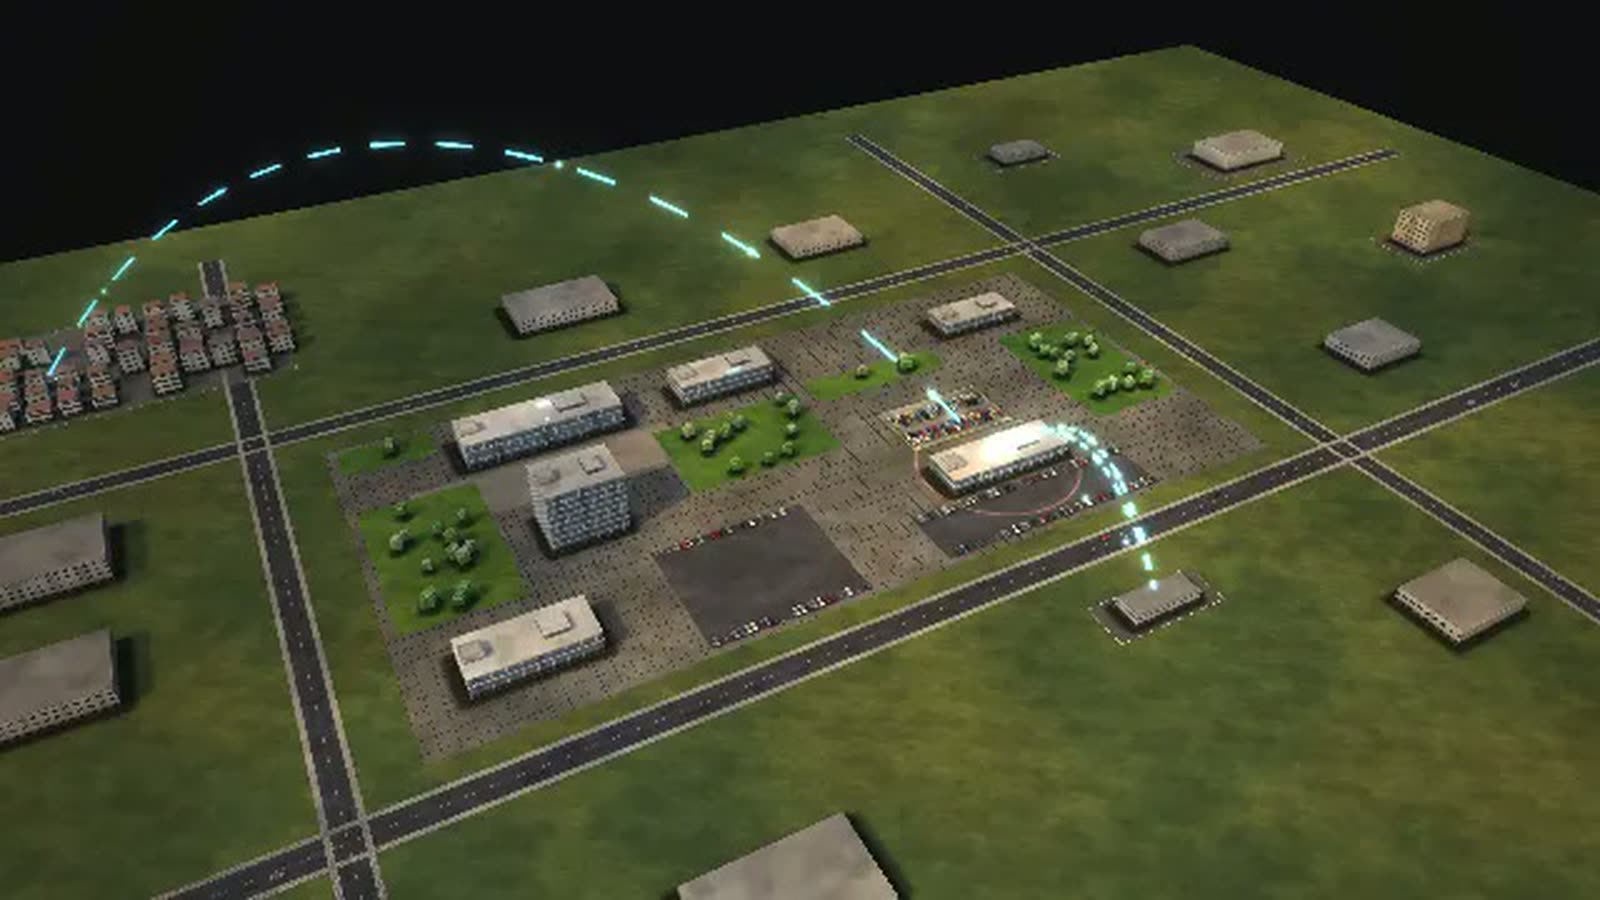
WASSERVERBAND MERTENTAL is invented and every value is an assumption. With your data the model can show what control room, lab and asset records keep apart today – such as real readings per zone and service reservoir, or bursts by pipe age and soil type.
How does the drinking water testing process work, from sampling to result? The fictional WASSERVERBAND MERTENTAL, a water and wastewater association, shows it. The reservoir above, the treatment plant below – and in between a town that expects clean water around the clock.
The path of a sample: a sampler draws water at a fixed point in the network, the lab sets up the sample, nothing can speed up the 18 to 48 hours in the incubator, then the lab reads the plates. If there is a positive finding, it reports at once to the public health office, which decides on measures such as a boil-water notice; the network team then flushes the pipes and the public is informed. Target in the model: result within 48 hours.
Alongside run heavy rain, self-monitoring at the treatment plant and a burst main under the street. One association for both drinking water and wastewater is a model assumption. The model shows processes; it says nothing about water quality or legal duties. The page is meant for the board, member councils, the lab, the control room, network operations and public relations.
A drinking water sample is analysed
- 01
Sampling at the tap: A sampler draws water at a fixed point in the network.
- 02
Microbiology set-up: The lab sets up the sample for coliform bacteria and E. coli.
- 03
Incubator (18 to 48 hours): The sample grows in the incubator.
- 04
Reading and result: The lab reads the plates.
- 05
Clear.
- 06
Report to the public health office: Positive: the lab reports immediately to the public health office.
- 07
Public health office decides: The public health office decides, for example on a boil-water notice.
- 08
Flushing the network and informing the public run in parallel.
- 09
Network flushing and root cause search: The network team flushes and looks for the cause: burst, reservoir, backflow.
- 10
Informing the public: The public is informed.
- 11
Flushed and informed.
- 12
Control samples over several days: Control samples over several days.
- 13
Public health office lifts the measure: The public health office lifts the boil-water notice.
- 14
Lifted.
How a water utility can use the model
-
Internal communication
Eleven buildings, from reservoir, waterworks and service reservoir to pumping station and treatment plant, show the whole water cycle. Drinking water and wastewater teams see where they meet: control room, lab, control systems.
対象Board, members' assembly, all divisions
-
Onboarding
New staff follow a sample and see who takes over after a positive finding: lab, health office, network team and customer service. An eight-step tour guides them through the controls.
対象New staff in the lab, network, sewer operations and control room
-
Training
Apprentices trigger a heat summer or severe weather and see bursts and heavy rain strain control room, sewers and treatment plant at once. The ‘Pipe renewal’ control shows that investment pays off late.
対象Water supply and wastewater apprentices
-
Explaining to residents and schools
‘Who sits where – and reports to whom’ follows the water from reservoir to treatment plant. School classes and residents see what lies behind the tap and the water bill.
対象Public relations, schools, member municipalities
-
Strategic overview
Renewal, metered zones and sewer flow control side by side, plus an attack on the control systems as a disruption: the model ranks investments by effect and shows what operations depend on.
対象Board, municipalities, IT security
What is shown – why – for whom
| 表示内容 | なぜ | 対象 |
|---|---|---|
| Diagram ‘Who sits where – and reports to whom’: from reservoir to treatment plant | なぜshows a town's water cycle | 対象Members' assembly, schools, residents |
| Diagram ‘The path across the site’: sample, burst main, sewer | なぜshows the routes through the network | 対象Network operations, control room |
| Diagram ‘Where the time goes’: incubator, 18 to 48 hours | なぜshows what cannot be sped up | 対象Lab, public health office |
| Diagram ‘What the work depends on’: process control system and lab system | なぜshows the impact of an attack on the control systems | 対象IT security, management |
| Diagram ‘What each control does’: renewal, metered zones, sewer flow control | なぜranks investments by effect | 対象Board, municipalities |
| Process ‘Heavy rain approaches’ | なぜshows sewers and storage tanks working together | 対象Civil protection, the town |
| Resources view in the lab with an intensified sampling plan | なぜshows the capacity of the lab | 対象Lab management |
Departments in the model
-
Board and assembly
Public service: cost-covering, not for profit.
-
Planning and construction
Renews pipes, sewers and basins.
-
Dam and waterworks
Abstracts raw water and treats it into drinking water.
-
Pipe network and service connections
Keeps the network tight, flushes, repairs bursts.
-
Central control room
Controls pumps, basins and reservoirs around the clock.
-
Sewer operations and pumping stations
Flushes sewers, inspects them by camera, runs pumping stations.
-
Treatment plant and sludge
Treats the wastewater and recovers gas from sludge.
-
Laboratory (accredited)
Analyses drinking water and wastewater to plan.
-
Charges and customer service
Bills charges and informs the public.
-
Control systems and IT security
Critical infrastructure: control systems separated and secured.
All processes in the model
A drinking water sample is analysed
- 01Sampling at the tap: A sampler draws water at a fixed point in the network.
- 02Microbiology set-up: The lab sets up the sample for coliform bacteria and E. coli.
- 03Incubator (18 to 48 hours): The sample grows in the incubator.
- 04Reading and result: The lab reads the plates.
- 05Clear.
- 06Report to the public health office: Positive: the lab reports immediately to the public health office.
- 07Public health office decides: The public health office decides, for example on a boil-water notice.
- 08Flushing the network and informing the public run in parallel.
- 09Network flushing and root cause search: The network team flushes and looks for the cause: burst, reservoir, backflow.
- 10Informing the public: The public is informed.
- 11Flushed and informed.
- 12Control samples over several days: Control samples over several days.
- 13Public health office lifts the measure: The public health office lifts the boil-water notice.
- 14Lifted.
Heavy rain approaches
- 01Severe weather warning: The weather service warns of heavy rain.
- 02Control room raises readiness: The control room calls in the standby.
- 03Empty storm tanks in advance: Storm tanks are emptied in advance to make room.
- 04Pumping stations and plant work at the limit at the same time.
- 05Pumping stations at full load: All pumps run at full load.
- 06Treatment plant in wet-weather mode: The plant switches to wet-weather mode.
- 07The rain eases.
- 08Situation: does the sewer hold?: The control room checks: were there floodings?
- 09Fire brigade at floodings: The fire brigade pumps out cellars.
- 10Clean sewers, record damage: Sewer operations flush the sewers and record damage.
- 11Report to the water authority: Anomalies go to the water authority.
- 12Weathered.
The plant checks its outflow
- 01Daily composite sample at the outflow: A 24-hour composite sample is taken at the outflow.
- 02Analysis: COD, ammonium, nitrogen, phosphorus: The plant lab measures COD, ammonium, nitrogen and phosphorus.
- 03Compliant.
- 04Adjust the process: The plant adjusts: more air, more precipitant.
- 05Inform the water authority: The water authority is informed.
- 06Resolved.
A pipe bursts under the street
- 01Residents report water in the street: Residents report: water bubbles out of the asphalt.
- 02Locate the burst: The network team locates the burst by listening.
- 03Shut off the main: The main is valved off – as few households as possible without water.
- 04Contractor digs up: A contractor exposes the pipe.
- 05Repair the pipe: The pipe gets a repair clamp or a new section.
- 06Flush and sample: The main is flushed and sampled before it goes back into service.
- 07Repaired.
What you can change
Controls
- Sampling volume: After construction work or findings more samples are taken.
- Laboratory staff: How many samples are set up and read at once.
- Metered zones: Flow metering per zone: bursts are found faster (model assumption).
- Sewer flow control: Tanks and sewers are controlled together: fewer floodings (model assumption).
- Pipe renewal: More renewal, fewer bursts in the long run.
Disruptions
- Heat summer: Three weeks of heat and drought: the ground moves, twice as many bursts.
- Severe weather: For two days thunderstorms pass: heavy rain comes blow after blow.
- Attack on the control systems: For eight hours the process control system is down: manual operation, the control room is blind.
- Laboratory system fails: For four hours no samples can be set up.
What the model gives a water utility
-
01
The whole cycle
Reservoir, waterworks, service reservoir, pipe network, pumping station, sewer and treatment plant in one walkable model – instead of spread over records, schematics and org charts.
-
02
Time that cannot be cut
The incubator sets the pace. ‘Where the time goes’ shows it as the longest step and makes clear where more lab staff help and where they do not.
-
03
Practise for a crisis
Attack on the control systems, lab system outage, severe weather: disruptions can be triggered, with their effect visible in the control room, lab and sewers at once.
-
04
Making the case for investment
More renewal means fewer bursts in the long run. The model shows the link plainly for the board and member councils.
-
05
For meeting rooms and classrooms
From an office screen to the big screen at the members' assembly or an open day: the model runs in the browser, and a demo mode shows everything on its own.
Basis and limits
Fictional water association · model based on researched industry structures · no forecast for real associations
1 case = 1 sample, 1 rain event, 1 daily sample or 1 pipe burst · 1 figure ≈ 10 employees
All volumes, durations, rates and capacities are model assumptions, not values of a real association.
One association for both drinking water and wastewater is a model assumption; drinking water often lies with municipal utilities.
Documented: reporting of findings to the public health office, which decides on measures; self-monitoring at the plant; limits per size class.
Public sources the model is based on:
- Trinkwasserverordnung 2023
- Wasserhaushaltsgesetz
- Abwasserverordnung, Anhang 1
- BDEW Wasserstatistik
- Selbstüberwachungsverordnung Abwasser NRW
- Abwasserabgabengesetz
Your utility as a model
We model your plants, your network and your lab as far as your questions require. Tell us which processes you want to show; a password for the simulation is yours on request.
cube4tec.de/spiele/minimal-organization/
この件について問い合わせる
Minimal Organization: Wasser- und Abwasserverband
Similar business models
-
Electricity grid operator
A grid operator as a walkable model: see how a solar system or heat pump gets connected and when grid planning becomes the bottleneck.
-
Energy supplier
An energy group without its own grid as a walkable model: supplier switching within 24 hours, power trading until noon, and gas, wind and solar on one site.
-
District administration
A rural district administration as a walkable model: why the morning queue at vehicle registration grows, what shortens it and where the district office runs short of staff.
-
City administration
A large city's administration as a walkable model: see how a building application moves through the departments, how council and committees meet and where people queue at the counter.
-
Pharmaceutical company
A pharmaceutical plant as a walkable model: follow a batch from the cleanroom to certification by the qualified person and see where the four weeks go.
-
Online retail
An order from click to doorstep as a walkable model: payment check, warehouse, packing, trucks, sortation and delivery in a running simulation.
-
Search engine
A search and advertising group as a walkable model: auctions in milliseconds, experiments over weeks, and a new ad campaign that waits for people.
-
Cloud provider
A cloud provider as a walkable model: support cases, zone outages and new data centres on three time scales, in a running simulation.
WASSERVERBAND MERTENTAL is invented and every value is an assumption. With your data the model can show what control room, lab and asset records keep apart today – such as real readings per zone and service reservoir, or bursts by pipe age and soil type.