
シミュレーション · Minimal Organization · Industry
Chemical group with integrated site
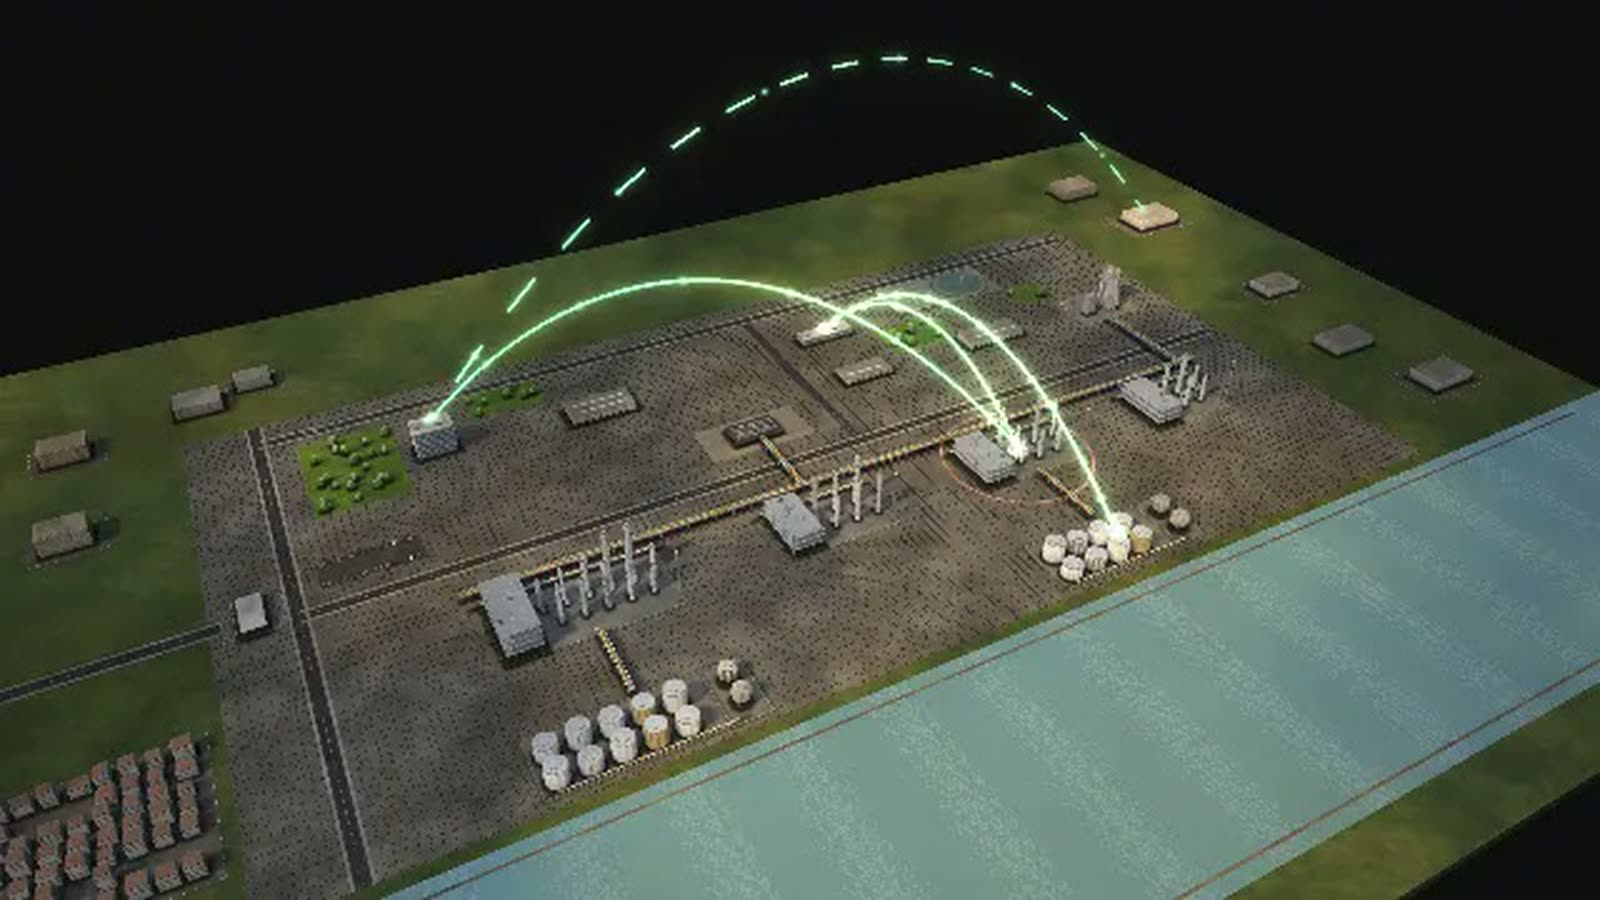
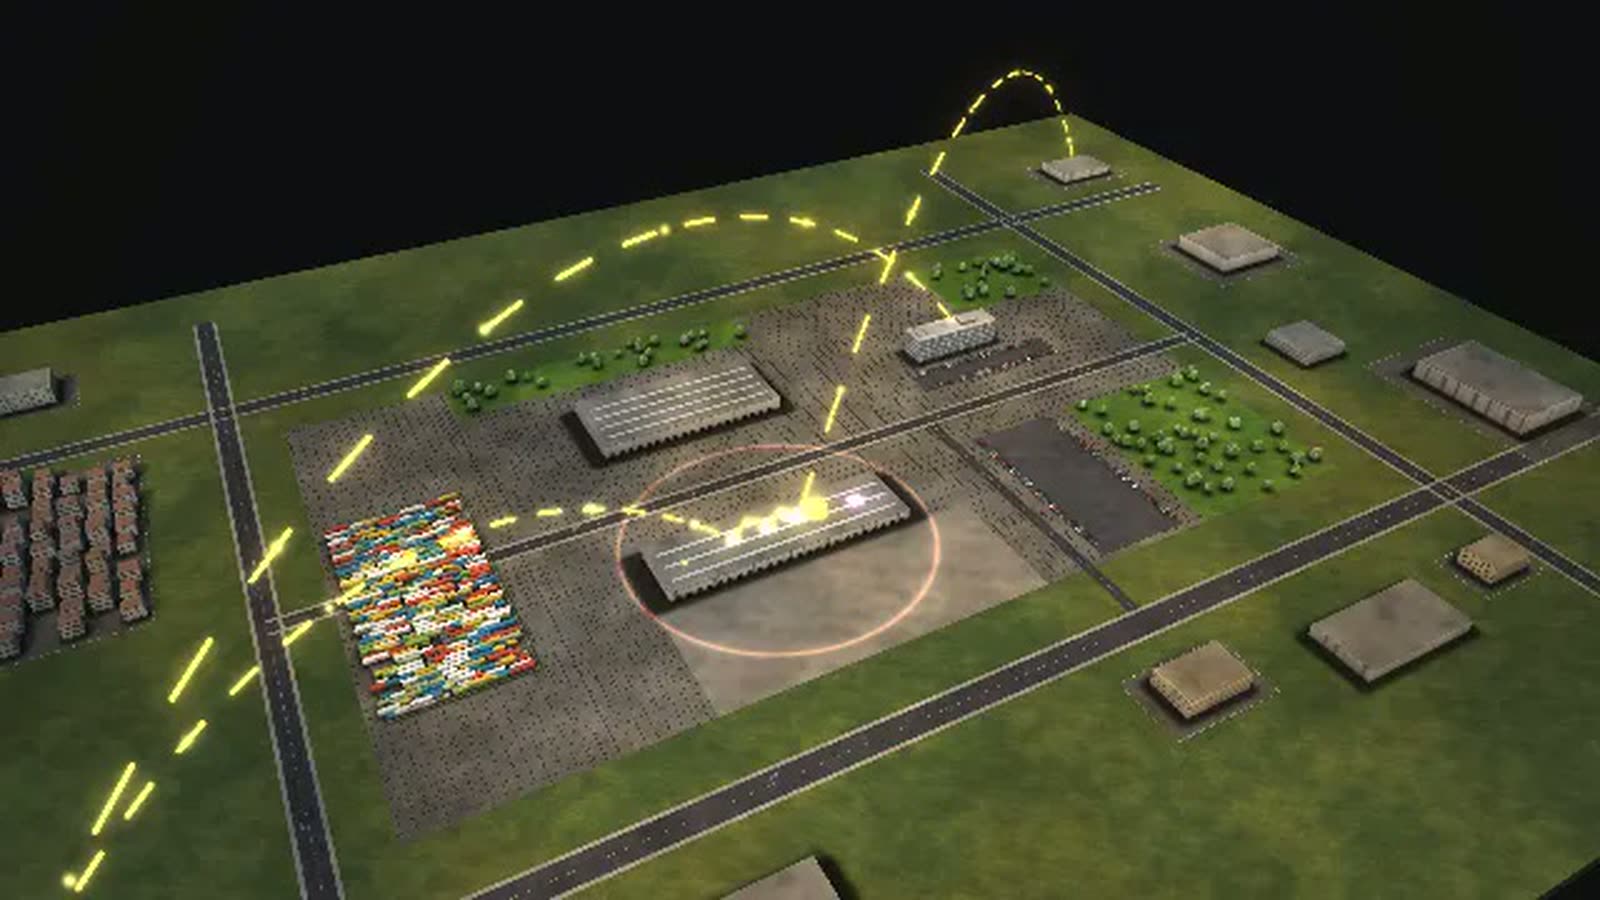
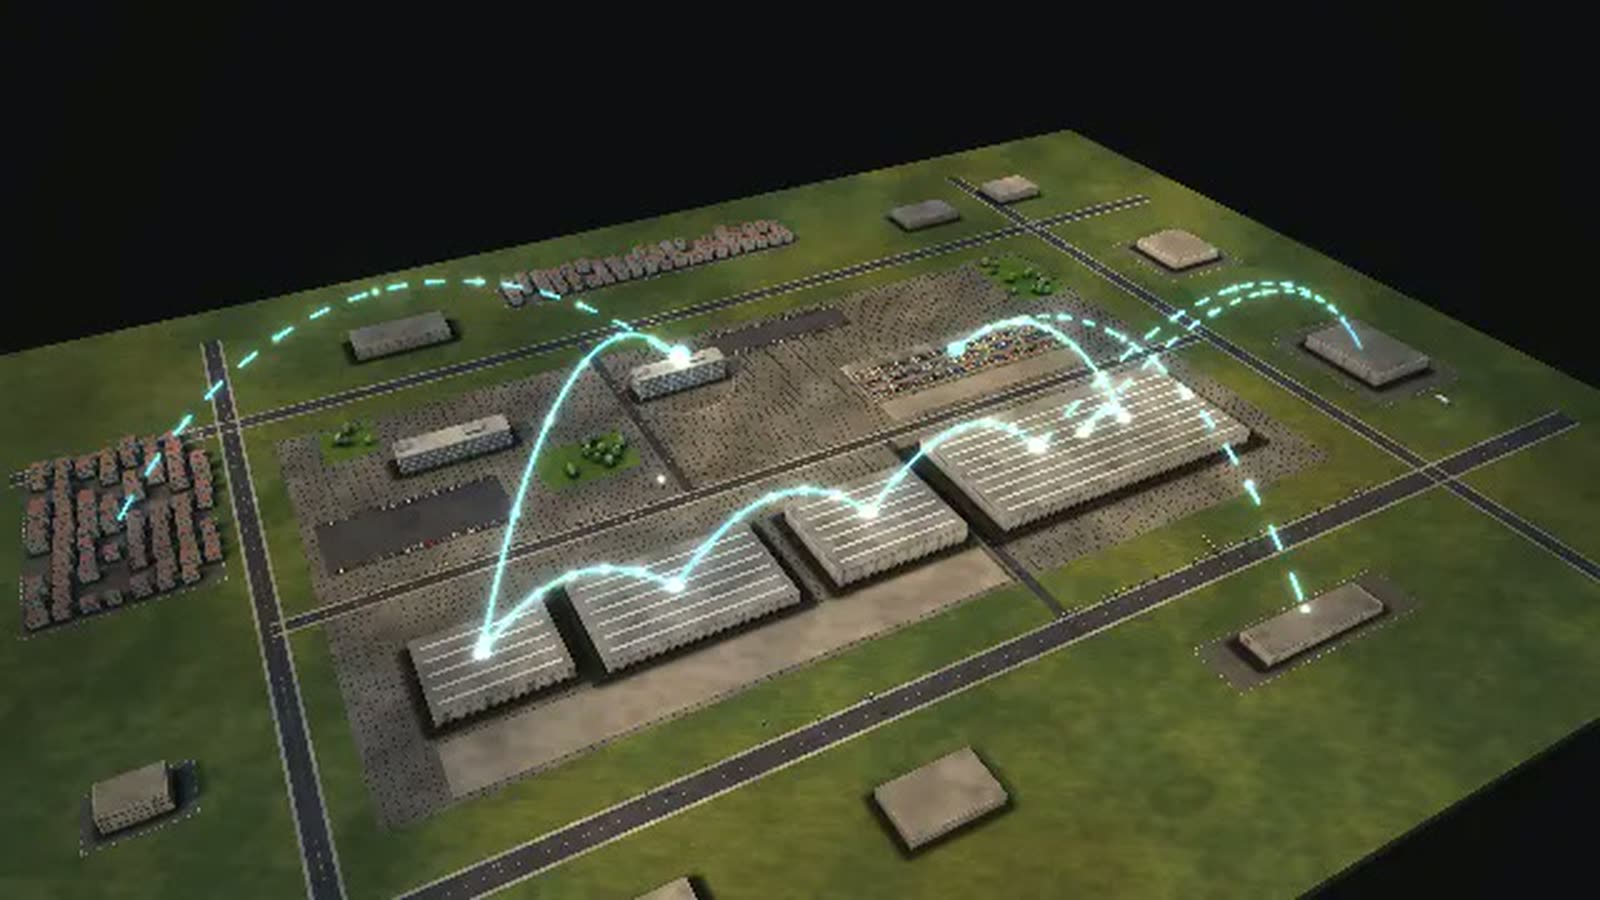
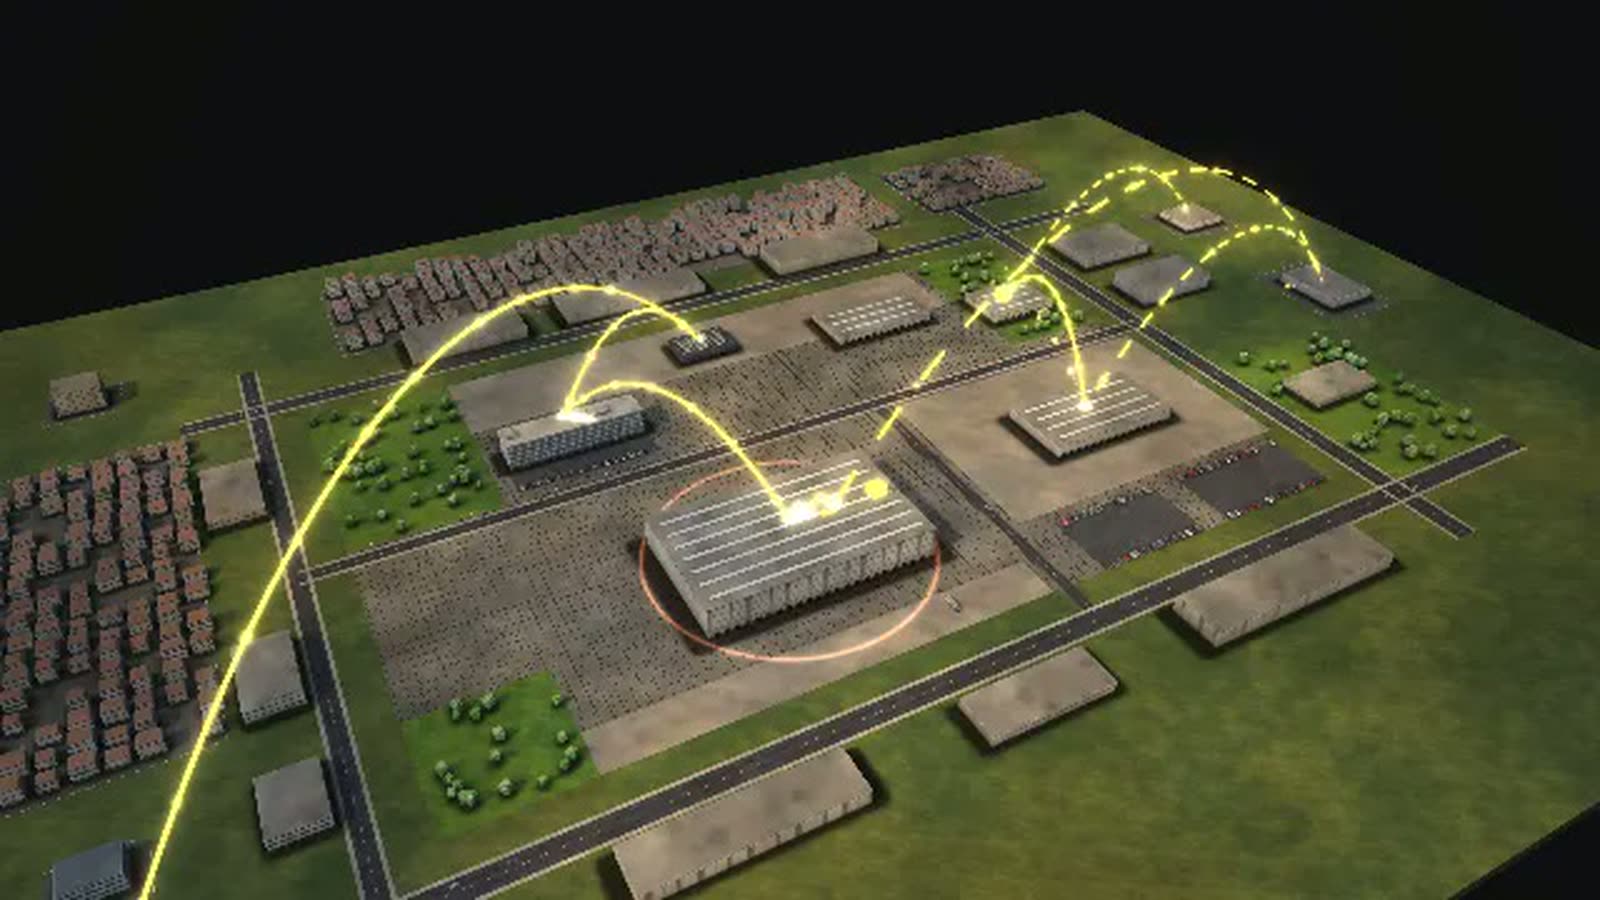
A chemical site as a walkable model: see how a polyethylene order runs through the integrated site and which plants stall when the cracker trips.
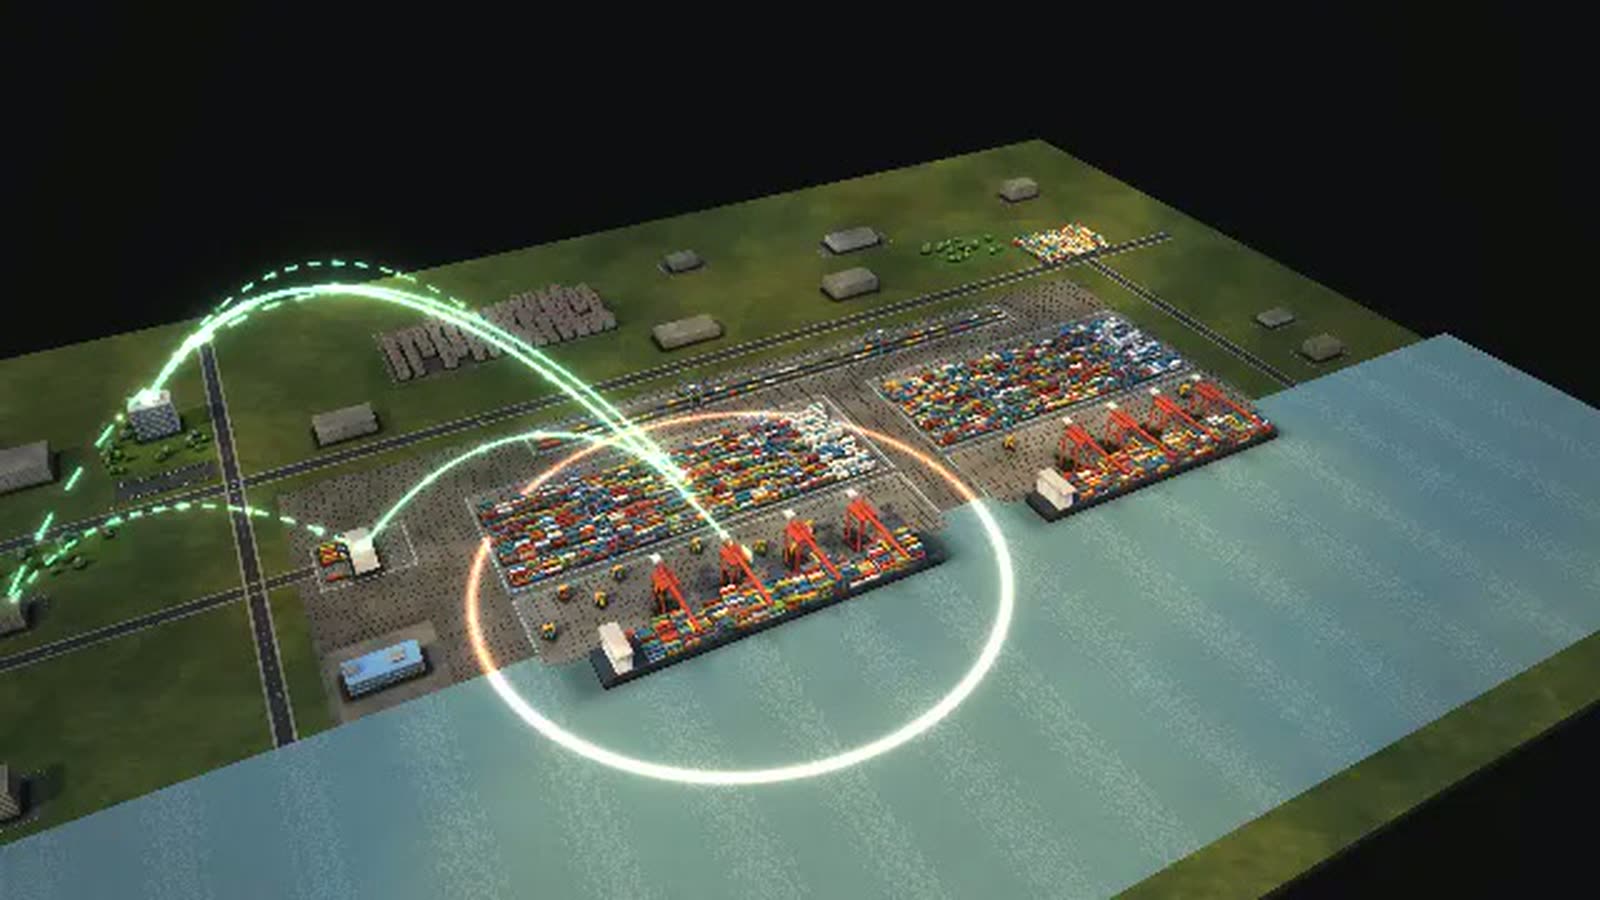
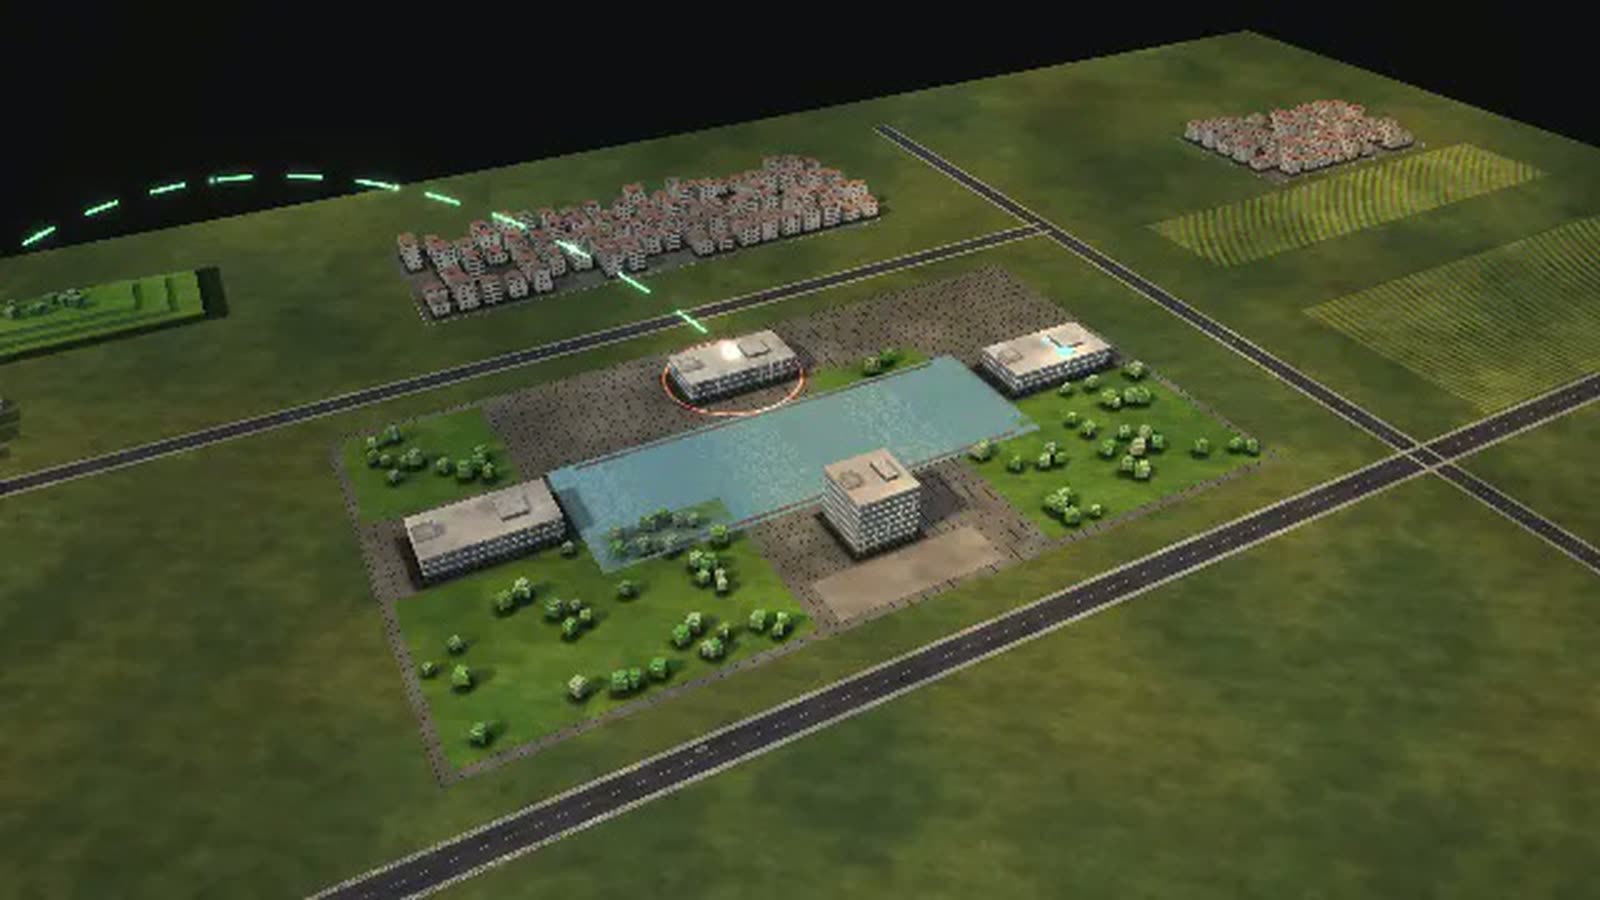
VELTRONA CHEMIE and all its values are invented. With your data the model can show what hardly anyone sees as a whole today – such as real flows between plants in tonnes per hour or the fill levels of your tank farms.
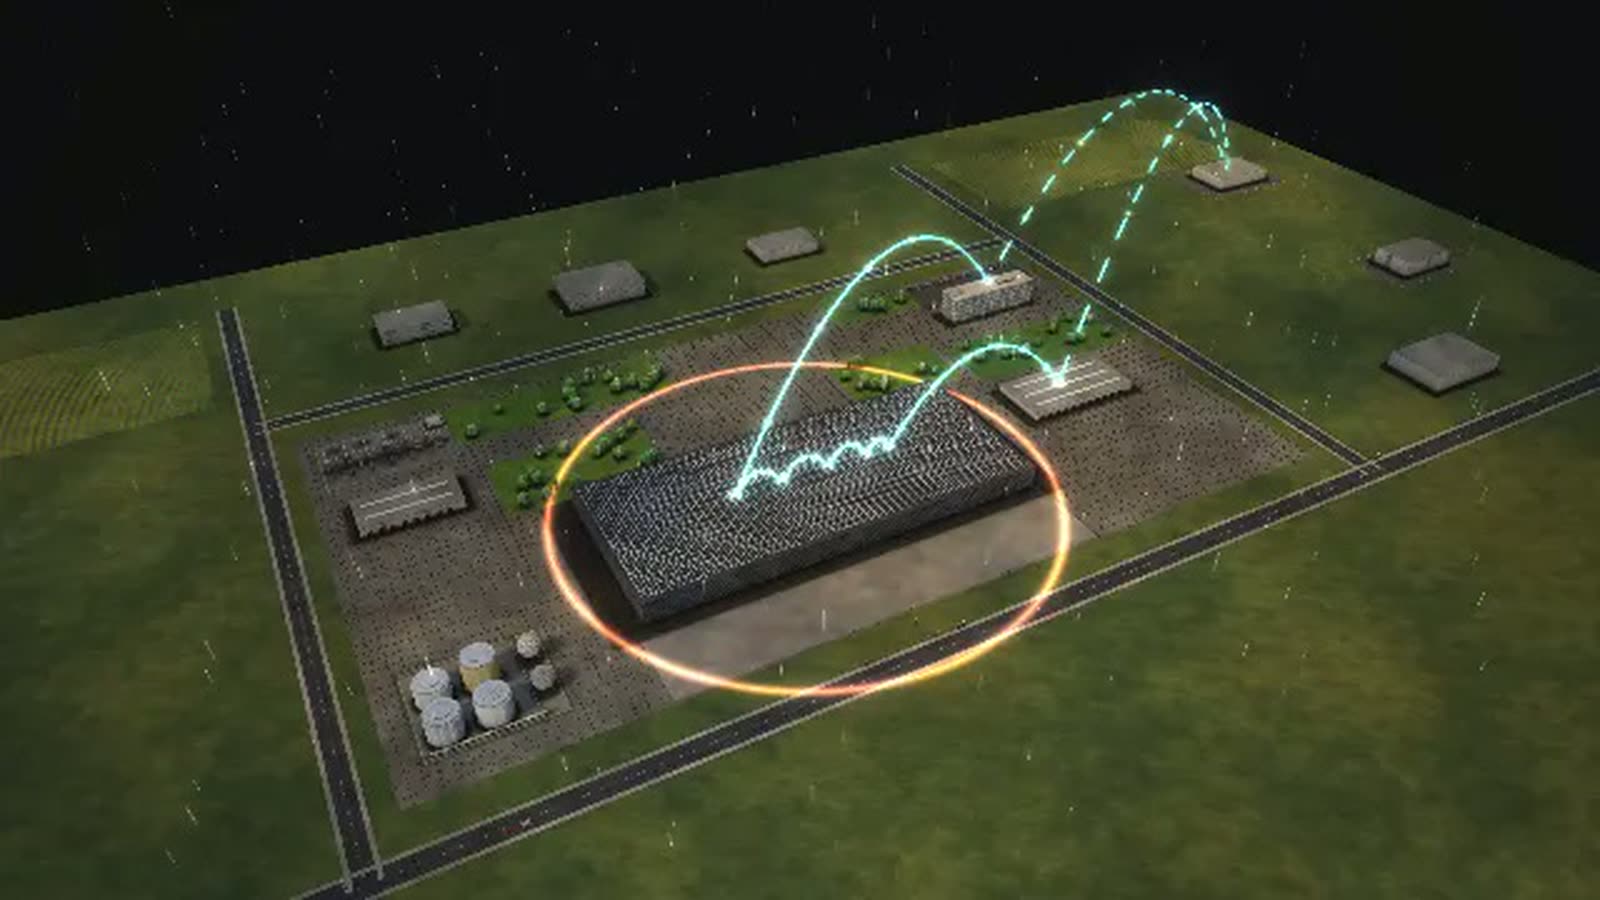
How does order fulfilment work at an integrated chemical site, and what happens when one plant goes down? The model of VELTRONA CHEMIE, a fictional chemical group, shows it. Plants are linked by pipe racks: if the steam cracker trips, ethylene runs short and polyethylene runs at only 40 percent for four days.
The main process: a film manufacturer orders pellets, sales confirms the date, production planning schedules the batch, the plant polymerises, analytics tests, logistics fills silo wagons and bags and ships by rail and truck, and the quality certificate goes to the customer. Target in the model: dispatched within 48 hours.
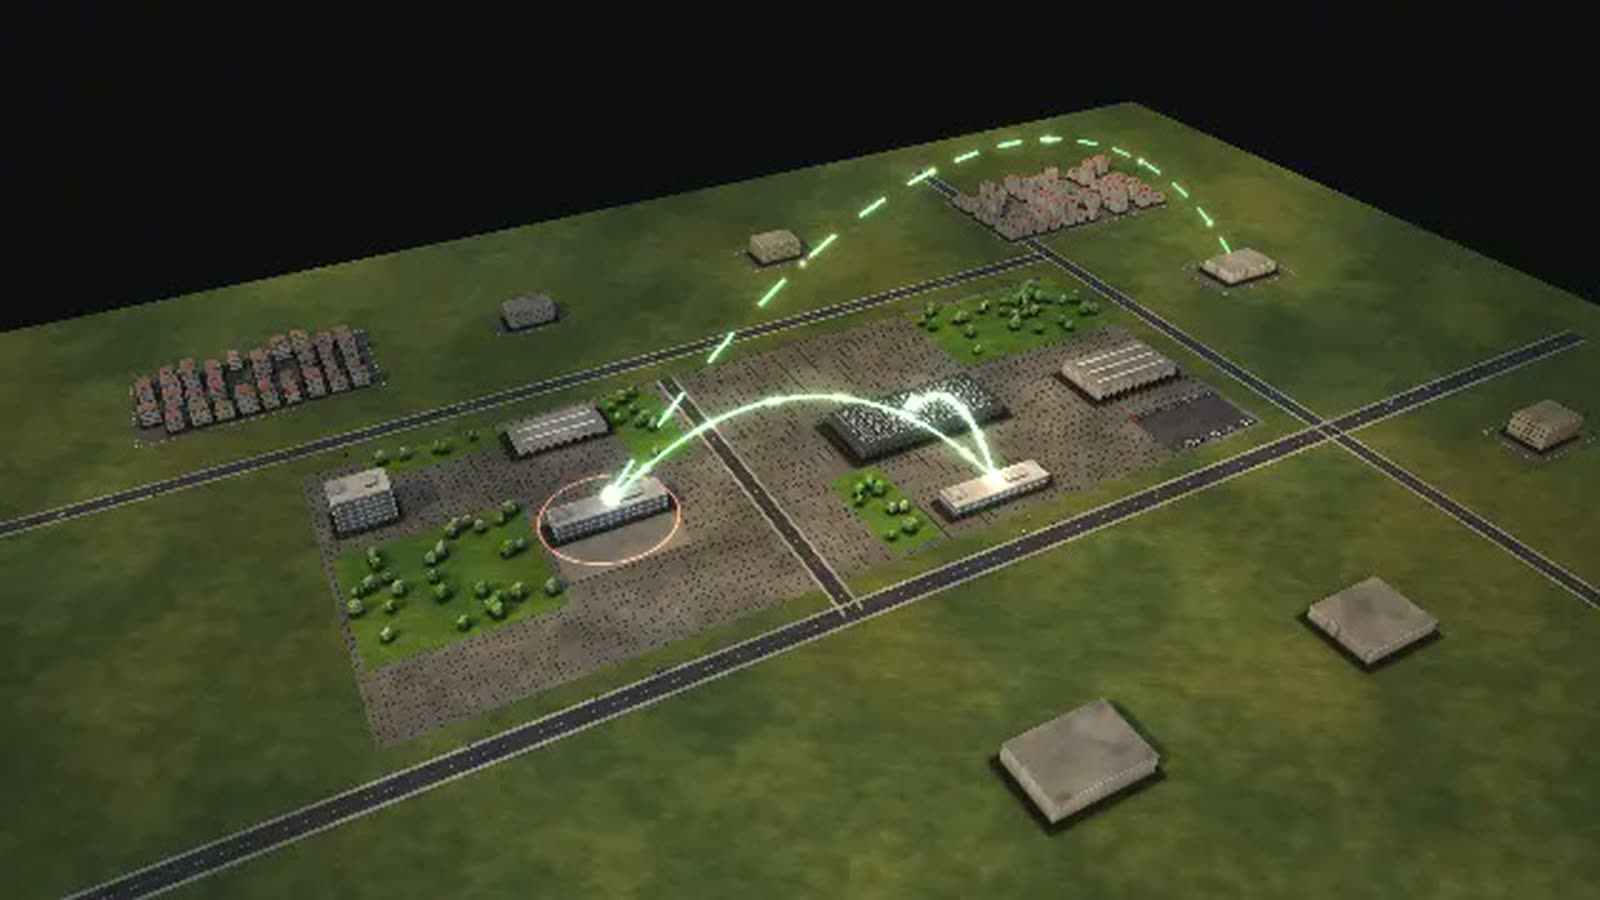
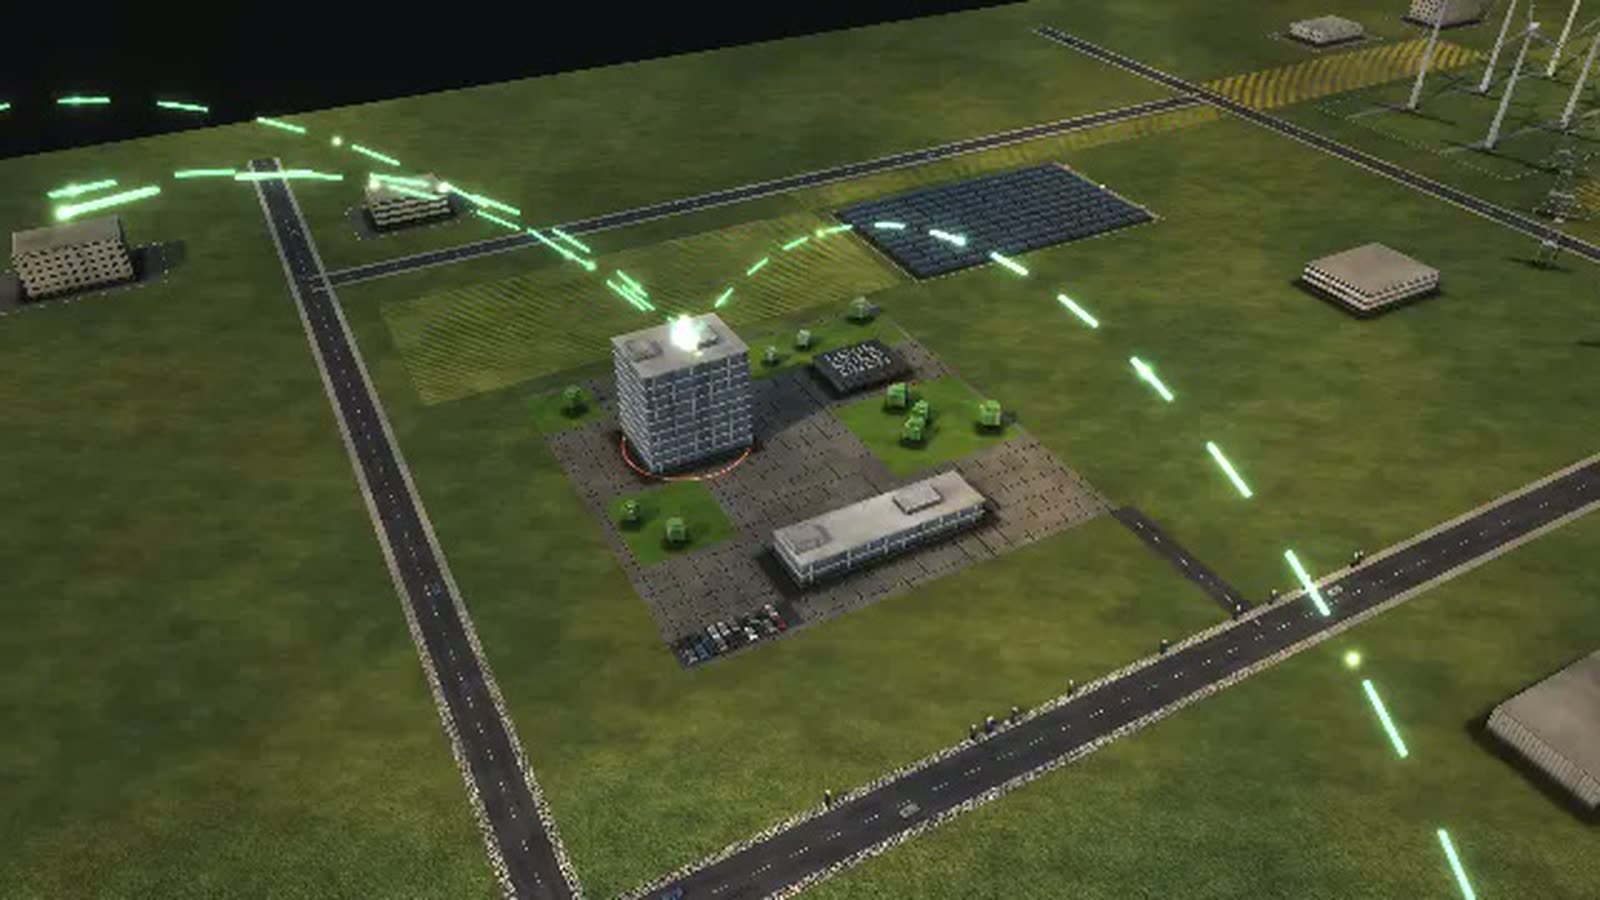
You see 15 buildings, from the cracker, tank farms and site power plant to the plant fire brigade and the gate. The integrated site is reduced to one chain of cracker, polyethylene and tank farm; real sites have hundreds of units. The page speaks to site management, the control room, logistics, procurement, safety and neighbourhood relations.
A customer orders polyethylene
- 01
Customer orders: A packaging film maker orders 20 tonnes of pellets.
- 02
Accept order, commit date: Sales checks quantity and date.
- 03
Production planning: Production planning schedules the batch.
- 04
Polymerise and pelletise: Ethylene from the cracker is polymerised and pelletised.
- 05
Batch quality test: Analytics measures melt index and density.
- 06
Filling into silo wagons and bags: The pellets go into silo wagons and bags.
- 07
Dispatch by rail and truck: Twice a day trains and trucks depart.
- 08
Quality certificate: The quality certificate goes to the customer.
- 09
Delivered.
How a chemical group can use the model
-
Internal communication
15 buildings, 21 departments and the pipe racks between them in one picture. ‘Who works with whom’ shows which plants hang on the cracker – a basis for talks between operations.
対象Site management, business units, communications
-
Onboarding
New staff learn their way around the site: ‘Who sits where – and reports to whom’ puts plants, control room, fire brigade and research on one map.
対象New staff, contractor firms, maintenance
-
Training
Apprentices trigger ‘Cracker down’ or ‘Process control system fault’ and watch the outage spread through the site, and which plants keep running at partial load.
対象Chemical operator apprentices, students, control room staff
-
Explaining to customers and neighbours
Customers see how their order runs from contract to quality certificate. Neighbours and school groups see the site with fire brigade, treatment plant and gate without setting foot on it.
対象Sales, neighbourhood dialogue, visitor groups
-
Strategic overview
Larger intermediate tanks, more polyethylene lines and predictive maintenance side by side, plus low river water and a gas price shock as disruptions. Buffers and investments can be weighed against each other.
対象Board, engineering, procurement
What is shown – why – for whom
| 表示内容 | なぜ | 対象 |
|---|---|---|
| Diagram ‘Who works with whom’: the cracker and the plants behind it | なぜshows the cascade within the integrated site | 対象Site management, crisis team |
| Diagram ‘What the work depends on’: power plant, control room, tank farm, treatment plant | なぜshows the infrastructure beneath every plant | 対象Infrastructure, authorities |
| Diagram ‘What each control does’: intermediate tanks, lines, maintenance | なぜranks buffers and investments | 対象Board, engineering |
| Diagram ‘Who sits where – and reports to whom’ | なぜshows the site with fire brigade and research | 対象Neighbours, training |
| Diagram ‘The path across the site’: pipe racks and gate | なぜshows how materials and people move | 対象Logistics, safety |
| Disruption ‘Low water on the river’ | なぜshows the dependence on shipping | 対象Procurement, logistics |
| Resources view over the plants when the cracker trips | なぜshows partial load across the whole site | 対象Control room, production |
Departments in the model
-
Board
Leads business units and site.
-
Basic chemicals business unit
Base chemicals from the cracker.
-
Steam cracker operations
Cracks naphtha into ethylene and propylene – the start of all chains.
-
Plastics business unit
Profit responsibility for polyethylene.
-
Polyethylene operations
Polymerises and pelletises around the clock.
-
Specialties business unit
Small volumes, many recipes.
-
Sales
Takes orders, commits dates.
-
Site control centre
Keeps the network balance: which plant supplies what to which.
-
Energy and steam network
Power plant, steam, electricity – including plant waste heat.
-
Maintenance and plant construction
Repairs, rebuilds, works under permit.
-
Logistics (tank farm, rail, port)
Fills and ships.
-
Engineering
Plans new plants and modifications.
-
Analytics and quality control
Tests every batch, writes certificates.
-
Plant fire brigade
On site around the clock.
-
Plant security
Checks every access.
-
Process safety and major-hazard officers
Statutory officers – report independently.
-
Environment and wastewater
Emissions, wastewater, permits.
-
Product safety and REACH
Registrations and safety data sheets.
-
Research
Catalysts and polymers.
-
Application technology
Translates molecules into customer value.
-
IT and process control
Control systems, planning, lab.
All processes in the model
A customer orders polyethylene
- 01Customer orders: A packaging film maker orders 20 tonnes of pellets.
- 02Accept order, commit date: Sales checks quantity and date.
- 03Production planning: Production planning schedules the batch.
- 04Polymerise and pelletise: Ethylene from the cracker is polymerised and pelletised.
- 05Batch quality test: Analytics measures melt index and density.
- 06Filling into silo wagons and bags: The pellets go into silo wagons and bags.
- 07Dispatch by rail and truck: Twice a day trains and trucks depart.
- 08Quality certificate: The quality certificate goes to the customer.
- 09Delivered.
The steam cracker trips
- 01Plant shuts down safely: A compressor fails, the cracker shuts down safely. The flare burns.
- 02Informing neighbours and balancing the network run in parallel.
- 03Inform neighbours and authority: The major-hazard officers inform town and authority.
- 04Network balance: who has buffers?: The control centre checks: which plants have tanks with stock?
- 05Situation clear.
- 06Partial load, purchase or shut down: Partial load, purchase by ship or shut down the downstream plants.
- 07Purchase by ship or pipeline: Ethylene comes by ship from outside.
- 08Repair: Maintenance replaces the compressor bearing.
- 09Restart, ramp up the chain: The cracker restarts, the chain ramps up step by step.
- 10Root cause analysis: Root cause analysis: what was the cause, how do we prevent it?
- 11Report to the authority: The report goes to the district government.
- 12Back in operation.
A plant is expanded
- 01Concept and investment request: Engineering plans a second polyethylene line.
- 02Safety study and permit application run in parallel.
- 03Safety study (HAZOP): A team goes through every line: what if something goes wrong here?
- 04Application under pollution control law: Environmental protection files the application.
- 05Filed.
- 06Permitting procedure: The district government reviews, with public participation.
- 07Construction in the running plant: Construction happens in the running plant.
- 08Acceptance by experts: Experts accept the plant.
- 09Accepted.
A customer needs a new plastic
- 01Customer describes the requirement: An auto supplier needs a lighter, stiffer material.
- 02Application technology tests grades: Application technology tests existing grades and recipes.
- 03Samples from the pilot plant: The pilot plant makes samples.
- 04Customer tests the sample: The customer tests for months in its own plant.
- 05REACH and safety data sheet: Product safety checks the registration and writes the safety data sheet.
- 06Recipe into the plant: The recipe enters production planning.
- 07Launched.
What you can change
Controls
- Plastics demand: Economy and customers' stock cycles.
- Polyethylene lines: How many batches run at once.
- Larger intermediate tanks: More stock: more plants keep running at partial load during a trip (model assumption).
- Predictive maintenance: Vibration sensors on compressors: fewer trips (model assumption).
Disruptions
- Cracker down (cascade): For four days ethylene is missing: polyethylene runs at 40 percent.
- Low water on the river: For a month ships run part-loaded: purchases and filling take longer.
- Gas price shock: For two months plants are throttled.
- Process control system fault: For two hours the control centre cannot redirect.
What the model gives a chemical site
-
01
The cascade made visible
A trip at the start of the chain reaches all the way to dispatch. The model shows which plant runs at partial load and for how long – live, for as long as the disruption lasts.
-
02
Weighing buffers
The ‘Larger intermediate tanks’ control shows how extra stock plays out during a trip. The effect is a model assumption; with your data the model calculates with your tanks.
-
03
The whole site
Cracker, three plants, two tank farms, power plant, control room, research, fire brigade and treatment plant as walkable buildings – more than a site map can show.
-
04
Diagrams calculated live
Fourteen diagrams in four groups come from the same simulation: collaboration, dependencies, paths, bottlenecks and org chart.
-
05
From control room to auditorium
The model runs in the browser and on large projections, on an open day or in a crisis team exercise.
Basis and limits
Fictional chemical group · model based on researched industry structures · no forecast for real companies
1 case = 1 customer order, 1 trip, 1 plant change or 1 product idea · 1 figure ≈ 40 employees
All volumes, durations, rates and capacities are model assumptions, not values of a real chemical group.
The network is reduced to one chain: cracker, polyethylene, tank farm. Real sites have hundreds of plants.
Documented: coupling of plants in the network, major-hazard officers, seven-month permit deadline, REACH registration from one tonne.
Public sources the model is based on:
- Störfall-Verordnung (12. BImSchV)
- Bundes-Immissionsschutzgesetz (u. a. §§ 4, 10, 53 ff.)
- REACH, ECHA
- BImSchG § 10 (Fristen)
Your site as a model
We rebuild the integrated structure of your site with the plants and flows that matter for your questions. Get in touch for a first conversation; we provide the password to the simulation on request.
cube4tec.de/spiele/minimal-organization/
この件について問い合わせる
Minimal Organization: Chemiekonzern mit Verbundstandort
Similar business models
-
Pharmaceutical company
A pharmaceutical plant as a walkable model: follow a batch from the cleanroom to certification by the qualified person and see where the four weeks go.
-
Semiconductor manufacturer
A chip fab as a walkable model: see where a wafer lot spends its weeks and why lithography sets the pace for the whole fab.
-
Energy supplier
An energy group without its own grid as a walkable model: supplier switching within 24 hours, power trading until noon, and gas, wind and solar on one site.
-
Freight forwarder
A freight forwarder as a walkable model: groupage, ocean and air freight, cross-docking and customs in a running simulation.
-
Container shipping line
A container line with its own terminal as a walkable model: gate, yard, stowage plan and quay cranes, timed by a fixed schedule.
-
Car manufacturer
A car plant as a walkable model: follow an ordered car through the fixed build sequence and see what happens when the paint shop stops.
-
Online retail
An order from click to doorstep as a walkable model: payment check, warehouse, packing, trucks, sortation and delivery in a running simulation.
-
Search engine
A search and advertising group as a walkable model: auctions in milliseconds, experiments over weeks, and a new ad campaign that waits for people.
VELTRONA CHEMIE and all its values are invented. With your data the model can show what hardly anyone sees as a whole today – such as real flows between plants in tonnes per hour or the fill levels of your tank farms.