
シミュレーション · Minimal Logistik · Overview
Germany · freight flows and nodes
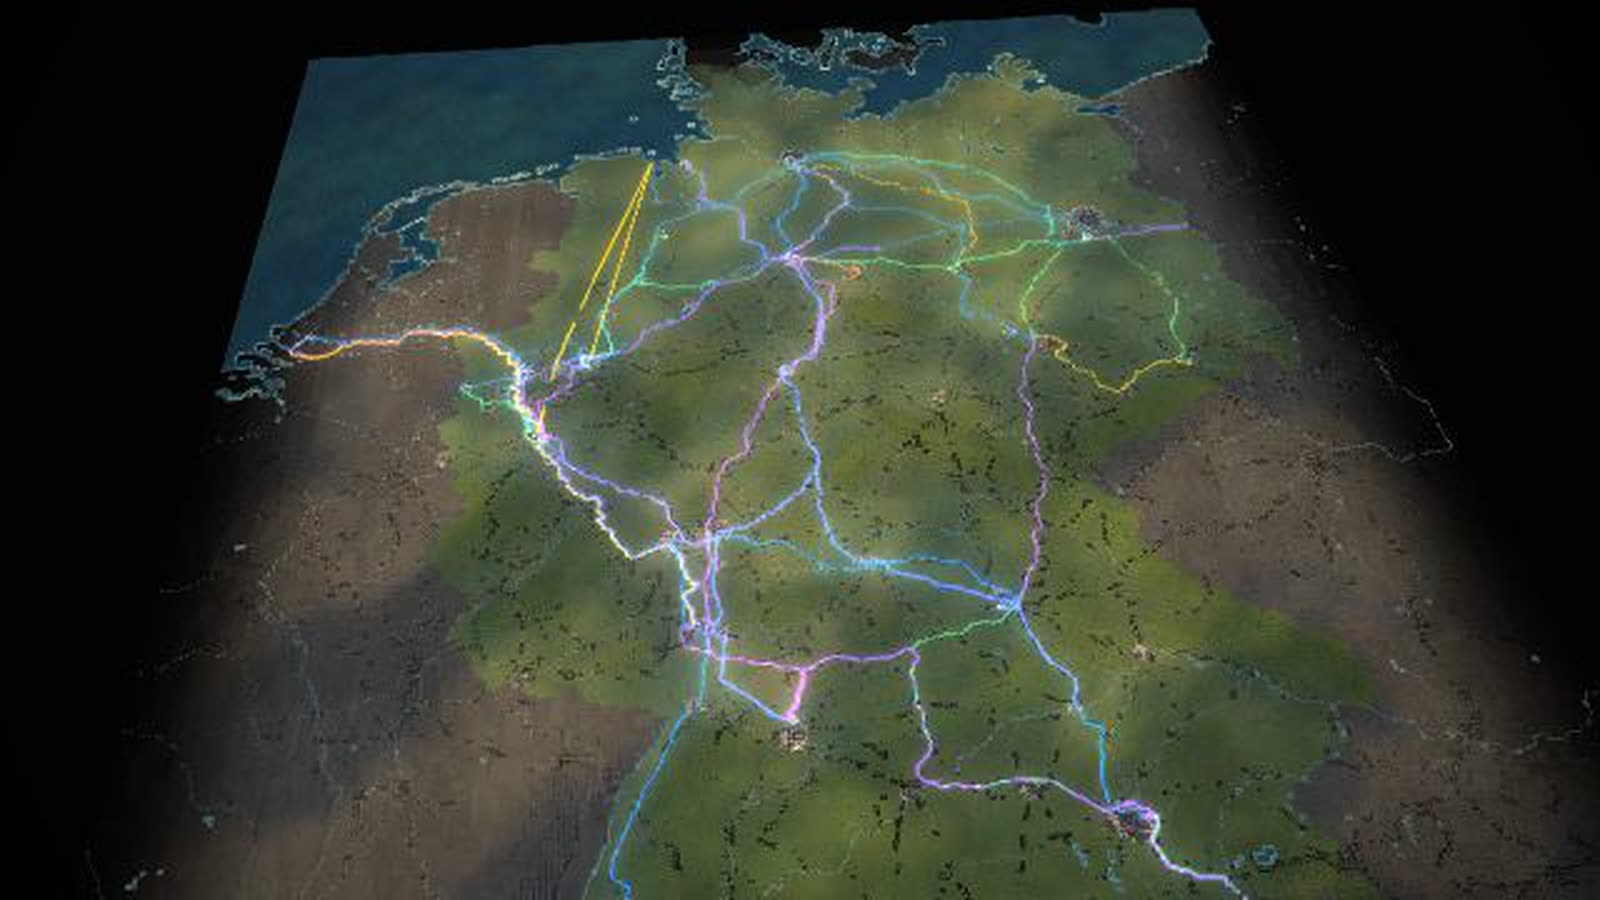
All of Germany as a map of blocks: 27 nodes, 55 freight flows as bands of light, eleven bottlenecks with traffic lights. Controls, seasons, disruptions and ten scenarios change every flow at once, compared with today.
Real are the 27 node positions, road, rail and water routes (OpenStreetMap), official comparison figures (Federal Statistical Office 2024) and the CO₂ factors (German Environment Agency). Volumes of the 55 large flows are model assumptions. With your data, the map shows your flows and bottlenecks.
Freight transport in Germany as a running simulation: the map shows 27 nodes – seaports, inland ports, freight stations, distribution centres, industry and border crossings – and 55 freight flows between them. Each flow is a band of light as wide as its tonnes per day, coloured by road, rail, water or pipeline. Columns of light show the throughput of the nodes, traffic lights the eleven bottlenecks from the Cologne ring to the Schkeuditz interchange. In the model network of the 55 large long-distance flows, about 617 kt move each day – by tonnes 52 % by road, 21 % by rail, 20 % by water and 8 % by pipeline.
Four controls – economy, consumer demand, industrial output, transport cost and tolls –, four seasons with extreme weather and four disruptions change every flow at once. Close the Rhine, and no ship sails between Rotterdam and Basel while rail and road run at their limit. In low water, ships sail half loaded. Ten scenarios show key figure, traffic light and timeline against today. Six supply chains lead from the map into the detailed sites: containers to Dortmund, ore to the blast furnace, new cars via Bremerhaven, air cargo via Leipzig/Halle, train-to-train transfer at Lehrte and chemicals to Rotterdam.
Real are the positions of the nodes, the routes of motorways, railways and waterways, the comparison figures of the official statistics (Federal Statistical Office 2024) and the CO₂ factors of the German Environment Agency. The volumes of the large long-distance flows are model assumptions in the right order of magnitude; chart 3 ‘Who carries the load’ sets them against the statistics. There road carries 84 % of tonnes and 70.7 % of tonne-kilometres, because the model lacks the many short truck trips. Scenarios show effects, not forecasts. This page is for transport planners, shippers, economic development, chambers and associations, schools, universities and exhibitions.
Supply chain ‘Containers Rotterdam → Dortmund’
- 01
Rotterdam: containers from the sea ship onto the Rhine barge
- 02
Up the Rhine to Duisburg – about 200 km upstream
- 03
Duisburg: transhipment from Rhine barge to canal barge, rail and truck
- 04
Via the Rhine-Herne and Dortmund-Ems canals to Dortmund (ships up to 110 m, two tiers)
- 05
Dortmund, container terminal at the canal: from barge to truck – about 4 km to the Westfalenhütte plant
- 06
Delivered: Westfalenhütte plant. Goods from Duisburg go there (documented); this container chain is an example (model)
What is shown – why – for whom
| 表示内容 | なぜ | 対象 |
|---|---|---|
| 55 freight flows as bands of light, coloured by road, rail, water and pipeline | なぜShows how goods travel, and how much. | 対象Transport planning, teaching |
| Traffic lights at eleven bottlenecks, from the Cologne ring to the Schkeuditz interchange | なぜShows where the network gets tight. | 対象Transport planning, local authorities |
| Chart ‘Who carries the load’: the model network today and in the scenario next to the official statistics, by tonnes and tonne-kilometres | なぜShows what the long-distance network covers and what the many short truck trips add. | 対象Transport planning, universities, associations |
| Chart ‘Performance and climate balance’ with the German Environment Agency’s 2024 CO₂ factors | なぜShows the climate impact of each mode. | 対象Associations, schools |
| Season control: autumn harvest (food +18 %) and Christmas run-up (containers +8 %) | なぜShows how the year shifts the flows. | 対象Planning, retail |
| Ten scenarios with key figure, traffic light and timeline against today | なぜMakes effects comparable without forecasting. | 対象Planning, strategy |
| Six supply chains from the map into the detailed sites | なぜLinks the network to the individual site. | 対象Public relations, exhibitions |
Facilities and areas in the model
-
Seaport
Rotterdam, Hamburg, Bremerhaven, Wilhelmshaven.
-
Inland port
Duisburg, Dortmund, Magdeburg.
-
Industry
Duisburg-Schwelgern (Hütte), Mannheim/Ludwigshafen, Salzgitter, Wolfsburg, Ingolstadt, Weser-Ems.
-
City
Köln, Hannover, Kassel, Dresden.
-
Freight yard · transhipment
Frankfurt, Stuttgart, München, Nürnberg.
-
Distribution centres
Berlin, Leipzig/Halle, Venlo.
-
Border crossing · corridor
Basel, Kufstein (Brenner), Frankfurt (Oder).
-
Bottlenecks (traffic lights)
Kölner Ring, Kamener Kreuz, Kreuz Kaiserberg, Frankfurter Kreuz, Elbtunnel A7, Kreuz München-Nord, A8 bei Stuttgart, A100 Berlin, A3 bei Würzburg, Schkeuditzer Kreuz, A2 bei Hannover.
-
Modes of transport
Road, Rail, Waterway, Pipeline – the colours of the bands of light.
-
Goods groups
container goods, raw materials, food, industrial goods, energy carriers.
Processes in the model
Supply chain ‘Containers Rotterdam → Dortmund’
- 01Rotterdam: containers from the sea ship onto the Rhine barge
- 02Up the Rhine to Duisburg – about 200 km upstream
- 03Duisburg: transhipment from Rhine barge to canal barge, rail and truck
- 04Via the Rhine-Herne and Dortmund-Ems canals to Dortmund (ships up to 110 m, two tiers)
- 05Dortmund, container terminal at the canal: from barge to truck – about 4 km to the Westfalenhütte plant
- 06Delivered: Westfalenhütte plant. Goods from Duisburg go there (documented); this container chain is an example (model)
Supply chain ‘Ore → steelworks → steel’
- 01Rotterdam: iron ore from Brazil and Canada, coal – transferred onto push convoys
- 02Push convoy up the Rhine: up to six lighters, about 15,000 t
- 03Schwelgern works harbour: grabs unload the lighters onto the ore and coal stockyards
- 04Conveyors feed the blast furnaces – the industrial customer for the ore
- 05Steel from Duisburg by rail to Dortmund
- 06Westfalenhütte: processing (coating) – goods from Duisburg come here (documented), the rail route is an example
Supply chain ‘New cars → Bremerhaven’
- 01A new car from a plant near Stuttgart is bound for overseas
- 02Kornwestheim: car trains are assembled in the marshalling yard – two decks, up to ten new cars per wagon
- 03North by rail: about 700 km to the mouth of the Weser
- 04Bremerhaven: car trains roll into the port – for exports around 80 % of new cars arrive by rail (terminal figure)
- 05Car park: the car waits for its ship. The fill level follows the node’s stock (model)
- 06Up the stern ramp onto the car carrier – bound for overseas. The chain is an example (model)
Supply chain ‘Air cargo Leipzig/Halle’
- 01An urgent spare part from Nuremberg has to reach a customer in Europe by tomorrow morning
- 02By truck north on the A9 to the Leipzig/Halle air cargo hub
- 03At the Schkeuditz interchange: a jam makes it tight – the freighters leave on schedule
- 04In the sorting halls the shipment is sorted by destination and packed into an air cargo container
- 05On the apron: tug trains bring the containers to the aircraft, which is loaded through its door
- 06Take-off into the night – by morning the part is with the customer. The chain is an example (model)
Supply chain ‘Containers Hamburg → Munich’
- 01Hamburg: containers from overseas are loaded onto a train heading south
- 02At the terminal station the train is loaded – forty to fifty containers
- 03By rail to Lehrte near Hanover, about 180 km
- 04Lehrte MegaHub: gantry cranes lift containers from train to train – no shunting
- 05Beneath the cranes driverless transporters carry the box to its new train
- 06On another train to Munich. The chain is an example (model)
Supply chain ‘Chemicals → Rotterdam’
- 01Ludwigshafen: a chemical product for a customer overseas
- 02In the plants raw materials become a feedstock; pipe bridges link the units
- 03On the works railway it travels in a tank wagon to the port
- 04At the tanker berth it is pumped across: loading arms fill the tanker
- 05Down the Rhine to Rotterdam, onto the sea-going ship there. The chain is an example (model)
Choose a scenario
- 01tap a scenario in the deck
- 02all 55 flows recalculate
- 03key figure, traffic light and timeline show the difference from today
- 04‘Back to today’
Open a chart
- 01key B or menu
- 02one of ten 3D charts builds up
- 03key message, findings and figures calculate live with the chosen scenario
How the Germany map can be used
-
Planning and strategy
The chart ‘What each lever does’ shows what economy, consumption, industry and tolls each bring about. Expensive roads shift freight to rail and water, and the map shows at once how flows and traffic lights change.
対象Logistics and transport planners, shippers
-
Onboarding and training
Six supply chains lead step by step from the map into the sites: from the sea ship in Rotterdam to the steelworks in Dortmund, from the plant near Stuttgart up the stern ramp in Bremerhaven.
対象Logistics and forwarding trainees, new teams
-
Local authorities and economic development
‘Who supplies whom’, ‘How far goods travel’ and ‘Where it gets tight’ show every node in the network: where its goods come from, how far they travel and where they are slowed down.
対象Economic development, chambers, associations
-
Schools, universities, museums
Ten 3D charts calculate live from the same model, from ‘Goods by mode’ to ‘Performance and climate balance’. Each has its own link and opens directly in class.
対象Schools, universities, museums and exhibitions
-
Public communication
Rhine closed, rail strike, port strike, motorway closure: trigger any disruption, see where freight shifts and where stocks pile up – and return to today with one tap.
対象Public relations, associations, shippers
What you can change
Controls
- Economy: How much is produced and traded overall. Acts on all flows.
- Consumer demand: Container goods and food for retail. Weight here about 47 % of the volume.
- Industrial output: Raw materials, steel, parts, chemicals. Weight here about 53 % of the volume.
- Transport cost / tolls: Expensive roads shift freight to rail and water.
- Season: Spring: more building materials and seed, raw materials +8 %, food +5 %. Autumn: harvest (food +18 %), Christmas run-up (containers +8 %), first heating oil deliveries. Winter: heating oil and Christmas trade, less road capacity.
Disruptions
- Disruption: Motorway: One lane remains, the detour loads the neighbouring routes.
- Disruption: Rail strike: Freight trains stand still, trucks and ships take over part, stocks pile up.
- Disruption: Rhine closed: No ship between Rotterdam and Basel, rail and road at their limit.
- Disruption: Port strike: Hardly any handling, ships wait at anchor, containers pile up.
- Extreme weather: Flood: Rhine closed, ships lie idle, rail and trucks take over where they can.
- Extreme weather: Low water: Ships sail half loaded, more trips, shift to rail.
- Extreme weather: Storm, fog: Cranes in the seaports stop, ships wait, motorways slower.
- Extreme weather: Snow and ice: Bottlenecks overloaded, canals partly frozen.
What the Germany map gives you
-
01
One network instead of many tables
Ports, rail hubs, industry and distribution centres on one map, volumes as bands of light: you see at a glance who supplies whom and where it gets tight.
-
02
Effects, not forecasts
Every scenario recalculates all 55 flows and shows the difference from today, so consequences can be discussed without claiming a future.
-
03
Disruptions without damage
Rhine closure, rail strike, port strike and motorway closure, plus flood, low water, storm and ice: you see where freight goes instead.
-
04
Ten charts, open about the statistics
Key message, findings and figures calculate live with the scenario, and every chart names its source. ‘Who carries the load’ sets the model network beside the official statistics, ‘How far goods travel’ shows their average haul distances.
-
05
From the map into the site
Thirteen detailed sites use the same figures as the map. What happens in the network arrives at the quay, the track and the gate.
-
06
For foyers and big screens
Runs in the browser and on large projections. Without input, the demo starts after 75 seconds.
Your region as a model
Would you like to see the flows of your region, your network or your supply chain like this? Write or call us and we'll work out which volumes, nodes and modes the model needs. We'll send you the password on request.
cube4tec.de/spiele/minimal-logistik/
この件について問い合わせる
Minimal Logistik: Deutschland · Güterströme und Knoten
Basis and limits
Real are the positions of the 27 nodes, the routes of motorways, railways and waterways (OpenStreetMap), the comparison figures from official statistics (Destatis 2024) and the CO₂ factors (German Environment Agency 2024). The volumes of the 55 large flows are model assumptions in the right order of magnitude; scenarios show effects, not forecasts.
Public sources the model is based on:
- OpenStreetMap contributors: map data (ODbL 1.0)
- OpenFreeMap / OpenMapTiles: vector tiles
- Terrain Tiles, AWS Open Data (Terrarium)
- Federal Statistical Office: freight transport by mode
- Federal Statistical Office: freight volumes by commodity 2024
- Federal Statistical Office: inland navigation 2025
- German Environment Agency: freight emission data 2024 (g CO₂e per tonne-kilometre)
- ELWIS: inland waterways – technical data
More places in the model
-
Hamburg · Container Terminal Altenwerder
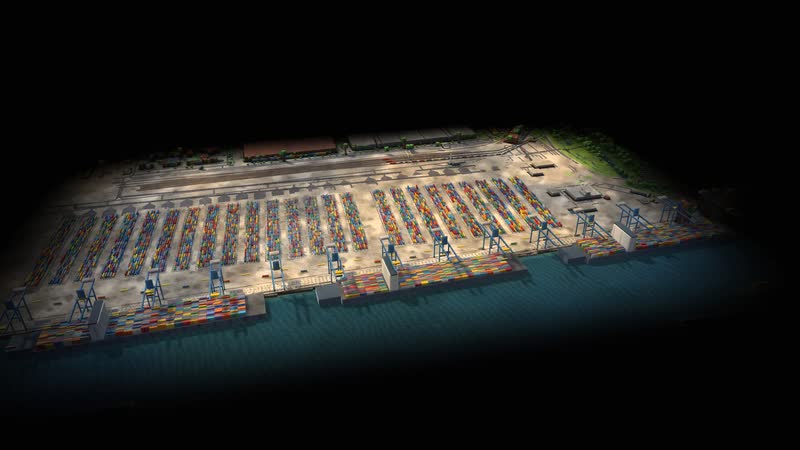
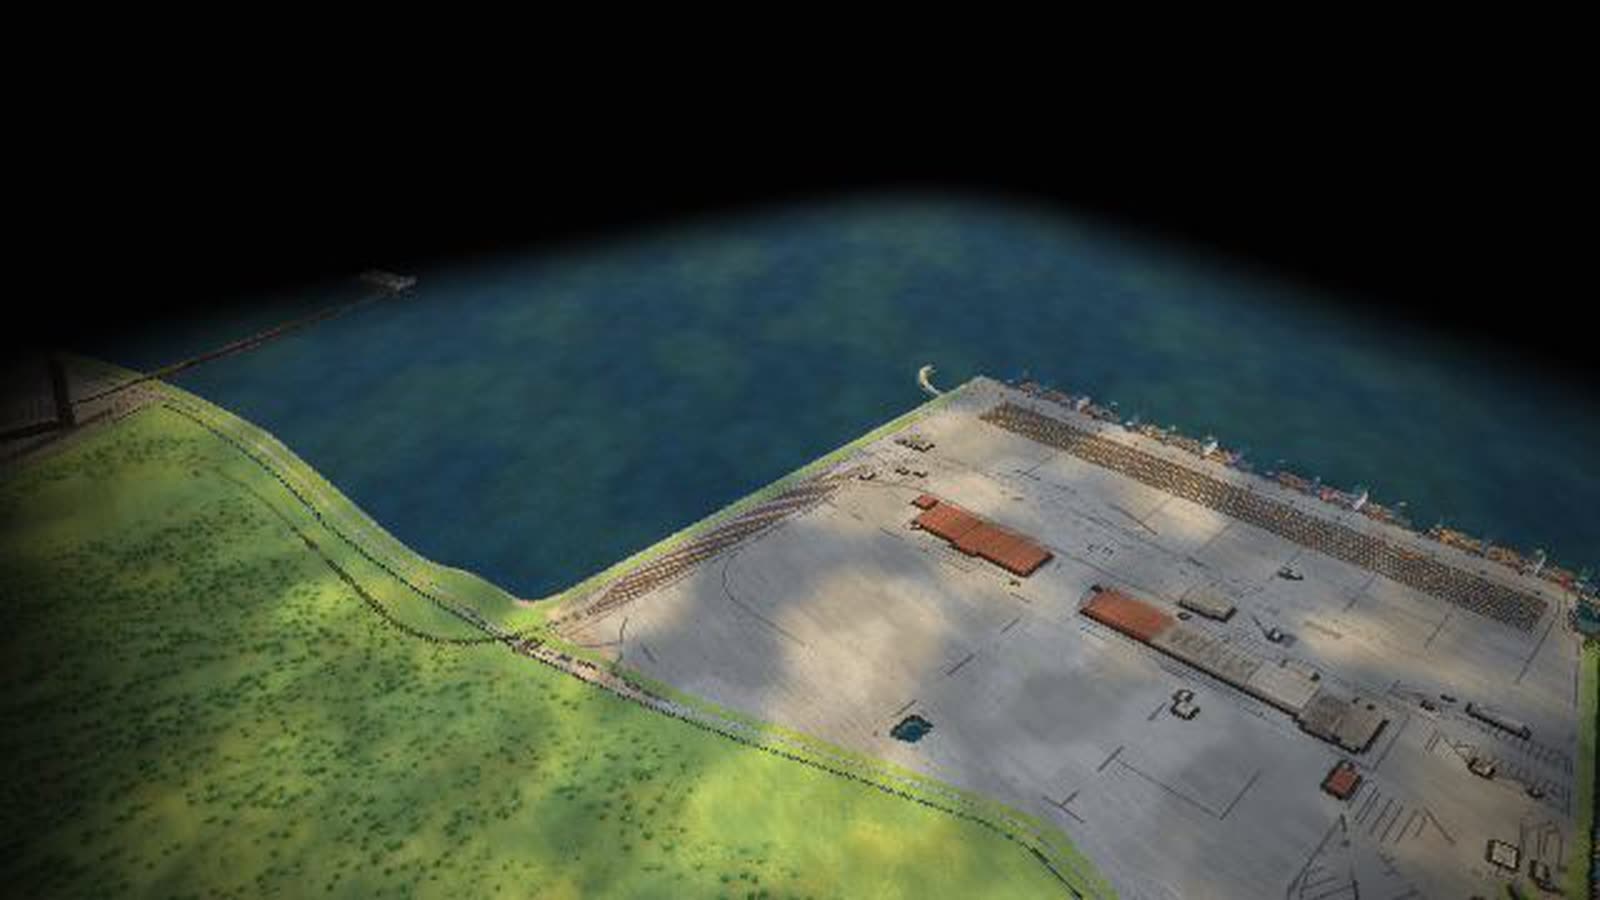
An automated container terminal as a walkable model: up to 14 container gantries, driverless transport vehicles, the block yard, a rail station for trains up to 740 m and the truck gate.
-
Duisburg · logport I (Rheinhausen)
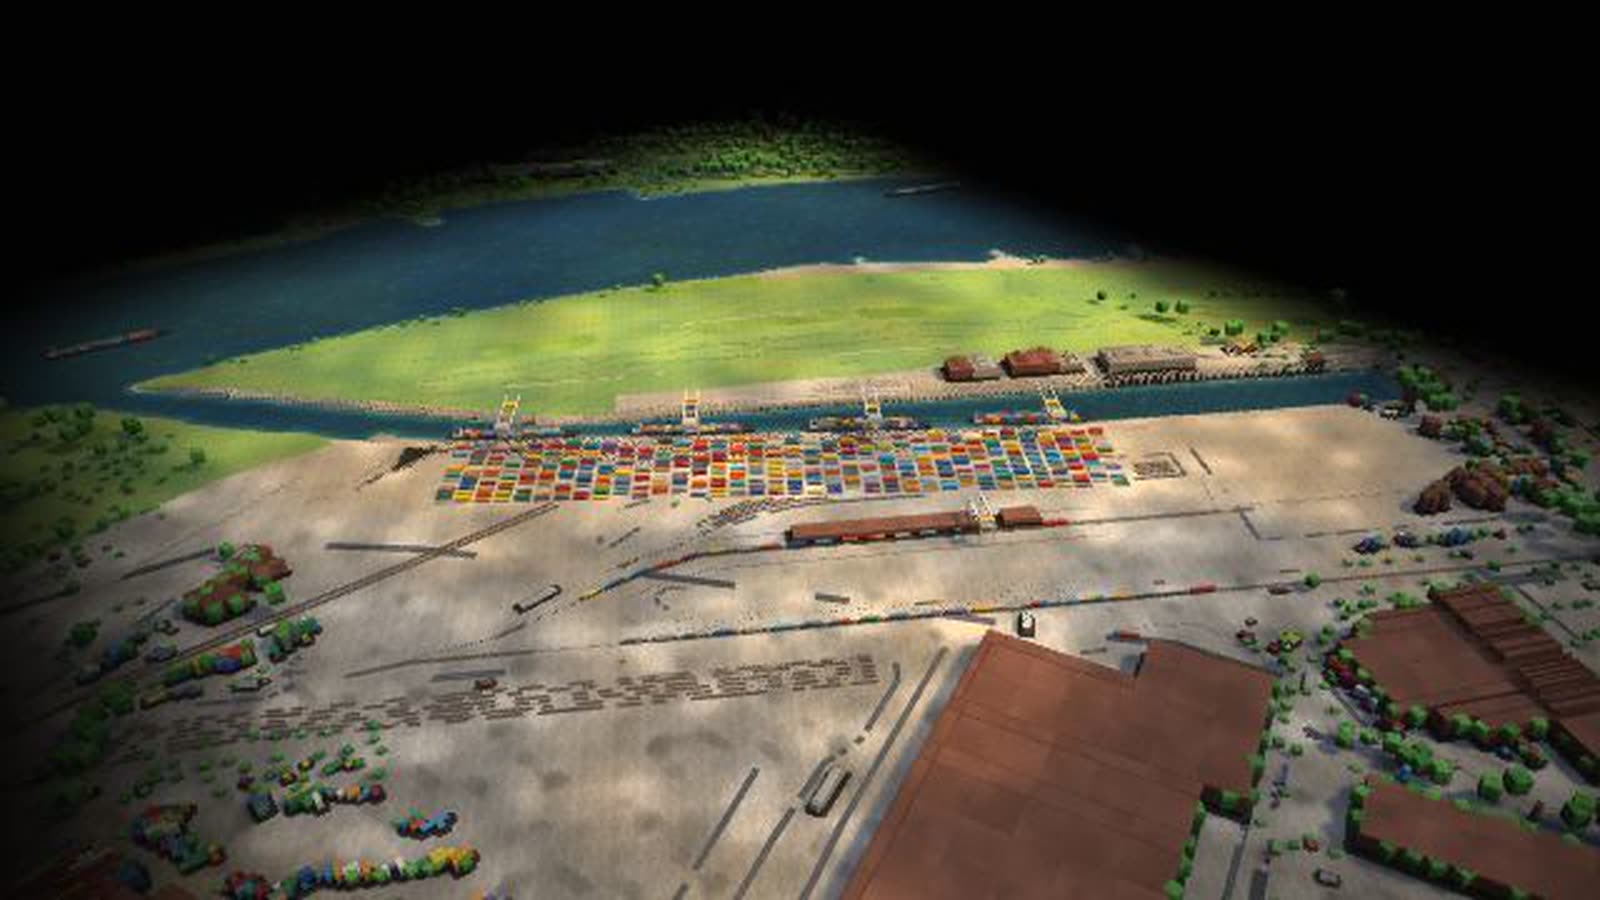
A trimodal inland port on the Rhine as a walkable model: Rhine barges with sea containers from Rotterdam, gantries and yard, trains to the south, Eastern Europe and Asia, trucks into the region.
-
Ludwigshafen · chemicals on the Rhine
A large chemical site on the Upper Rhine as a walkable model: tankers at loading arms, tank wagons on the works railway, pipe bridges, the Friesenheimer Insel tank farm and the container quay.
-
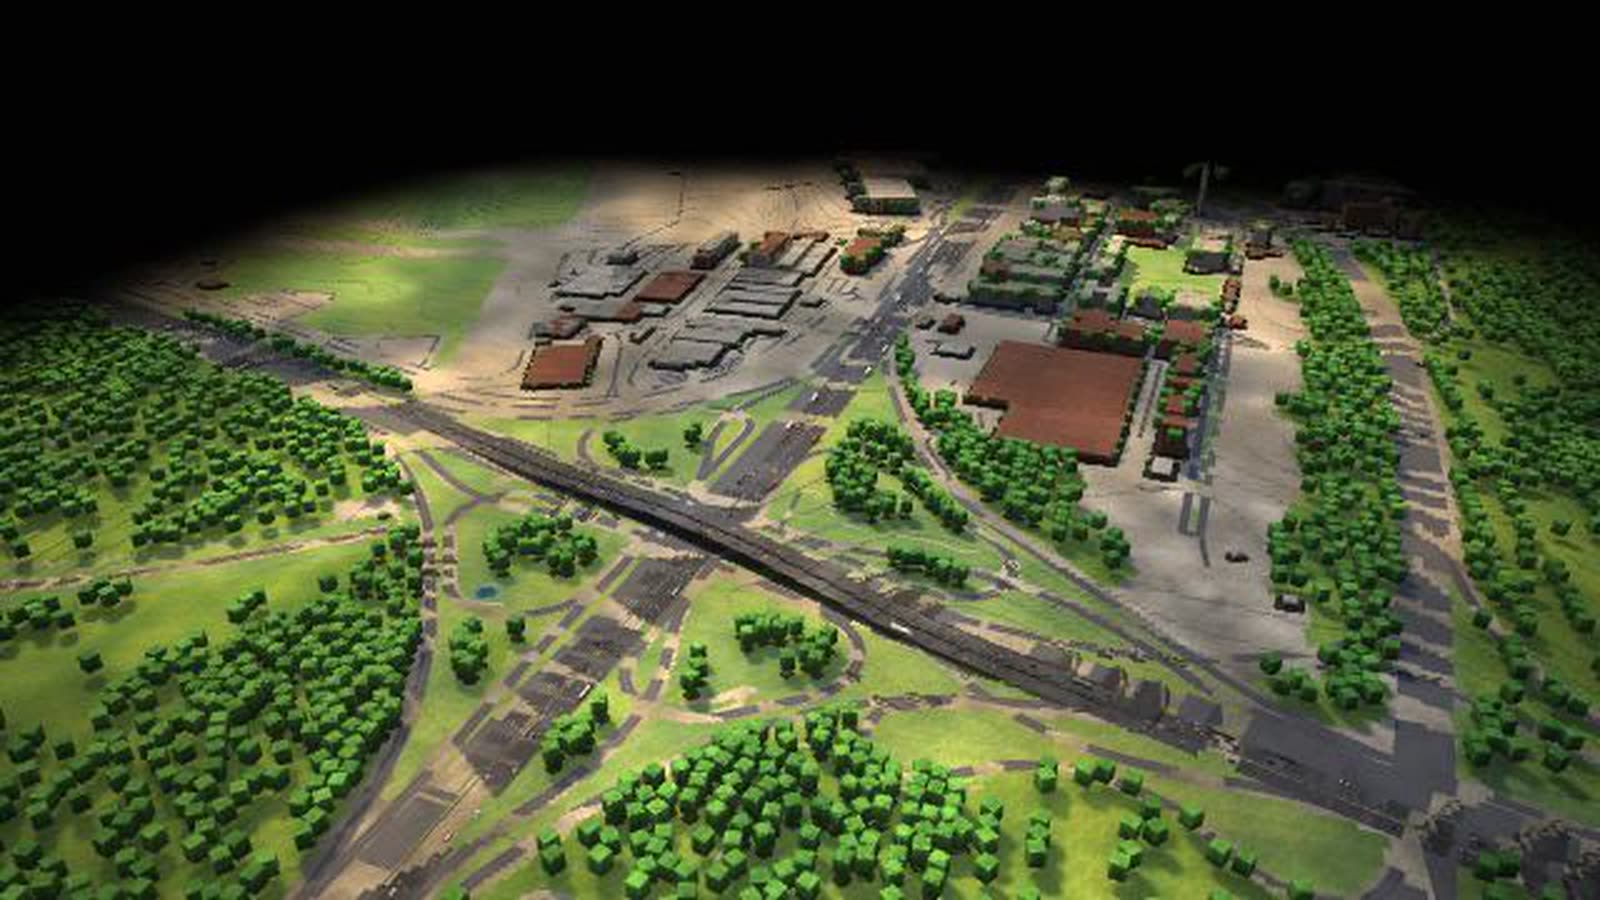
Lehrte · MegaHub
A train-to-train transfer facility as a walkable model: six tracks of 720 m each, three gantry cranes, driverless transporters – and freight trains regrouped without shunting.
-
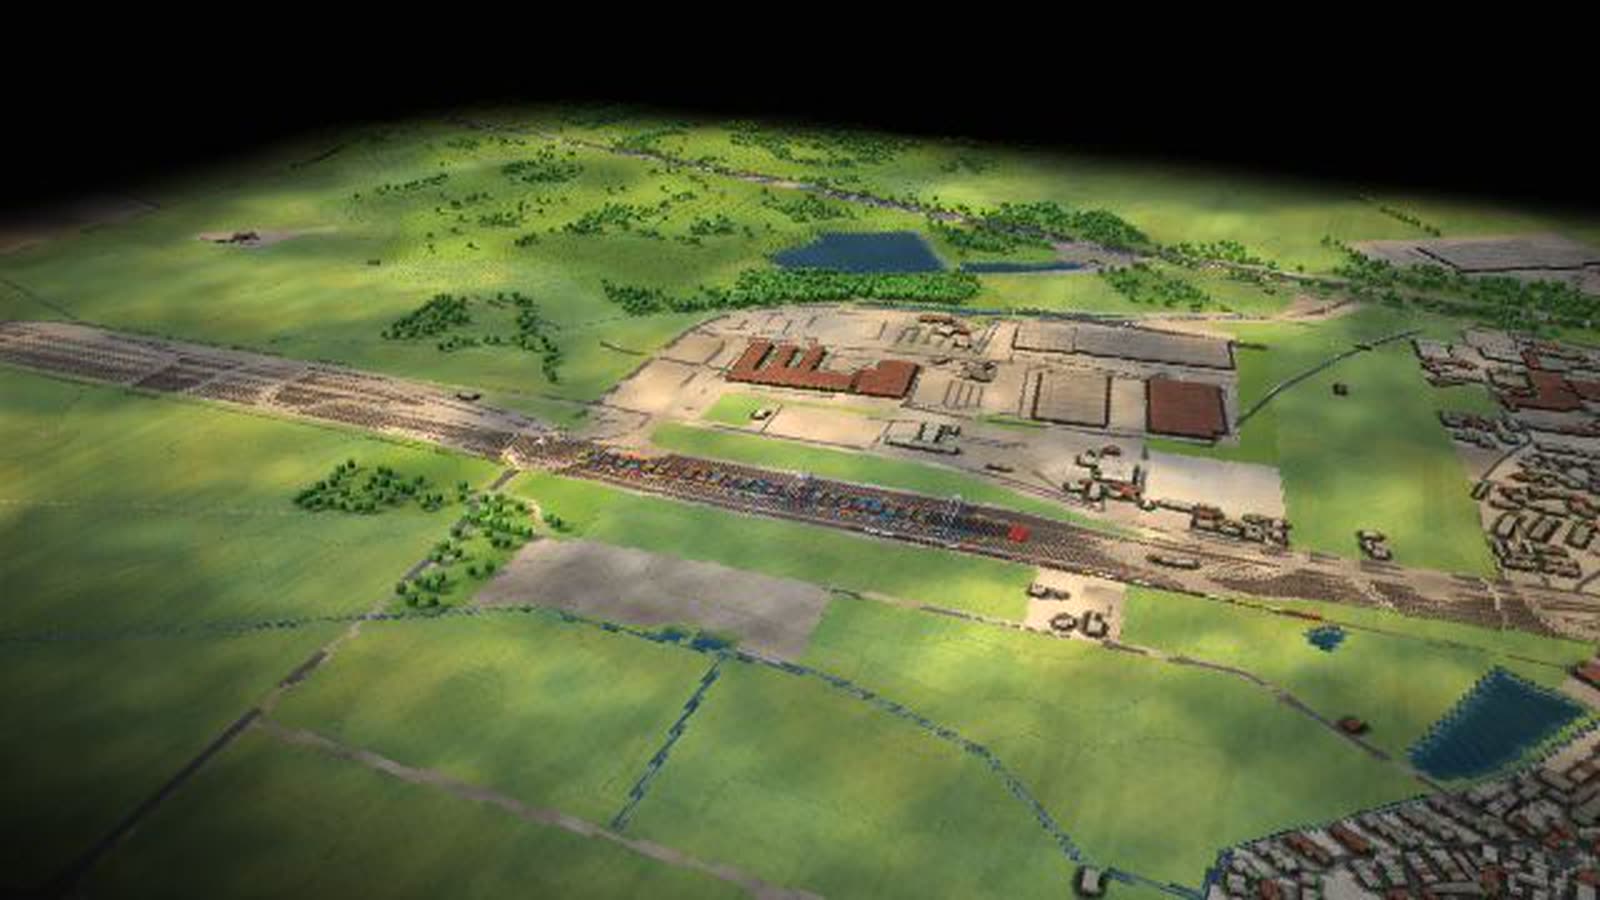
Frankfurt interchange (A3/A5)
One of Europe’s busiest motorway interchanges as a walkable model: the A3 and A5 cross, the weaving section becomes the bottleneck, and the tailback grows with freight, holidays or snow.
-
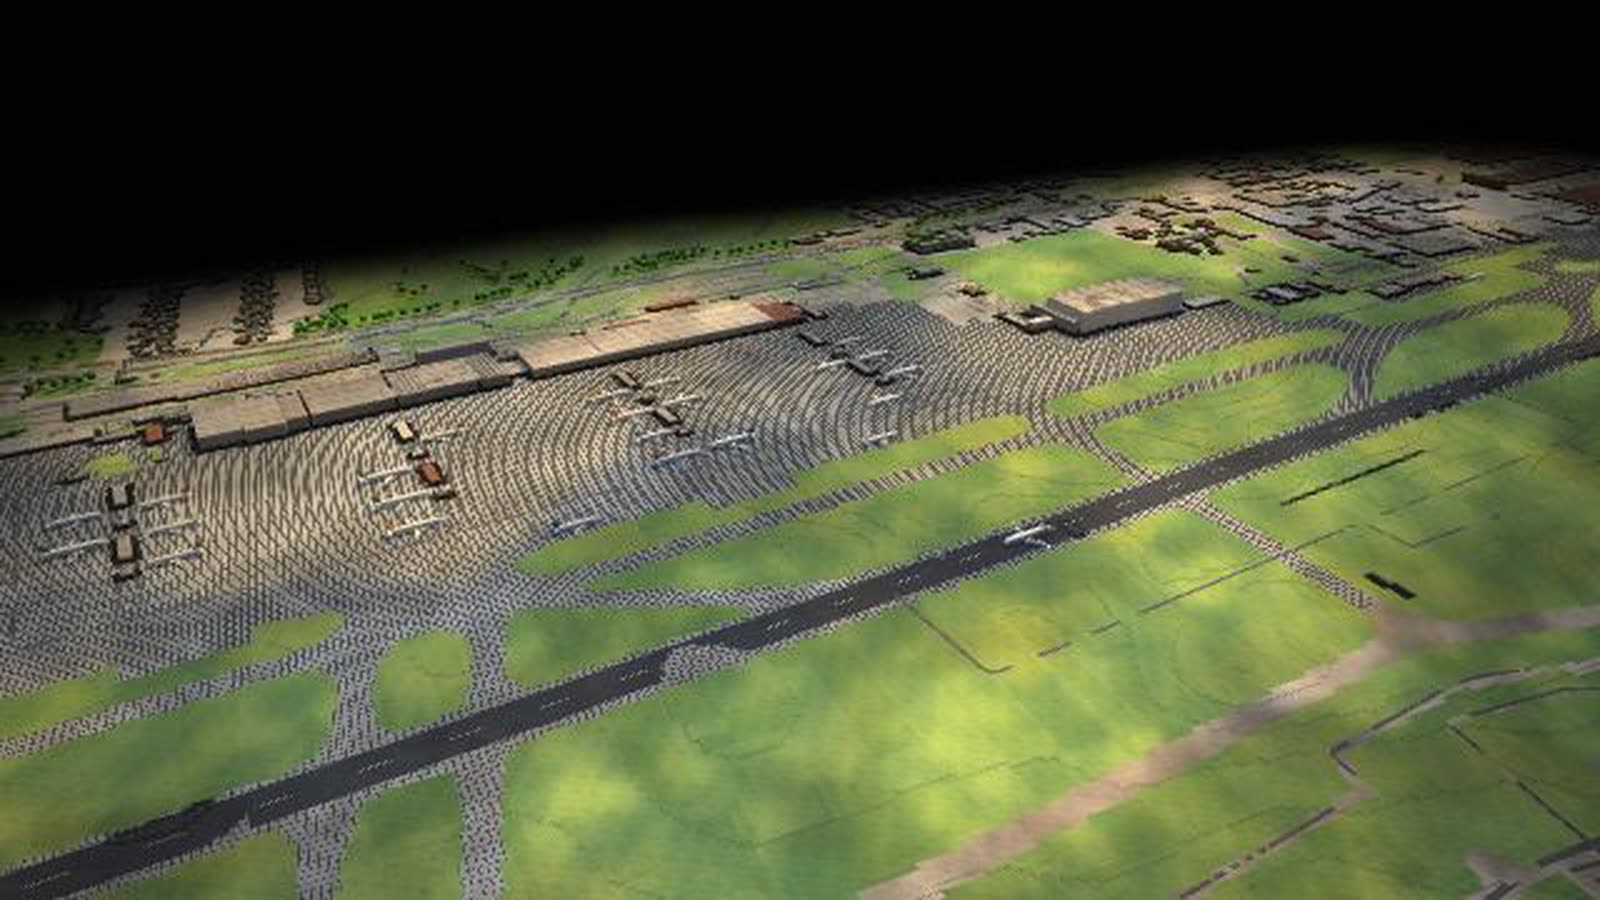
Leipzig/Halle · air cargo hub
A night hub for air cargo as a walkable model: about 60 freighters a night on the 3,600-m south runway, the apron, the sorting halls and the A14 at the Schkeuditz interchange.
-
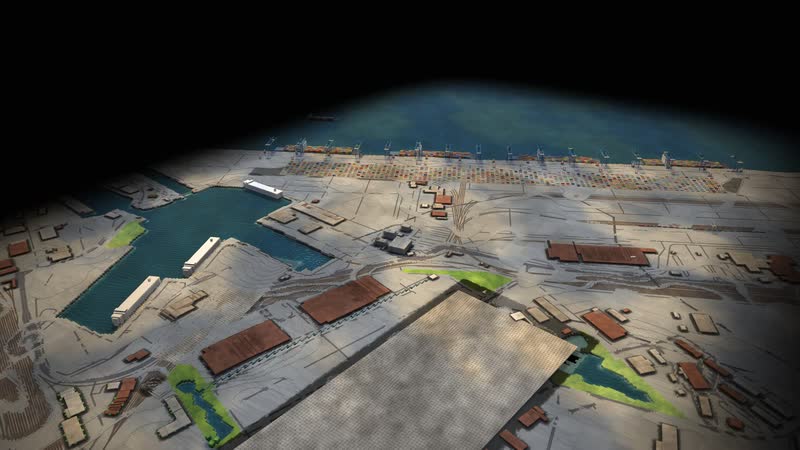
Bremerhaven · car terminal and river quay
Bremerhaven as a walkable model: almost five kilometres of river quay for the largest container ships, straddle carriers, car trains and parking for about 95,000 vehicles at the mouth of the Weser.
-
Wilhelmshaven · JadeWeserPort and LNG terminal
Germany’s only deep-water port as a walkable model: the container quay on the Jade with straddle carriers and rail, plus the floating LNG terminal, a tank farm and the crude-oil pipeline to the refineries.
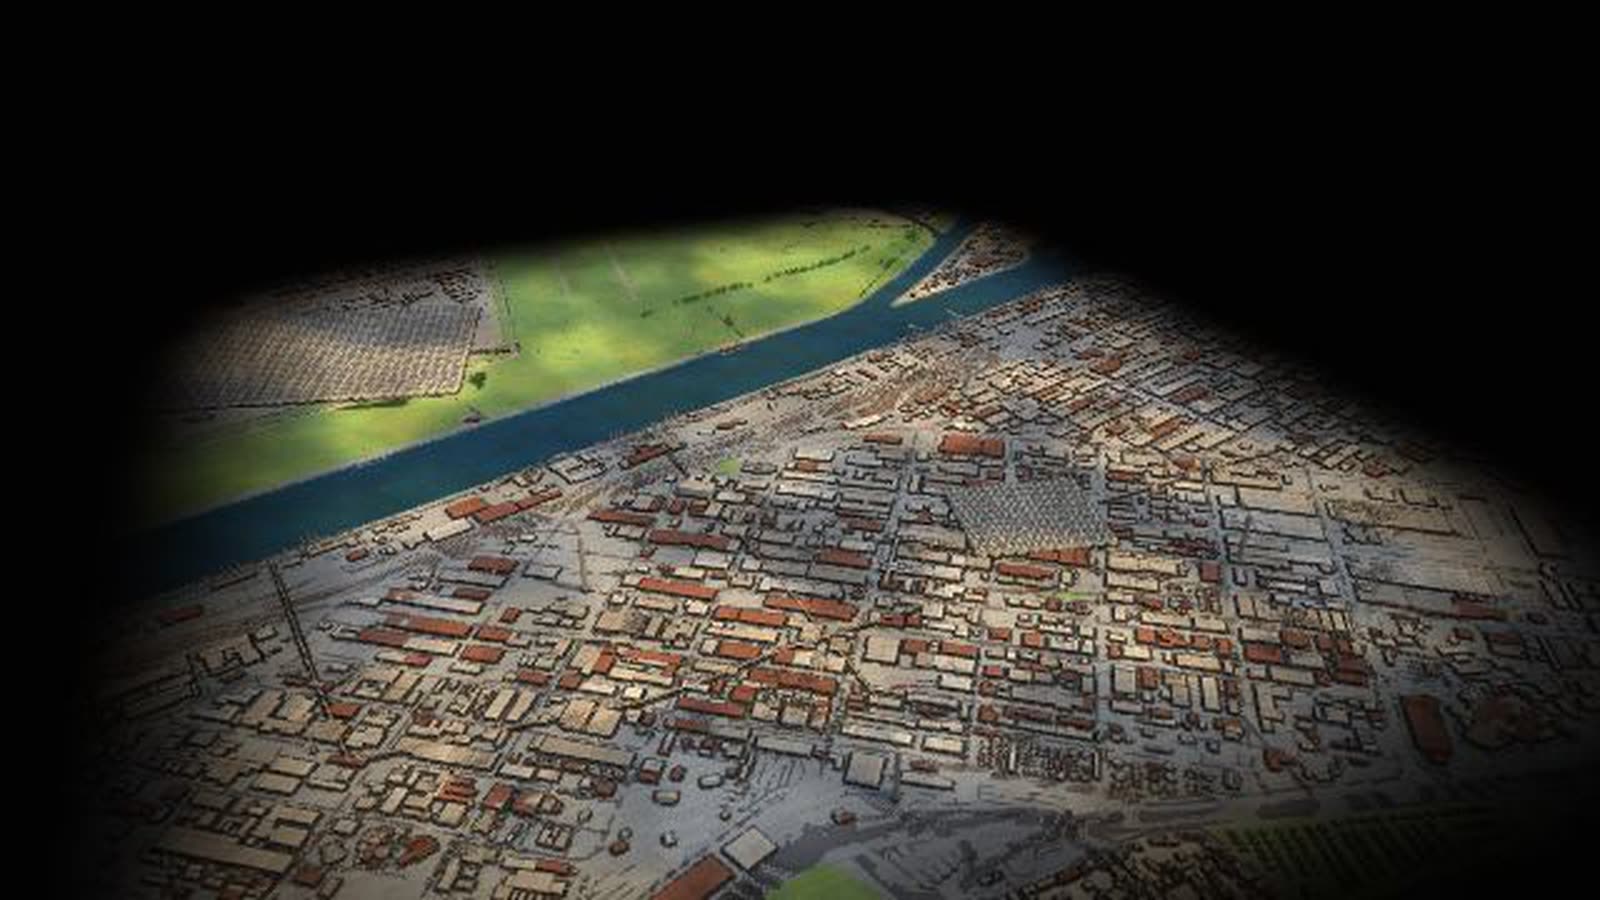
Real are the 27 node positions, road, rail and water routes (OpenStreetMap), official comparison figures (Federal Statistical Office 2024) and the CO₂ factors (German Environment Agency). Volumes of the 55 large flows are model assumptions. With your data, the map shows your flows and bottlenecks.