
Simulazione · Minimal Organization · City, health, knowledge, construction
University hospital
A university hospital as a walkable model: see where an emergency patient's time goes and why the strongest lever sits on the wards.
Trailer
KLINIKUM WESTERBRÜCK is invented; triage mix, admission rate and length of stay are assumptions. With your hospital's data the model shows what is scattered today – such as actual arrivals per hour and triage level, or discharge times per ward.
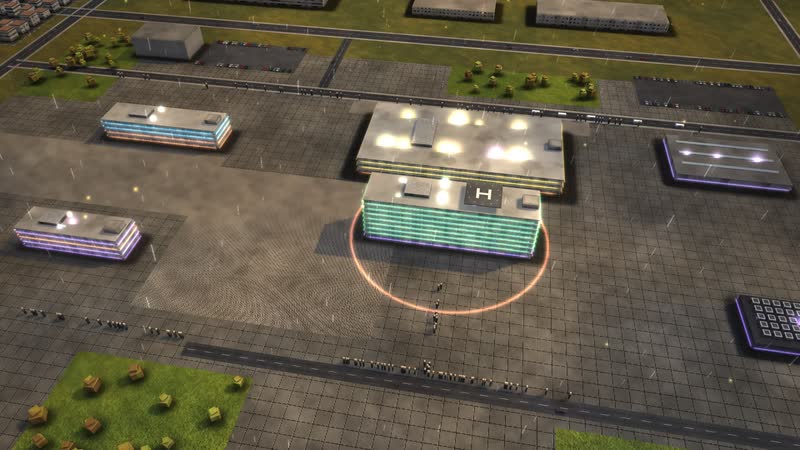
This hospital patient flow simulation follows the emergency department of KLINIKUM WESTERBRÜCK, a fictional university hospital. Emergencies, operations and research share beds, theatres and labs – around the clock. Without a staffed bed available, a patient stays in the ED.
The path of an emergency: registration, five-level triage, doctor contact, lab and CT in parallel, results and decision, then bed search, ward, discharge planning and billing with the health insurer. As its target the model uses the UK benchmark of under four hours in the ED; Germany has no statutory target time for this.
With ‘Discharge by 11 am’, beds become available earlier in the day and waiting in the ED drops. If nurses are missing, minimum staffing rules force beds to close. The model shows processes, not medical recommendations. The page is for the board, nursing and medical directors, bed management and education.
An emergency is treated
- 01
ED registration: A patient arrives at the emergency department – walking in or by ambulance. Registration records the details.
- 02
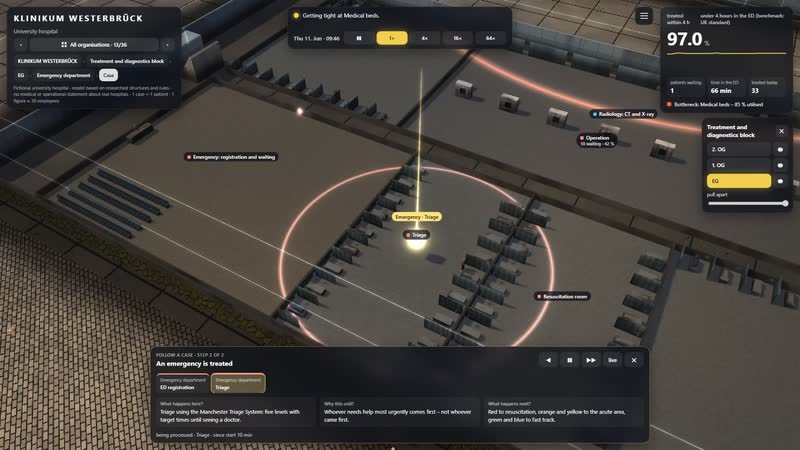
Triage: Triage using the Manchester Triage System: five levels with target times until seeing a doctor.
- 03
Resuscitation room: A team treats the life-threatening case immediately.
- 04
Acute area: doctor: A doctor examines and orders lab tests and imaging.
- 05
Blood goes to the lab while a CT or X-ray is taken.
- 06
Central lab: The central lab measures blood values, e.g. a cardiac marker.
- 07
CT and X-ray: Radiology takes a CT or X-ray.
- 08
Both results are in.
- 09
Findings and decision: With the results the team decides: admit, straight to the catheter lab, or home.
- 10
Fast track: Minor cases are treated quickly in a separate area.
- 11
Again: CT and X-ray: An X-ray checks e.g. for a fracture.
- 12
Cardiac catheter: Heart attack: the blocked vessel is reopened in the catheter lab.
- 13
Bed allocation: The bed management centre looks for a free bed in the right clinic.
- 14
Surgical beds: Surgical ward: nursing, rounds, treatment.
- 15
Medical beds: Medical ward: nursing, rounds, treatment.
- 16
Neurology beds: Neurology ward, e.g. after a stroke.
- 17
ICU beds: Intensive care: monitored around the clock, often ventilated.
- 18
Again: Bed allocation: Bed management finds a bed on a normal ward.
- 19
Discharge management: Discharge management plans the transition: medication, discharge letter, rehab or care.
- 20
Handover to rehab or care home: A rehabilitation clinic or care home takes over.
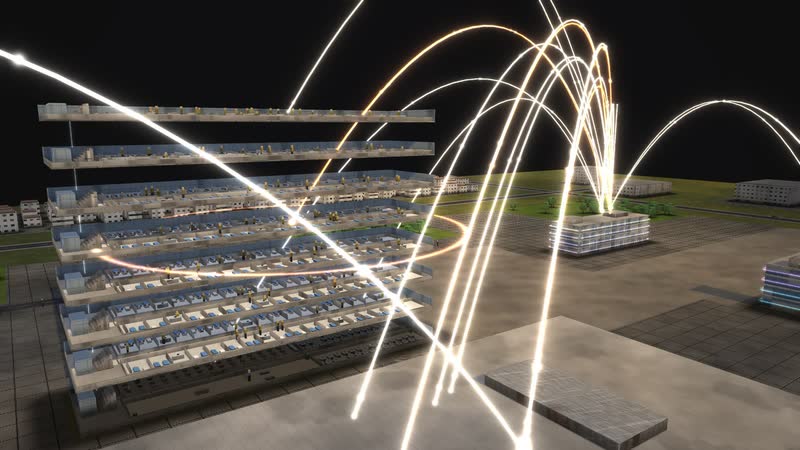
01
A site at work
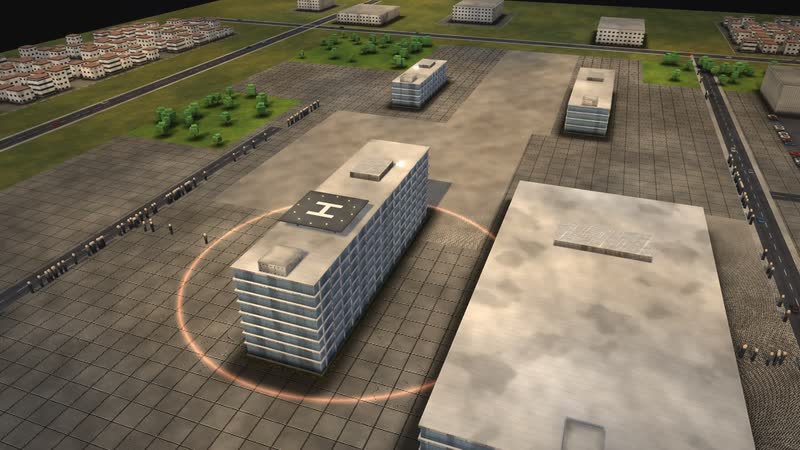
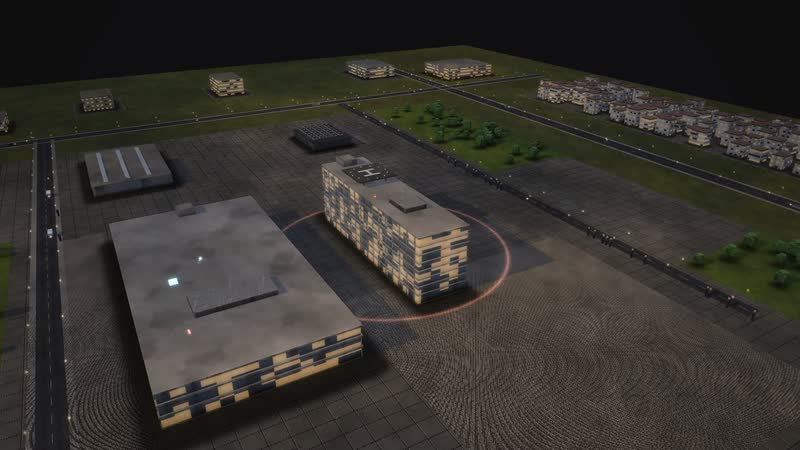
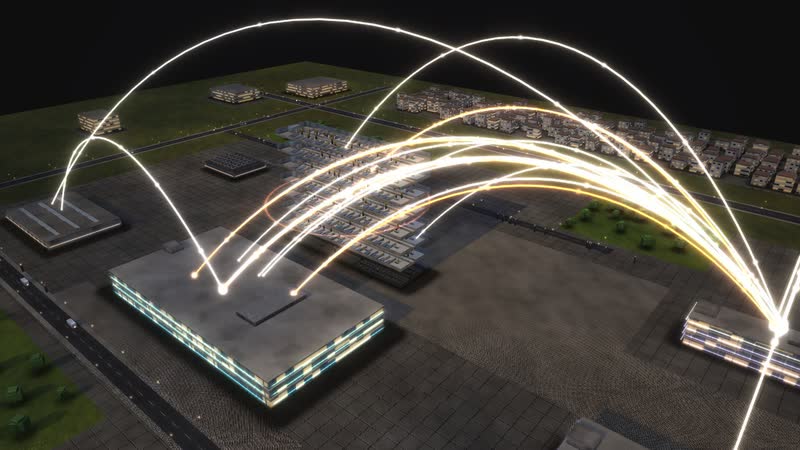
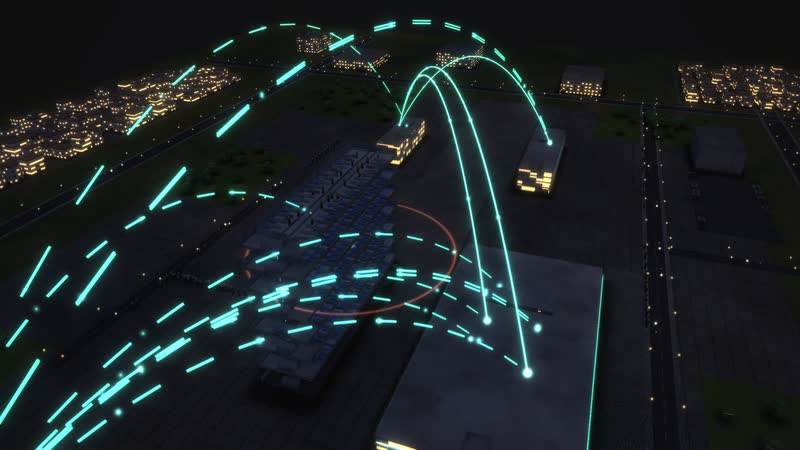
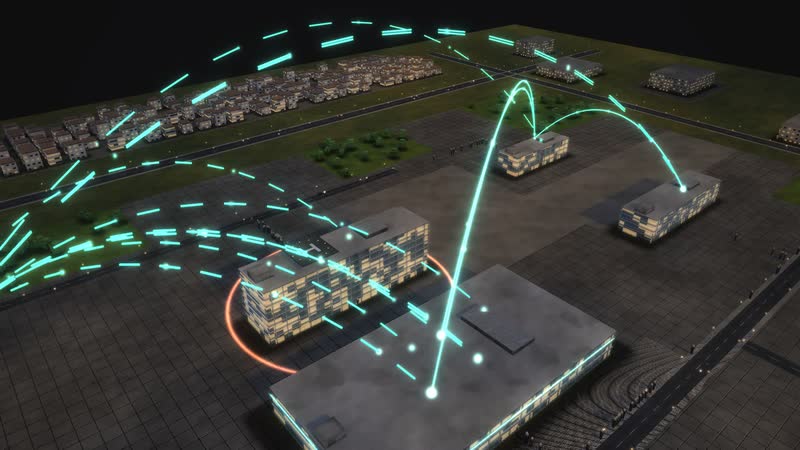
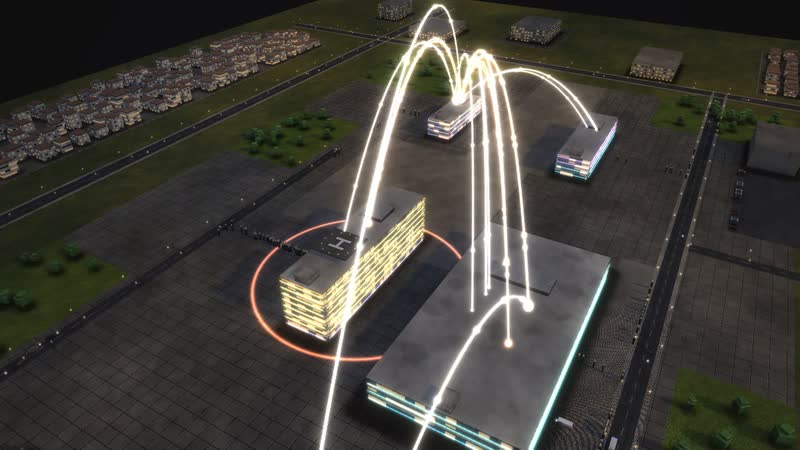
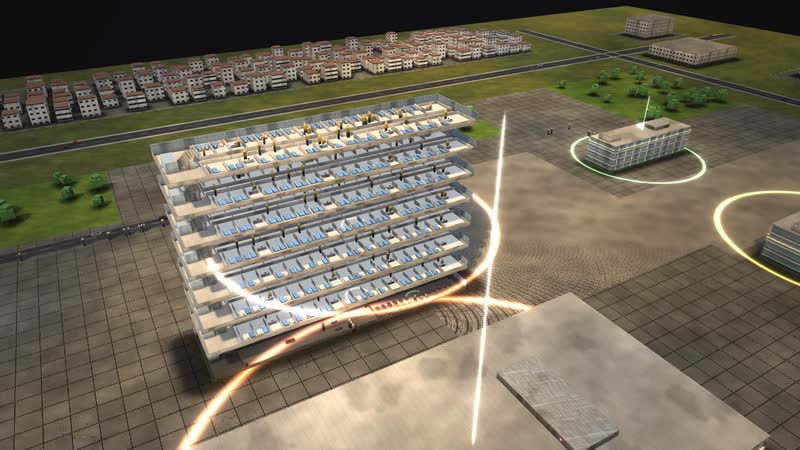
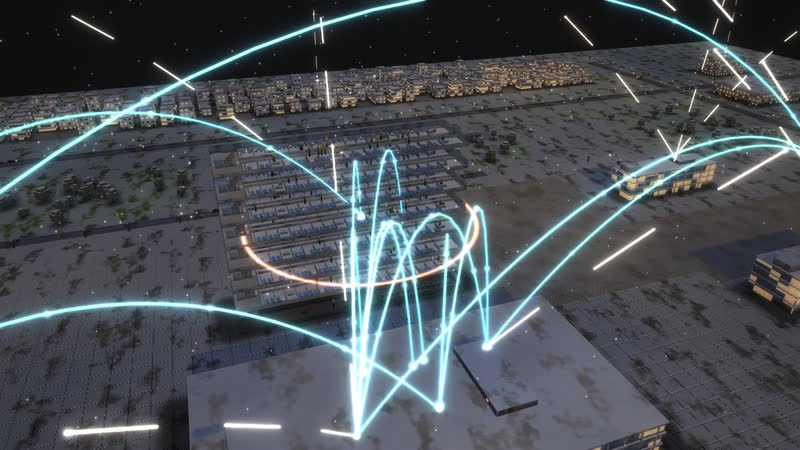
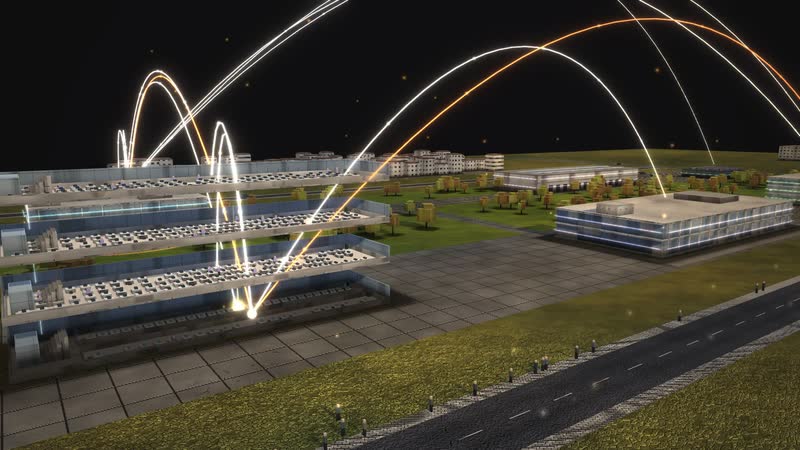
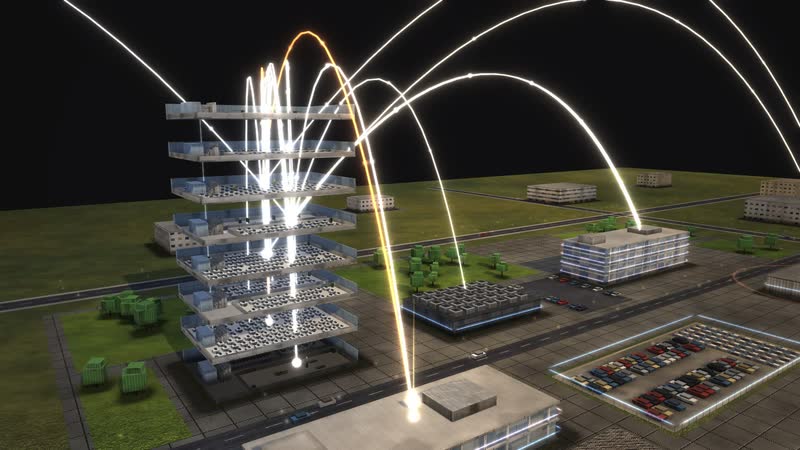
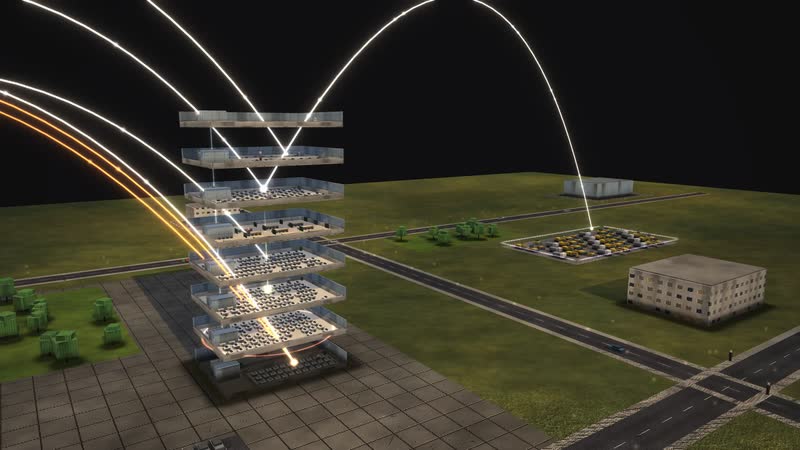
6 buildings, 22 departments, about 7,400 staff: in the evening light golden arcs show who reports to whom.
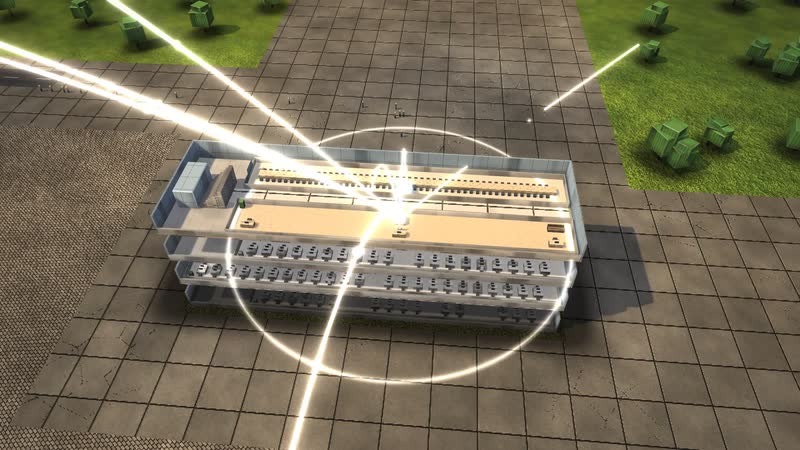
02
Every floor opened up
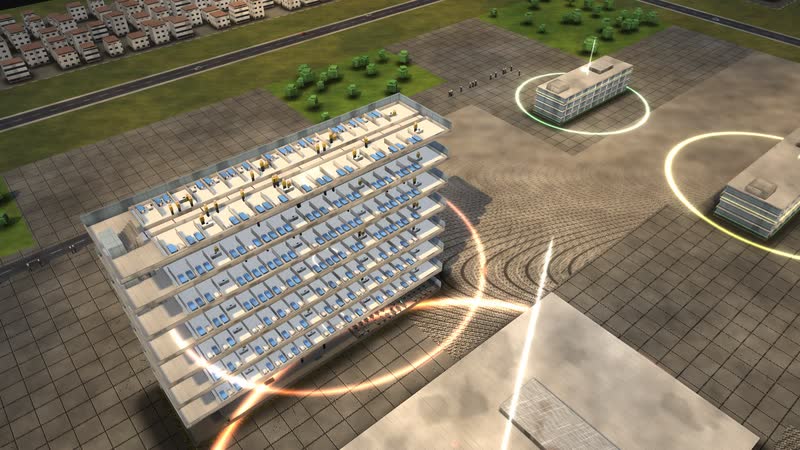
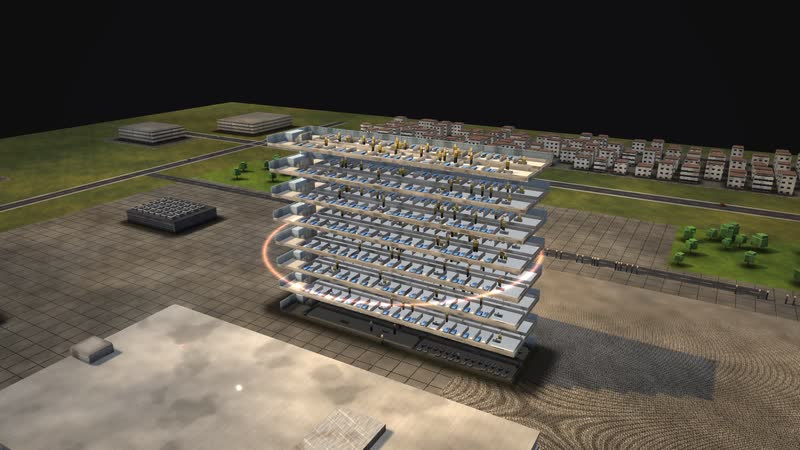
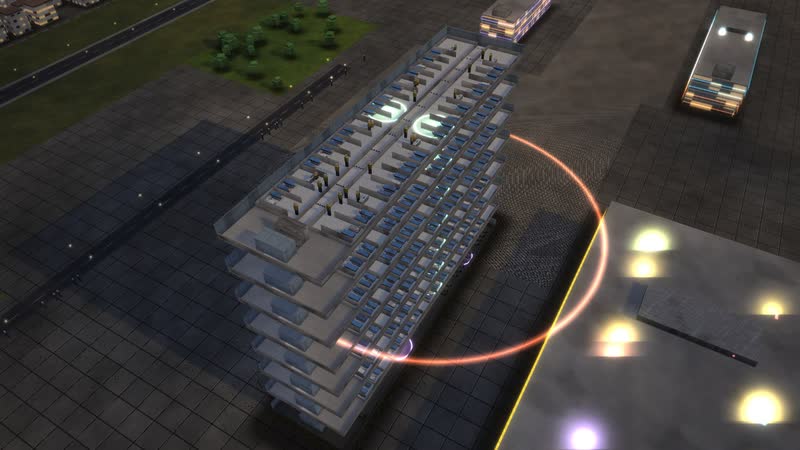
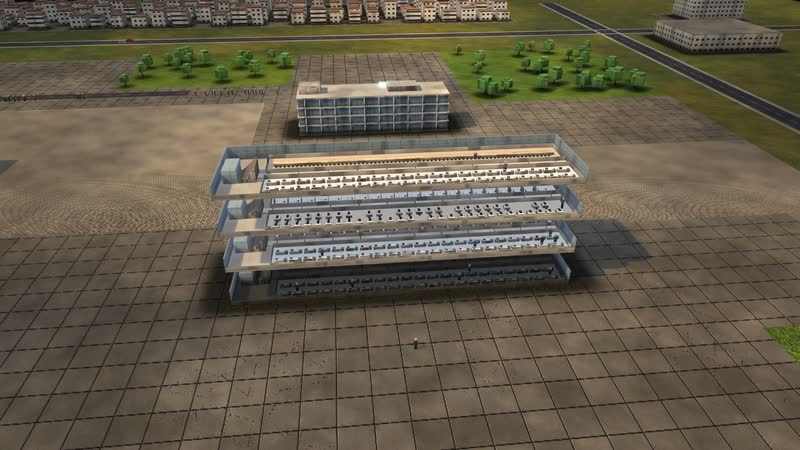
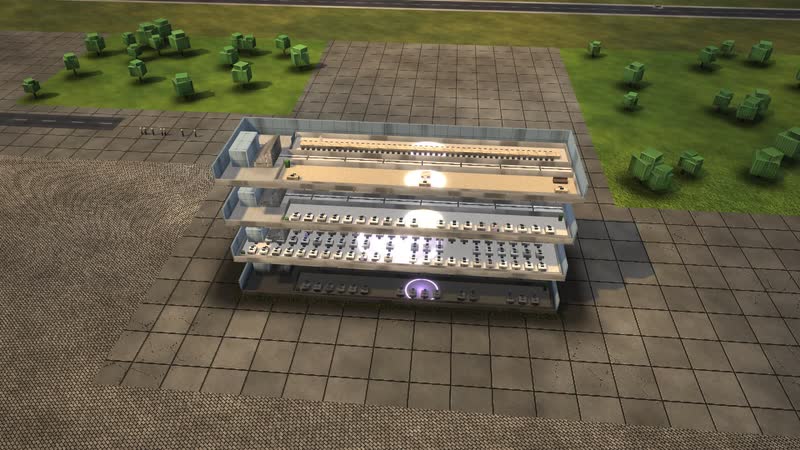
Every building can be opened, floor by floor – right into single rooms such as ‘Executive board’, with workplaces and people at work.
What is shown – why – for whom
| Cosa viene mostrato | Perché | Per chi |
|---|---|---|
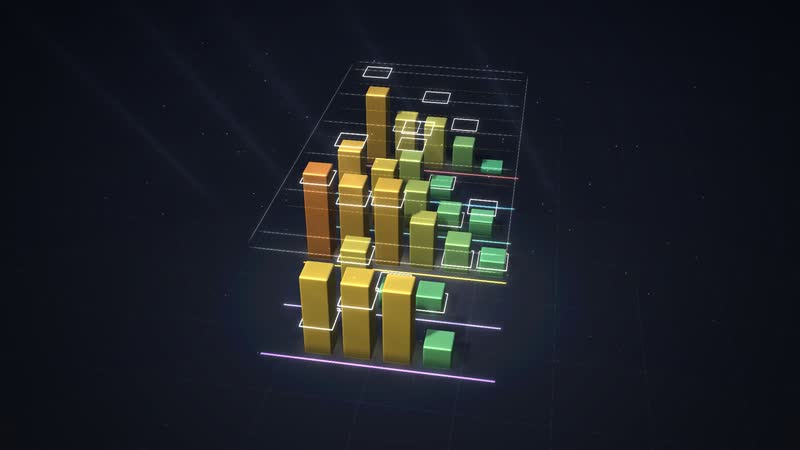
| Diagram ‘What each control does’: discharge by 11 am, staffed beds, doctors, triage | Perchéshows that the strongest lever lies on the wards | Per chiBoard, nursing director, medical director |
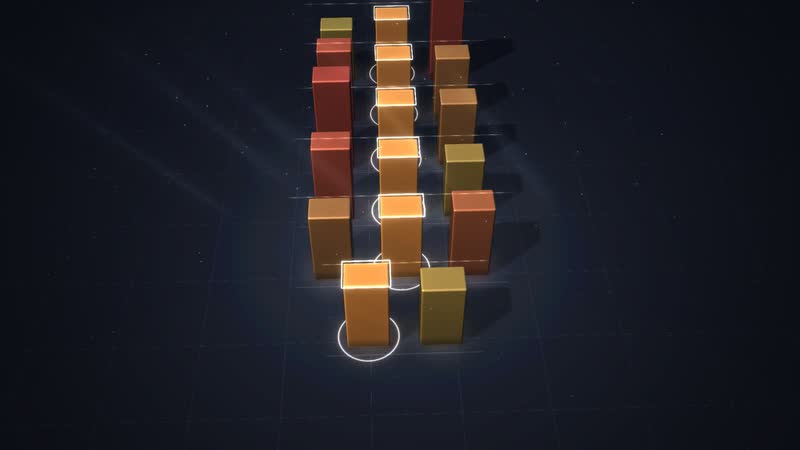
| Diagram ‘Where the time goes’ in the ED | Perchéseparates treatment from waiting for a bed | Per chiED management, bed management |
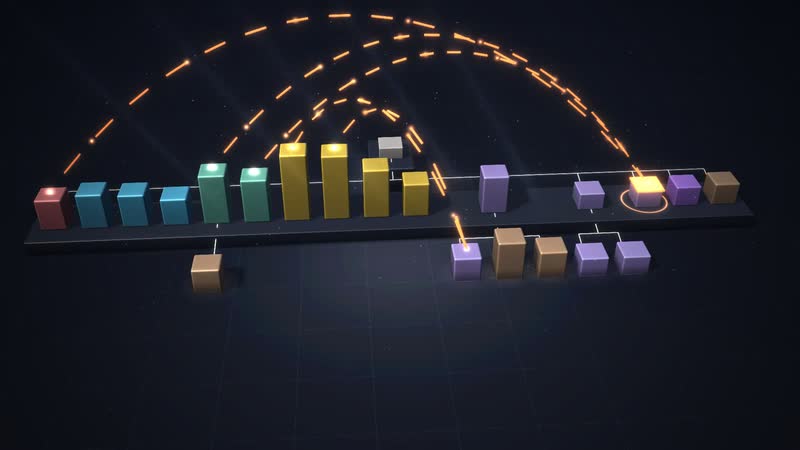
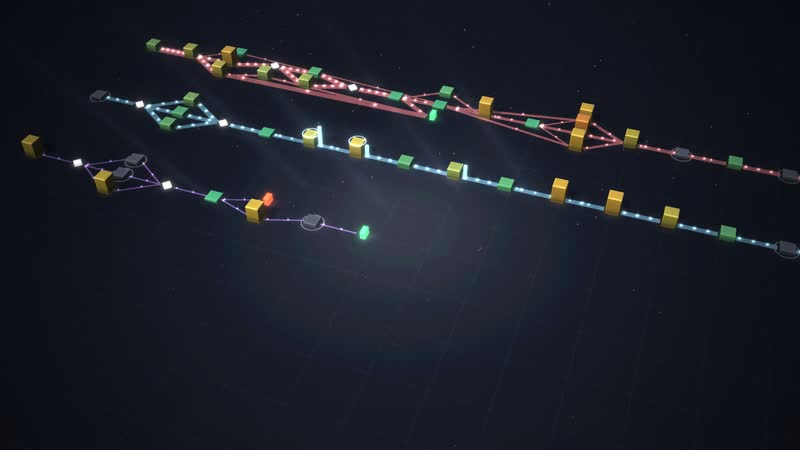
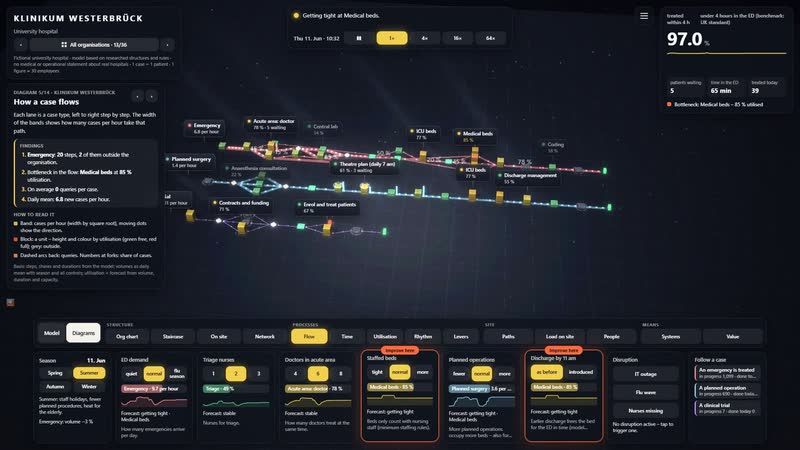
| Diagram ‘How a case flows’: resuscitation room, fast track, cath lab, wards | Perchéshows the paths of an emergency | Per chiEducation, ambulance service |
| Diagram ‘Where it gets tight’ when nurses are missing | Perchéshows closed beds and the backlog | Per chiNursing directorate, workforce planning |
| Diagram ‘Where the site gets tight’: ED and ward tower | Perchéshows the load in the buildings | Per chiBuilding and site planning |
| Resources view: patients waiting in the ED | Perchémakes visible who is waiting for a bed | Per chiED management, the public |
| Process ‘A planned operation’ next to the emergency | Perchéshows the competition for beds and theatres | Per chiTheatre management |
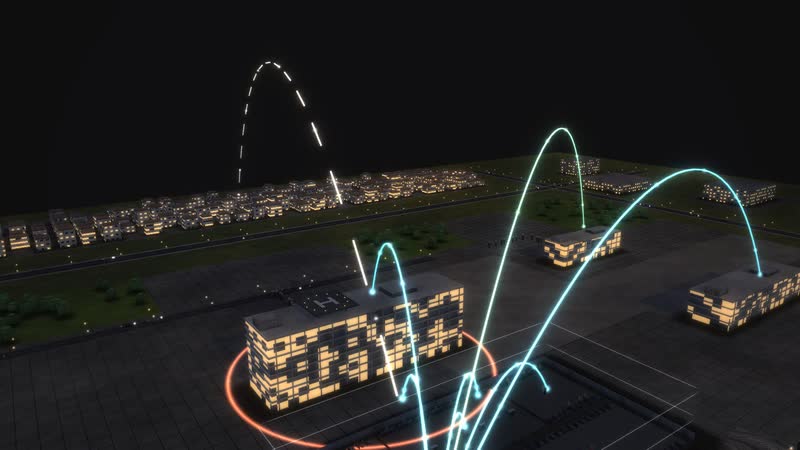
03
Who works with whom
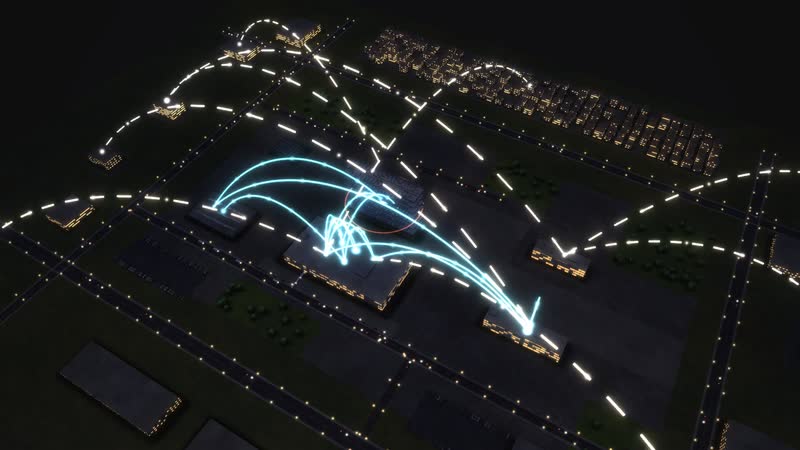
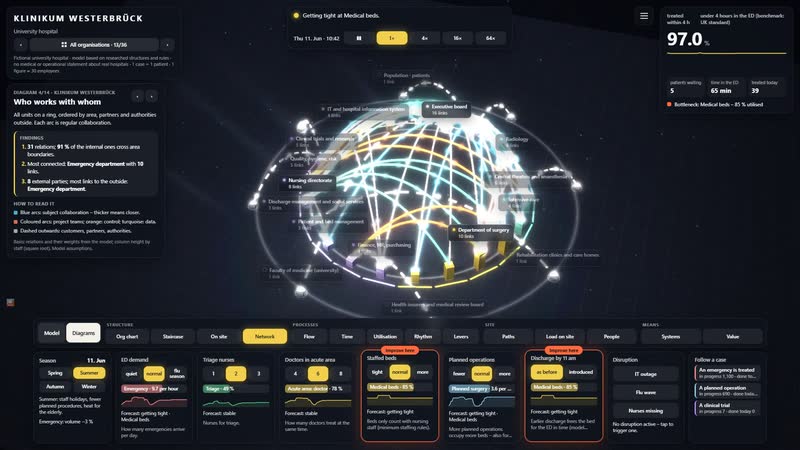
‘Emergency department’ with all 10 relations: Quality, hygiene, risk, Patient and bed management, Radiology, Central laboratory, Cardiology, Department of internal medicine and Department of surgery – and outside Ambulance service (fire and rescue station) and Population · patients.
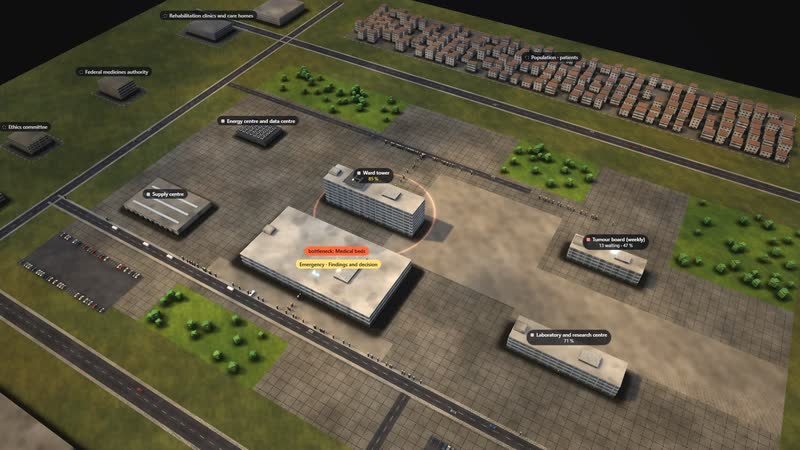
04
An emergency is treated
A single case can be followed – step by step, with the waiting time at every station. Target: under 4 hours in the ED (benchmark: UK standard).
Films from the model
-
The tower opens up
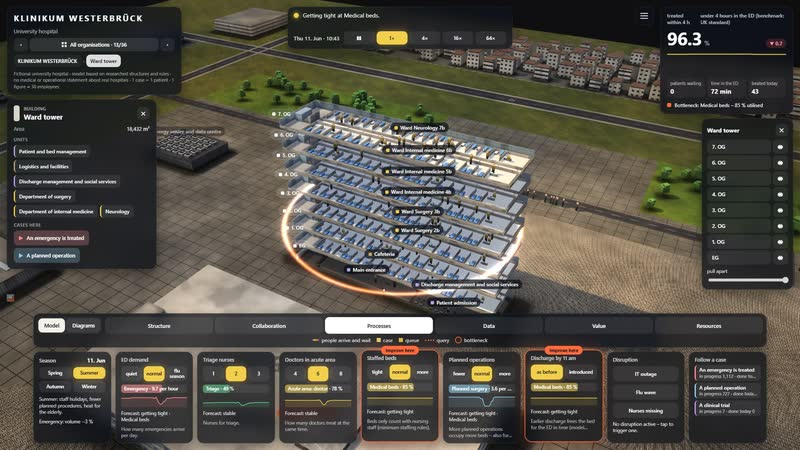
Just before sunset the floors drift apart – ‘Ward tower’ opens up as the camera rises and circles the building until night falls.
-
Who reports to whom, who works with whom
Blue hour above the site: first the golden arcs of the structure, then the collaboration of the most connected department, finally the whole building.
-
A day in time-lapse
From ten in the morning to midnight in 26 seconds: the sun moves, the windows light up, at night the data lines glow.
-
Surge and disruption
In time-lapse: ‘Flu wave’ brings more work, then ‘IT outage’. The control ‘Triage nurses’ set to ‘3’ brings recovery.
-
Seven diagrams
Calculated live from the model: ‘Who works with whom’, ‘Year, week, day’, ‘Management levels as a staircase’, ‘How a case flows’, ‘What each control does’, ‘What the work depends on’, ‘Where it gets tight’.
-
Using the software
With the full interface: open a building, a department’s relations, ‘Flu wave’, a control, diagrams with their panel, one case.
Departments in the model
-
Executive board
Medical director (chair), commercial director, nursing director and the dean of the faculty run the hospital together.
-
Nursing directorate
Leads nursing professionally across all clinics – across the medical line (matrix).
-
Finance, HR, purchasing
Plans budget, staff and purchasing; negotiates with insurers.
-
Quality, hygiene, risk
Monitors infections, incidents and quality indicators and reports to the authorities.
-
IT and hospital information system
Runs patient record, lab and radiology systems around the clock. Hospitals above a size are critical infrastructure.
-
Patient and bed management
Admits patients and allocates beds – this decides whether emergencies wait in the ED for a bed.
-
Emergency department
Accepts every emergency, triages urgency in five levels and treats until discharge or admission.
-
Radiology
CT, X-ray and MRI for emergencies and planned examinations.
-
Central laboratory
Analyses blood and samples; a cardiac marker is ready after about one hour (model assumption).
-
Pathology and microbiology
Examines tissue and pathogens, e.g. for the tumour board.
-
Central theatres and anaesthesia
Schedules theatres, anaesthetises, operates with the clinics and monitors in recovery.
-
Cardiology
Treats heart attacks in the catheter lab around the clock.
-
Intensive care
Cares for the most severe cases; a shortage here cancels planned operations.
-
Department of surgery
Operates electively and in emergencies; three floors of wards in the tower.
-
Department of internal medicine
Largest clinic: admits most emergencies.
-
Neurology
Strokes and other diseases of the nervous system.
-
Discharge management and social services
Plans the transition home, to rehabilitation or to a care home – required by law.
-
Medical controlling and billing
Codes diagnoses and procedures and bills insurers.
-
Pharmacy
Supplies all wards with medicines, including for trials.
-
Sterile services
Cleans and sterilises instruments for every theatre.
-
Logistics and facilities
Goods, meals, facilities, energy.
-
Clinical trials and research
Plans clinical trials, obtains approvals and looks after trial patients.
05
Flu wave
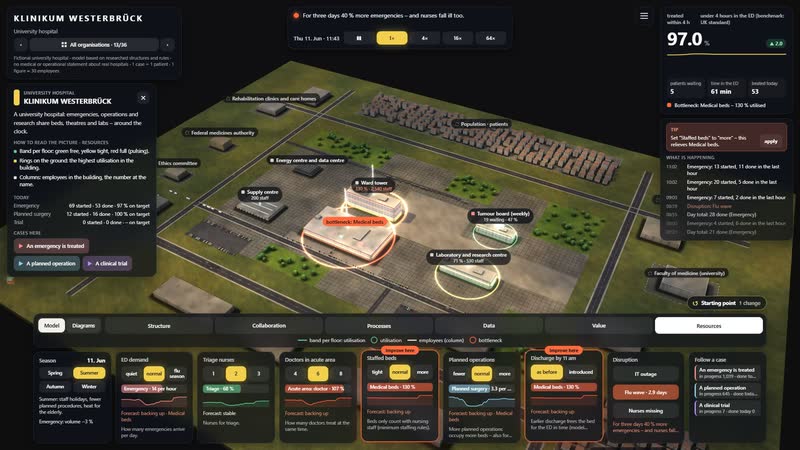
The backlog grows floor by floor – the simulation shows where it gets tight and which control helps.
06
A day in 26 seconds
From ten in the morning to midnight in time-lapse: commuters, moving light, windows switching on – and at night the data lines.
All processes in the model
An emergency is treated
- 01ED registration: A patient arrives at the emergency department – walking in or by ambulance. Registration records the details.
- 02Triage: Triage using the Manchester Triage System: five levels with target times until seeing a doctor.
- 03Resuscitation room: A team treats the life-threatening case immediately.
- 04Acute area: doctor: A doctor examines and orders lab tests and imaging.
- 05Blood goes to the lab while a CT or X-ray is taken.
- 06Central lab: The central lab measures blood values, e.g. a cardiac marker.
- 07CT and X-ray: Radiology takes a CT or X-ray.
- 08Both results are in.
- 09Findings and decision: With the results the team decides: admit, straight to the catheter lab, or home.
- 10Fast track: Minor cases are treated quickly in a separate area.
- 11Again: CT and X-ray: An X-ray checks e.g. for a fracture.
- 12Cardiac catheter: Heart attack: the blocked vessel is reopened in the catheter lab.
- 13Bed allocation: The bed management centre looks for a free bed in the right clinic.
- 14Surgical beds: Surgical ward: nursing, rounds, treatment.
- 15Medical beds: Medical ward: nursing, rounds, treatment.
- 16Neurology beds: Neurology ward, e.g. after a stroke.
- 17ICU beds: Intensive care: monitored around the clock, often ventilated.
- 18Again: Bed allocation: Bed management finds a bed on a normal ward.
- 19Discharge management: Discharge management plans the transition: medication, discharge letter, rehab or care.
- 20Handover to rehab or care home: A rehabilitation clinic or care home takes over.
A planned operation
- 01Referral and appointment: A GP refers the patient for surgery; the clinic gives an appointment.
- 02Pre-admission: examination, lab and anaesthesia consultation on one day.
- 03Pre-admission clinic: The surgeon examines and informs.
- 04Central lab: Blood tests before surgery.
- 05Anaesthesia consultation: Anaesthesia consultation.
- 06Preparation complete.
- 07Indication: For tumours one doctor does not decide alone.
- 08Tumour board (weekly): The tumour board meets once a week.
- 09Theatre plan (daily 7 am): Theatre management schedules the rooms for the next day.
- 10Patient admission: Admission on the morning of surgery.
- 11Operation: The operation: surgery and anaesthesia together in the central theatres.
- 12Recovery room: Monitoring in recovery.
- 13ICU beds: Complication: monitoring in intensive care.
- 14Surgical beds: Surgical ward, mobilisation by physiotherapy.
- 15Discharge management: Discharge with letter, if needed rehab application.
- 16Coding: Coding the operation.
- 17Billing the insurer: The insurer pays.
- 18Complete.
A clinical trial
- 01Trial planning: A clinic has a research question; the trial unit checks feasibility and budget.
- 02Authority and ethics committee assess at the same time; contracts run in parallel.
- 03Assessment federal authority: The federal authority assesses the trial.
- 04Assessment ethics committee: The ethics committee reviews benefit, risk and consent.
- 05Contracts and funding: Contracts, insurance, funding.
- 06All answers are in.
- 07Trial decision: Approved, with conditions, or rejected.
- 08Address conditions: The trial unit addresses the conditions.
- 09The trial is not approved.
- 10Enrol and treat patients: Patients are enrolled and treated in the trial clinic.
- 11Analysis and publication: The faculty analyses and publishes.
- 12Results published.
How a hospital can use the model
-
Internal communication
ED, diagnostics, theatres, intensive care, wards, administration and supply in one picture. The model links the backlog in the ED to the beds on the wards – a common starting point for every profession.
Per chiBoard, nursing and medical directors, communications
-
Onboarding
New doctors and nurses follow an emergency from the entrance to the ward and see which department takes over when. The eight-step tour explains the controls on the first visit.
Per chiNew staff in the ED, on the wards and in patient management
-
Training
Nursing students, medical students and paramedics trigger a flu wave or an IT outage and see how an emergency's paths branch: resuscitation room, fast track, cardiac cath lab, intensive care or general ward.
Per chiNursing education, medical school, ambulance service
-
Explaining to patients
‘Where the time goes’ separates treatment from waiting for a bed. It helps explain to patients, relatives and the public why the ED can take time.
Per chiCorporate communications, patient representatives, the public
-
Strategic overview
Discharge by 11 am, staffed beds, doctors in the acute area, triage nurses and planned operations side by side: ‘What each control does’ shows where the strongest lever lies.
Per chiBoard, medical controlling, building and site planning
07
Diagrams from the model
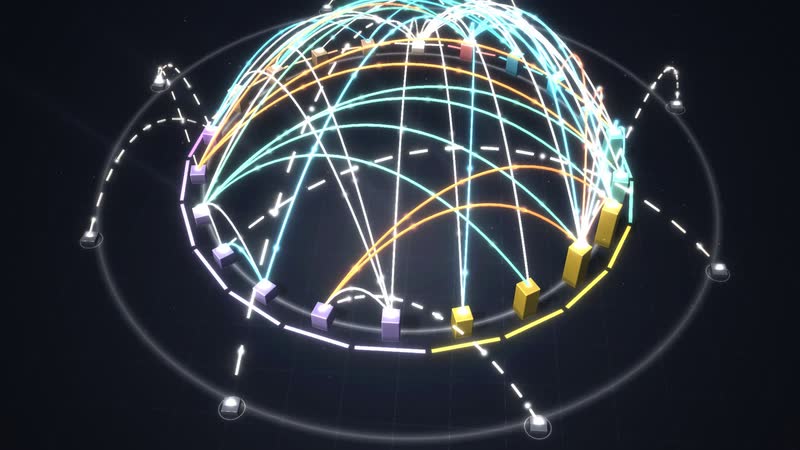
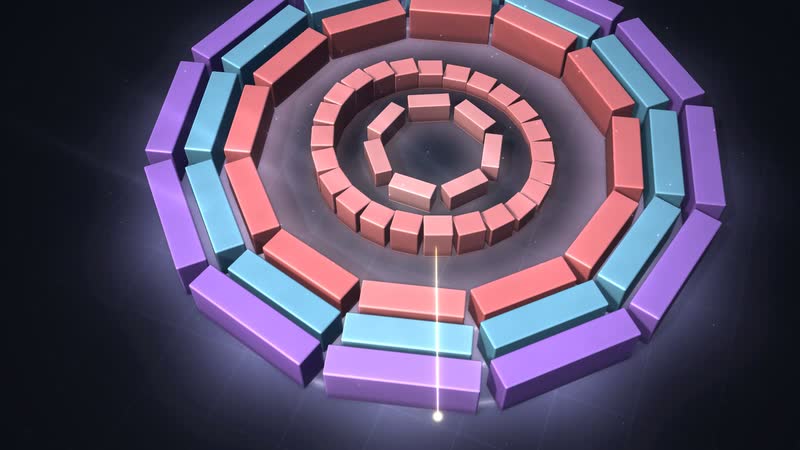
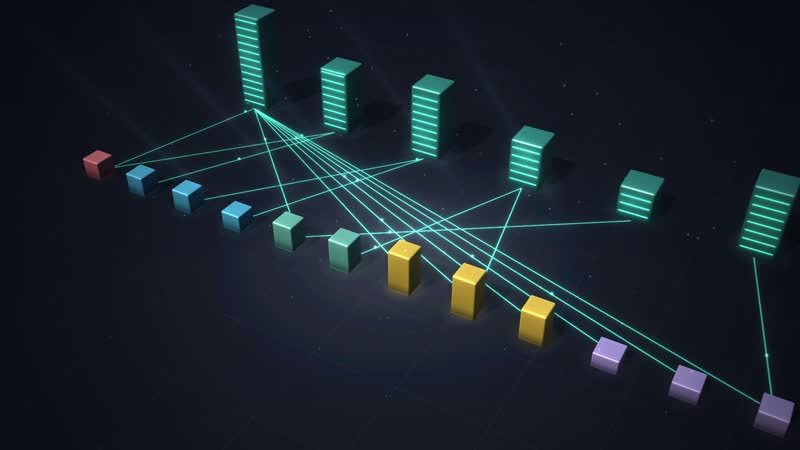
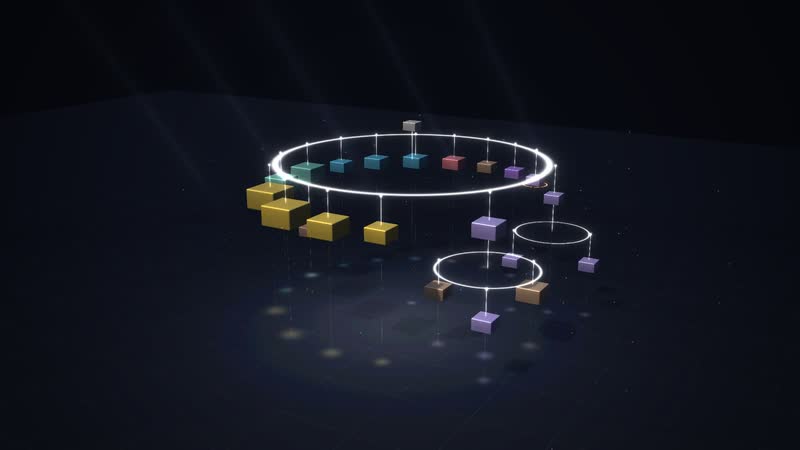
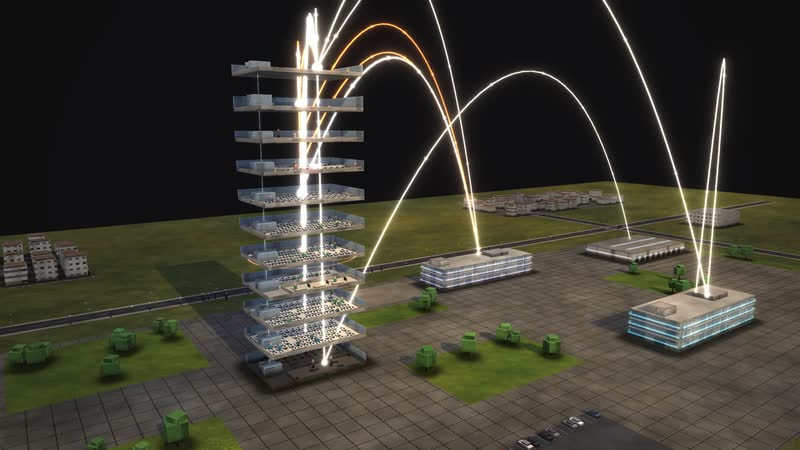
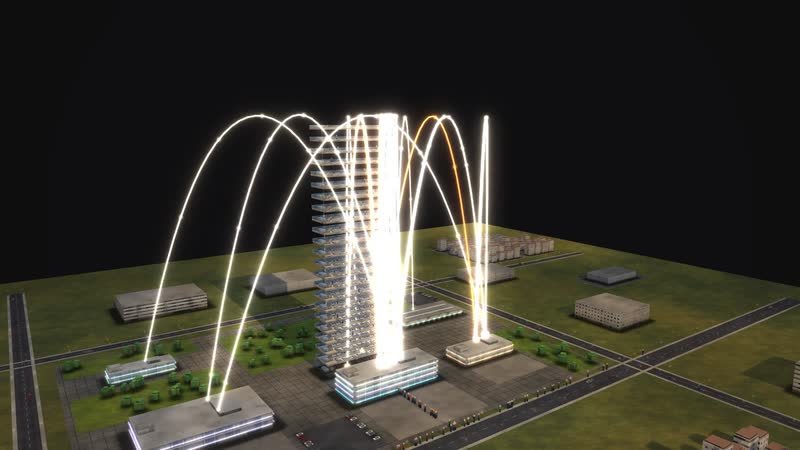
‘Who works with whom’ as a dome of arcs – one of 14 diagrams calculated live from the same data.
08
The whole software
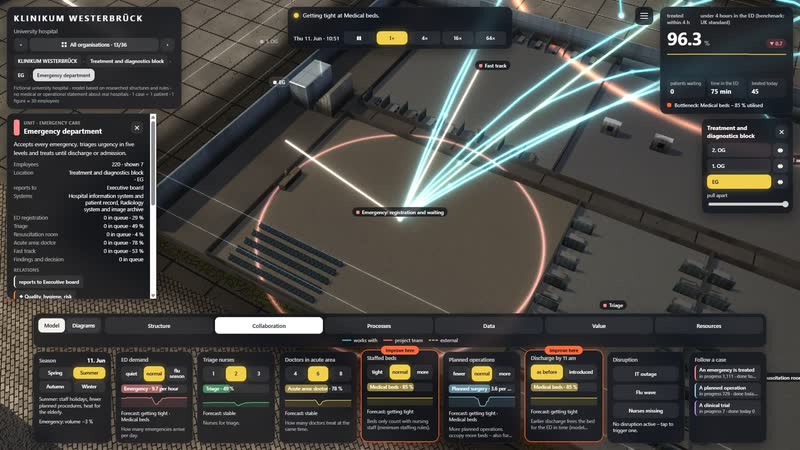
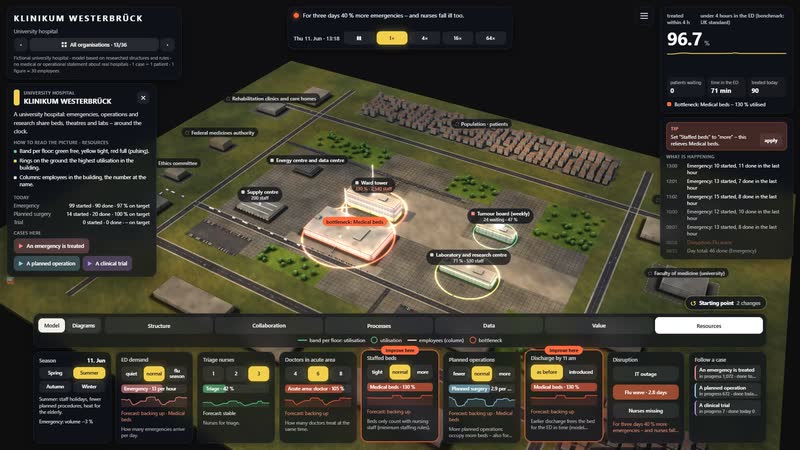
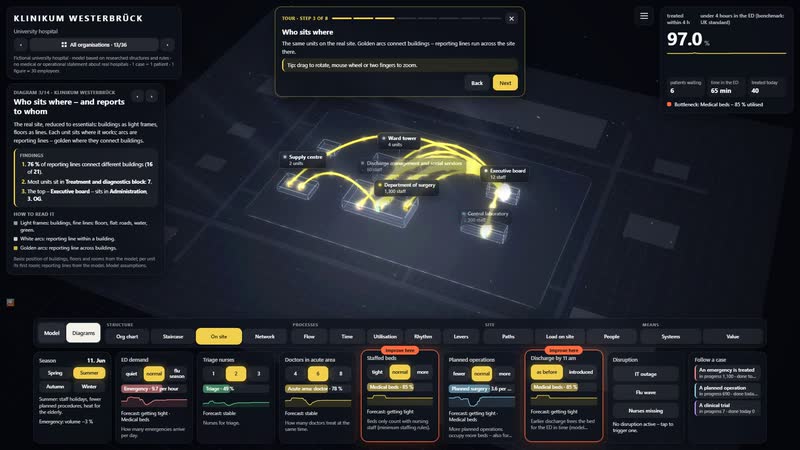
Situation, key figure, time-lapse, six views, controls and disruptions: one click on a department shows its task, location and all relations.
What you can change
Controls
- ED demand: How many emergencies arrive per day.
- Triage nurses: Nurses for triage.
- Doctors in acute area: How many doctors treat at the same time.
- Staffed beds: Beds only count with nursing staff (minimum staffing rules).
- Planned operations: More planned operations occupy more beds – also for emergencies.
- Discharge by 11 am: Earlier discharge frees the bed for the ED in time (model assumption: half a day shorter).
Disruptions
- IT outage: Six hours on paper: registration, results and bed allocation take more than twice as long.
- Flu wave: For three days 40 % more emergencies – and nurses fall ill too.
- Nurses missing: If nurses are missing, beds must be closed under minimum staffing rules – the ED backs up.
What the model gives a hospital
-
01
Cause, not symptom
The queue forms in the ED, the cause sits with the beds. The model shows this link live, ward by ward.
-
02
See decisions before making them
Discharge by 11 am, more staffed beds or fewer planned operations: every control acts at once on the running simulation and its diagrams.
-
03
One hospital, three processes
Emergency, planned surgery and clinical trial run side by side and share beds, theatres and labs, so the competition for resources becomes visible.
-
04
Disruptions without patients
An IT outage, a flu wave or missing nurses can be triggered and observed without affecting anyone.
-
05
For boardrooms and lecture halls
The simulation runs in the browser and can be projected onto large screens. A demo mode shows everything by itself, in a training session or in the lobby.
-
KLINIKUM WESTERBRÜCK in the morning – low sun, long shadows, the first commuters on their way in. -
Ward tower in evening light – golden arcs show who reports to whom. -
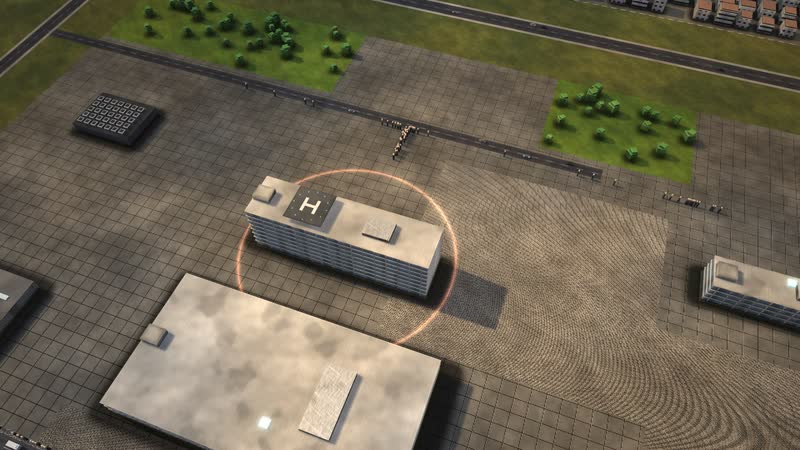
Just before eight – people stream from the car park and the street into the buildings. -
Blue hour – the windows of KLINIKUM WESTERBRÜCK light up. -
At night from above – Ward tower opened up, data lines glowing across the site. -
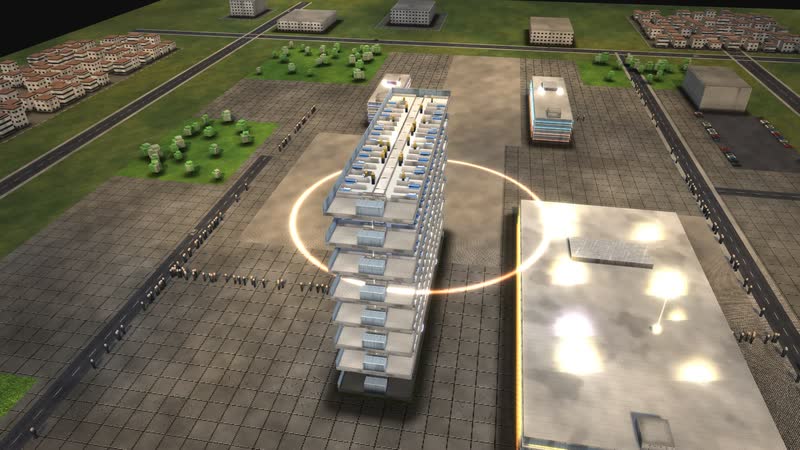
Ward tower opened up – every floor with workplaces and people. -
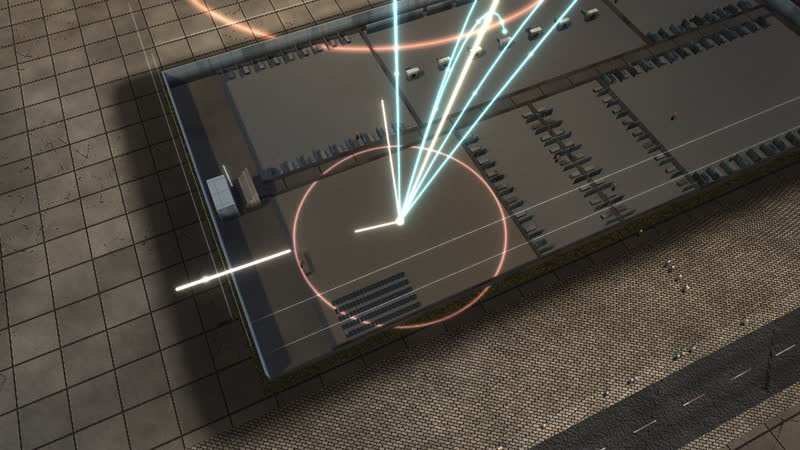
Dusk, performance view – rings of light show how busy each department is. -
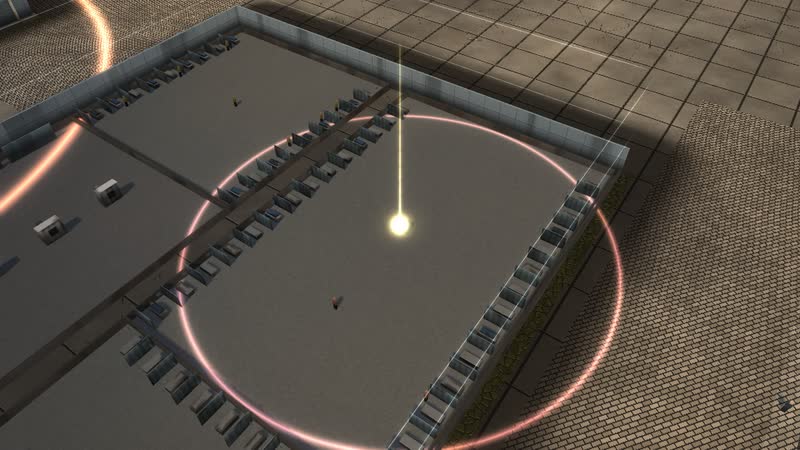
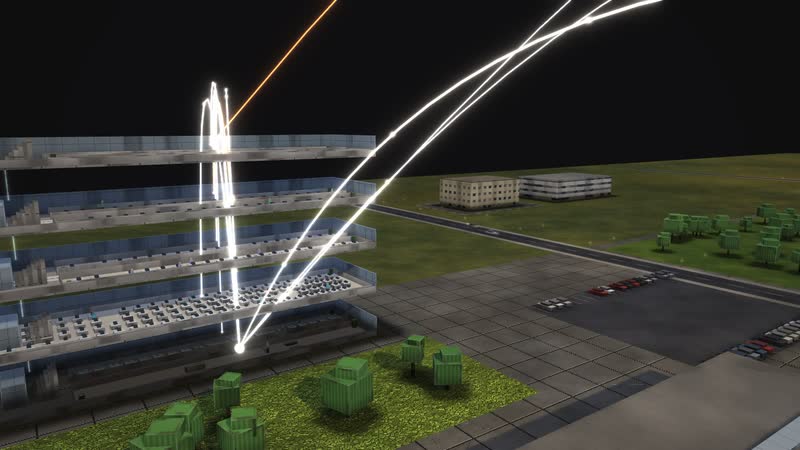
Looking into the floor of Emergency department – rows of desks, the floors above as outlines of light. -
A room of its own – Executive board. -
Laboratory and research centre opened up – every floor with workplaces and people. -
Administration – all floors at once, performance view. -
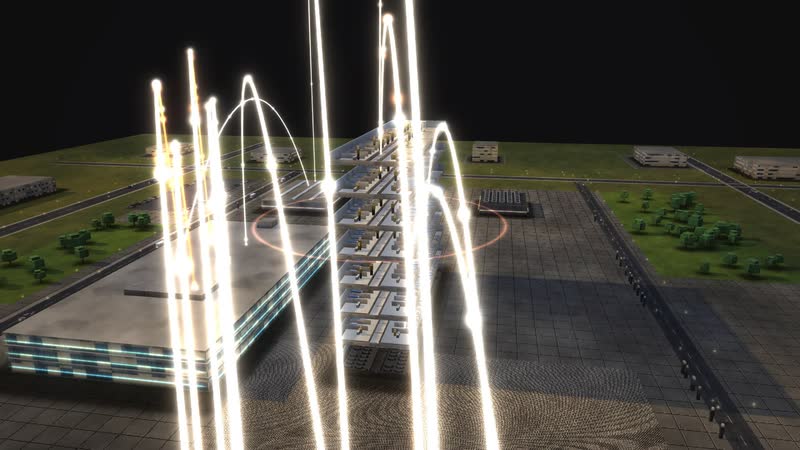
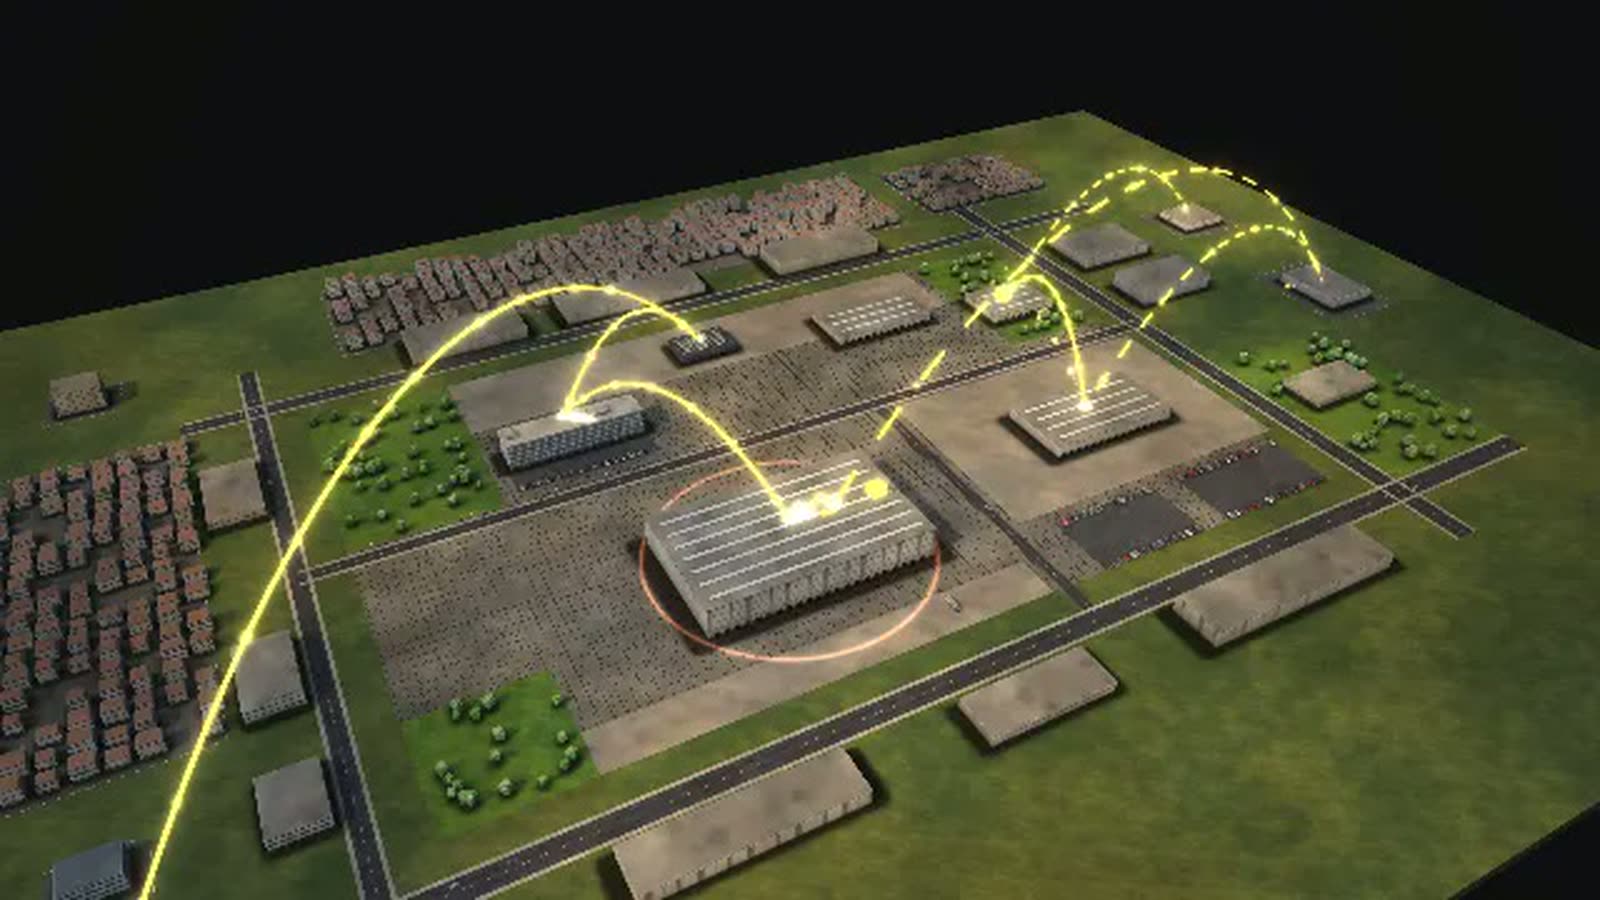
Structure at dusk – golden arcs from every floor to the buildings reporting to it. -
Collaboration – Emergency department with all 10 relations – to departments, buildings and partners. -
Data flows at night – systems and users linked by glowing lines. -
Data flows at dusk – which department uses which system. -
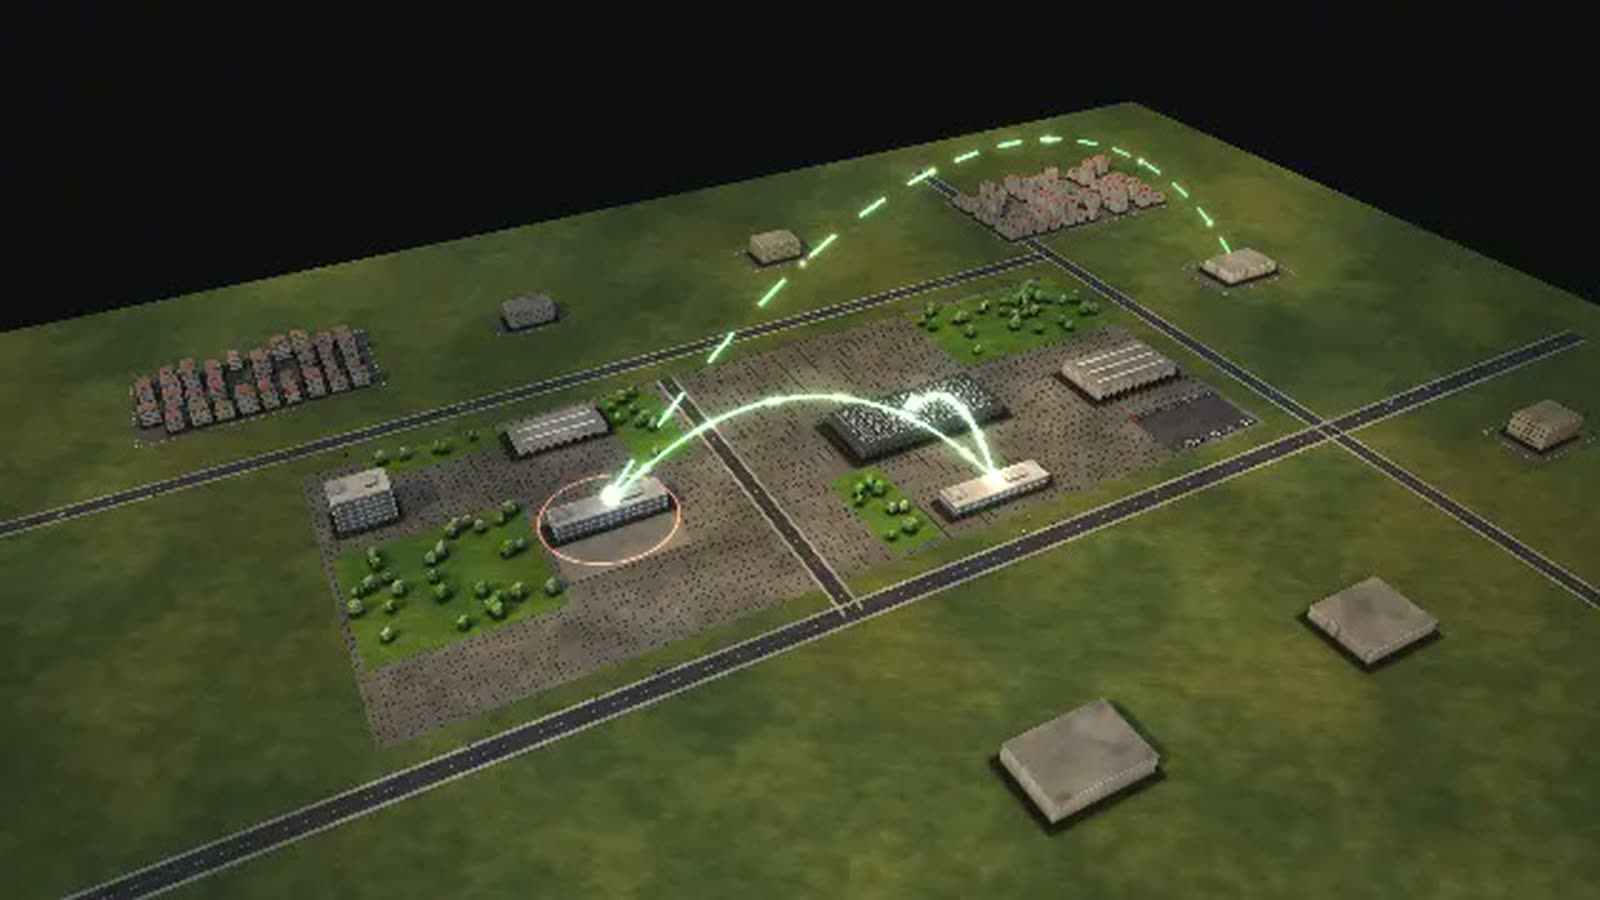
Structure across the whole site – reporting lines between the buildings. -
The whole network at night – collaboration inside and far beyond. -
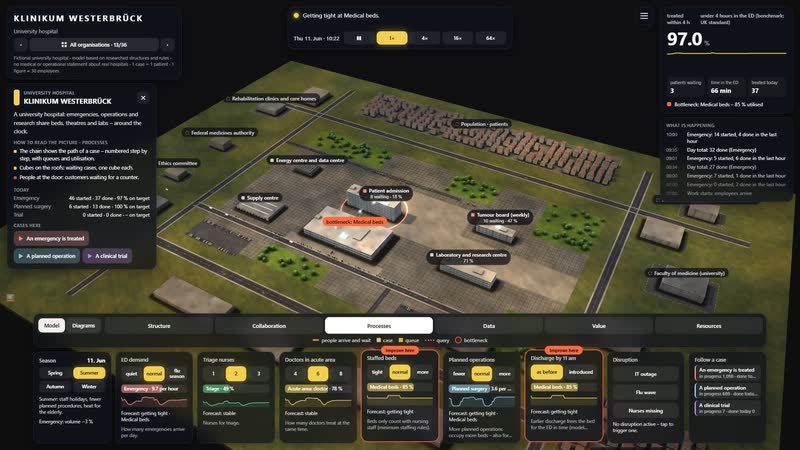
Every step labelled – name, how many are waiting, utilisation. -
Following one case – ‘An emergency is treated’ – step by step through the building. -
Flu wave – resources view, the backlog grows floor by floor. -
The lever – Triage nurses set to ‘3’ – a flash shows where it acts. -
Spring at KLINIKUM WESTERBRÜCK – Ward tower opened up, rings show the workload. -
Summer evening – warm light, long shadows, golden arcs above the square. -
Autumn – leaves on the paths, performance view. -
Winter evening – snow on the site, Ward tower open and lit, collaboration glowing. -
Diagram ‘Who works with whom’, calculated live from the model. -
Diagram ‘Year, week, day’, calculated live from the model. -
Diagram ‘Management levels as a staircase’, calculated live from the model. -
Diagram ‘How a case flows’, calculated live from the model. -
Diagram ‘What each control does’, calculated live from the model. -
Diagram ‘What the work depends on’, calculated live from the model. -
Diagram ‘Where it gets tight’, calculated live from the model. -
Diagram ‘Who leads whom’, calculated live from the model. -
The whole software – situation, key figure, time, views and the controls below. -
Ward tower selected – floor list on the right, the floors drift apart. -
Emergency department – card with task, location and all relations. -
Flu wave triggered – timeline, key figure and bottleneck react. -
Countering – Triage nurses increased – the tile shows the effect since the change. -
Diagram ‘How a case flows’ with its panel – findings in sentences. -
Diagram ‘Who works with whom’ with its panel. -
Follow a case – step, waiting time and target on the card. -
The tour leads through the software in eight steps. -
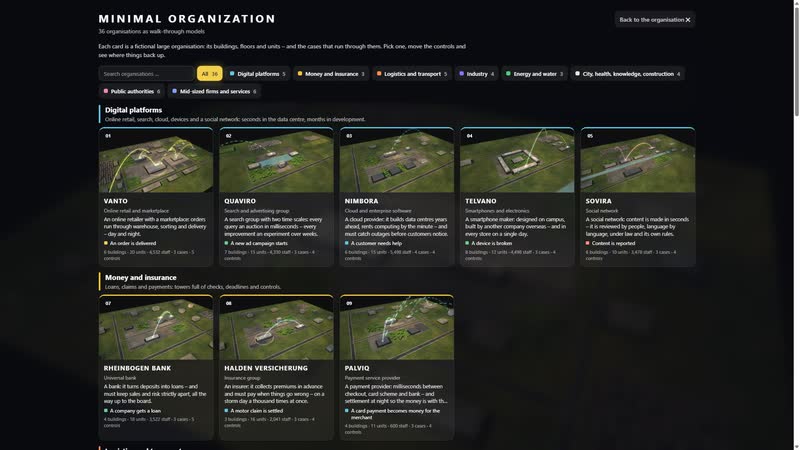
36 organisations to choose from, each with its own picture.

Your hospital as a model
We fit the model to your ED, your wards and your processes. Talk to us about your questions and your data; we will send you the password for the simulation on request.
cube4tec.de/spiele/minimal-organization/
Chiedere informazioni
Minimal Organization: Klinikum
Basis and limits
Fictional university hospital · model based on researched structures and rules · no medical or operational statement about real hospitals
1 case = 1 patient · 1 figure ≈ 30 employees
All volumes, durations, rates and capacities are model assumptions for understanding, not values of a real hospital.
Distribution across triage levels, admission rate and length of stay (mean 4.5 days, national average about 7) are model assumptions.
Documented: five triage levels with target times (MTS), discharge management (§ 39 SGB V), pre-admission treatment (§ 115a SGB V), parallel assessment of trials (Reg. (EU) 536/2014), beds only with nursing staff (PpUGV).
The 4-hour target is a UK standard used as a benchmark; Germany has no statutory target for ED length of stay.
The faculty of medicine is shown outside as a separate legal entity.
Public sources the model is based on:
- NRW Universitätsklinikum-Verordnung (UKVO)
- SGB V (§§ 39, 108 ff., 115a, 275)
- Krankenhausfinanzierungsgesetz
- Manchester-Triage-System (DocCheck Flexikon)
- Verordnung (EU) 536/2014 über klinische Prüfungen
- ESC-Leitlinien akutes Koronarsyndrom
- Destatis: Krankenhäuser
- Pflegepersonaluntergrenzen-Verordnung
- BSI-Kritisverordnung
- NHS England: 4-hour A&E standard
Similar business models
-
Health insurer
A statutory health insurer as a walkable model: how a wheelchair application moves from quote to decision, when the medical service steps in and where deadlines get tight.
-
Pharmaceutical company
A pharmaceutical plant as a walkable model: follow a batch from the cleanroom to certification by the qualified person and see where the four weeks go.
-
University
A university as a walkable model: see how an exam turns into a recorded grade, how a professorship is filled and where the academic year creates peaks.
-
Police authority
A city police authority as a walkable model: what happens after an emergency call, how many patrols it takes and what shortens the time to arrival.
-
Hotel
A city and conference hotel as a walkable model: how a room gets from check-out at 11 to check-in at 3 pm and where cleaning, inspection or front desk run out of time.
-
City administration
A large city's administration as a walkable model: see how a building application moves through the departments, how council and committees meet and where people queue at the counter.
-
Construction group
A construction and infrastructure group as a walkable model: see how a viaduct is built section by section and where frost, inspections and variations cost time.
-
Online retail
An order from click to doorstep as a walkable model: payment check, warehouse, packing, trucks, sortation and delivery in a running simulation.
KLINIKUM WESTERBRÜCK is invented; triage mix, admission rate and length of stay are assumptions. With your hospital's data the model shows what is scattered today – such as actual arrivals per hour and triage level, or discharge times per ward.