
Simulazione · Minimal Energy · Heat and storage
Düsseldorf Lausward
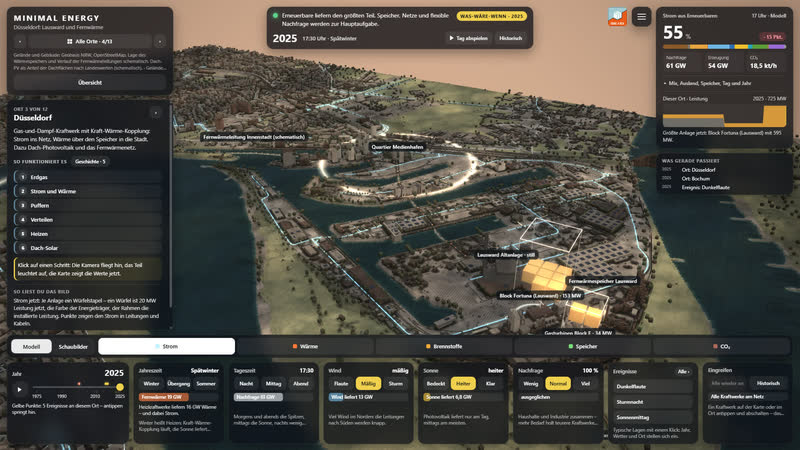
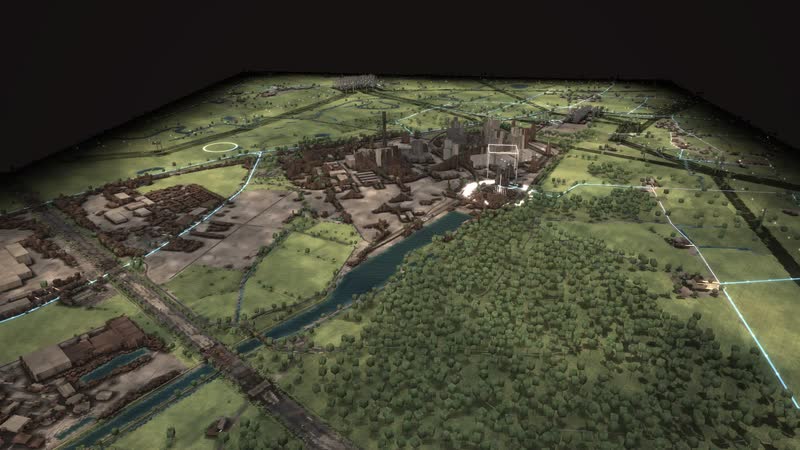
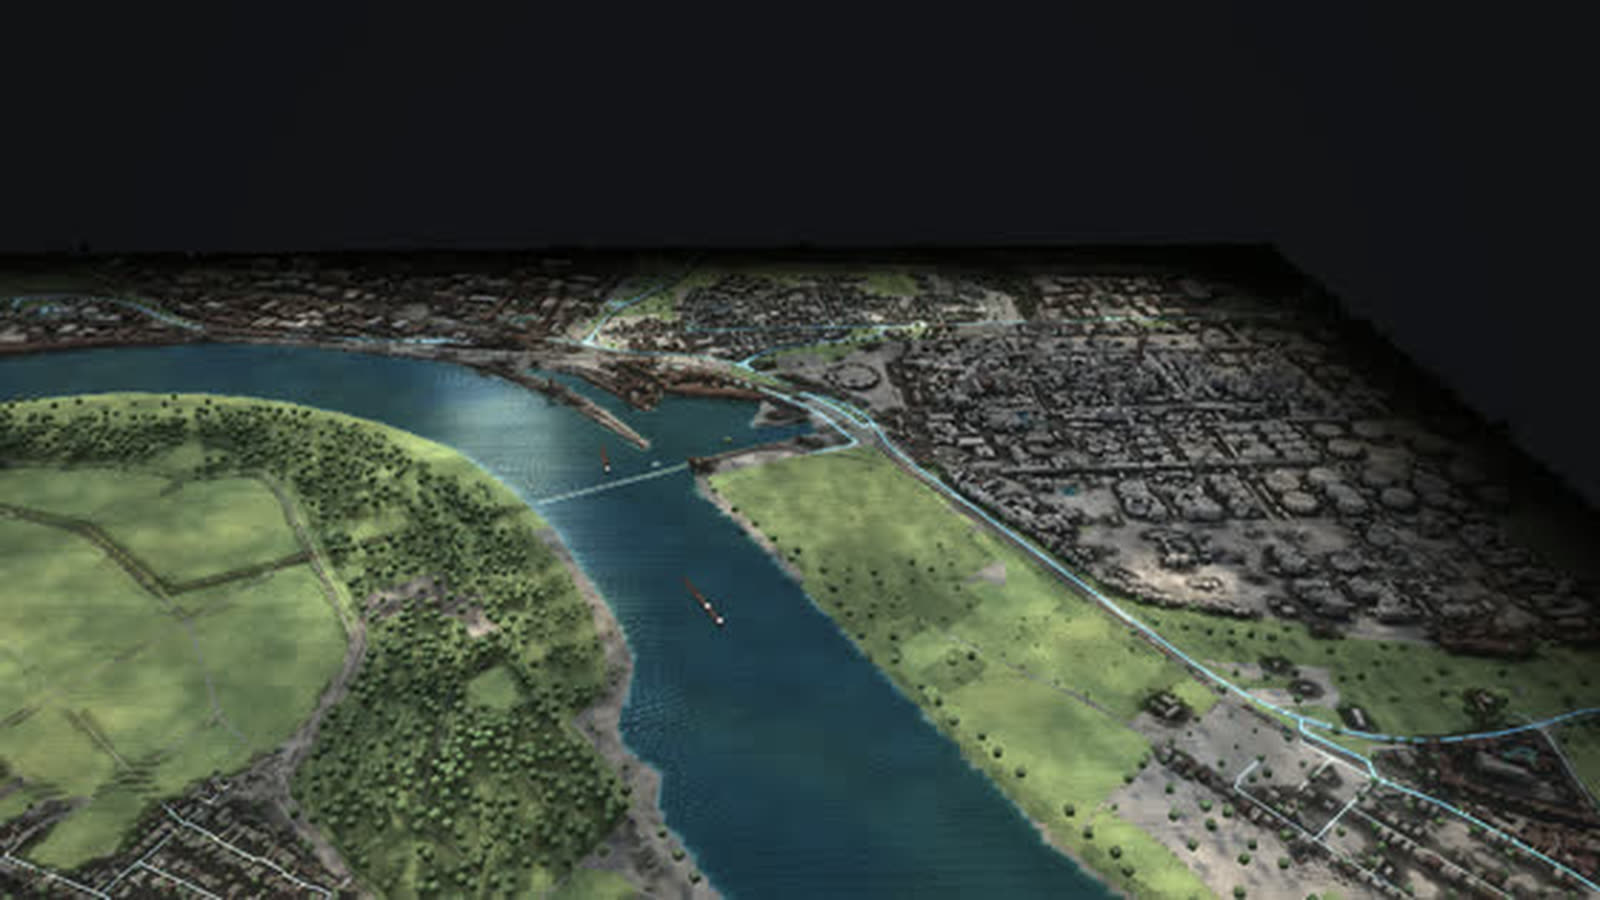
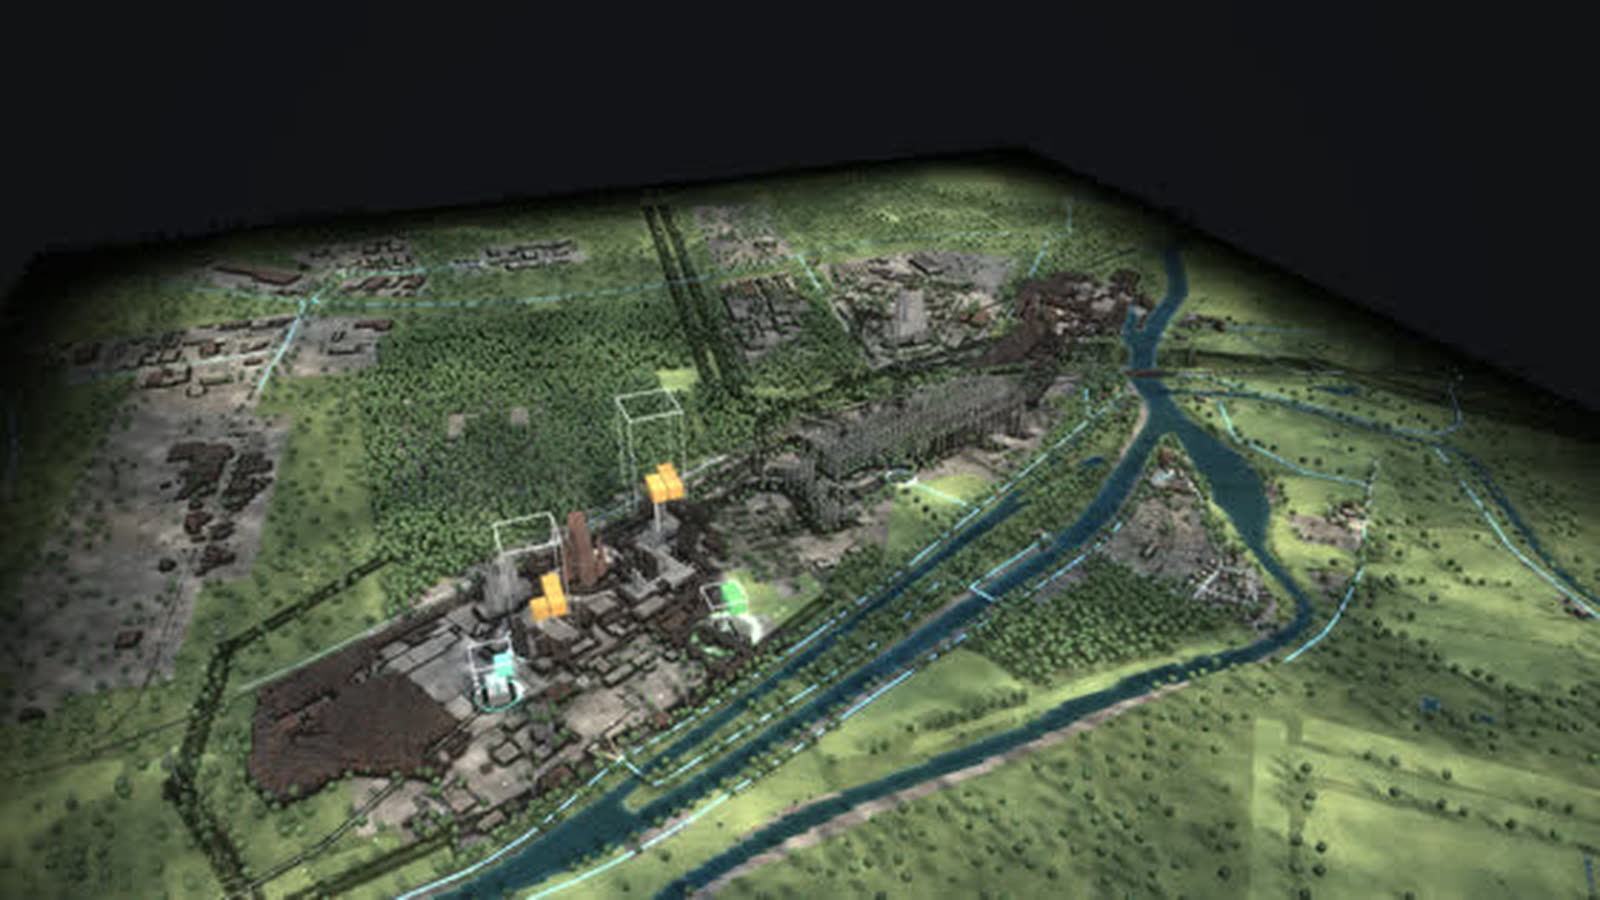
A combined-cycle gas plant on the Rhine as a walkable model: power to the grid, heat via a 58 m storage tank and the district heating line into the media harbour and the city centre.
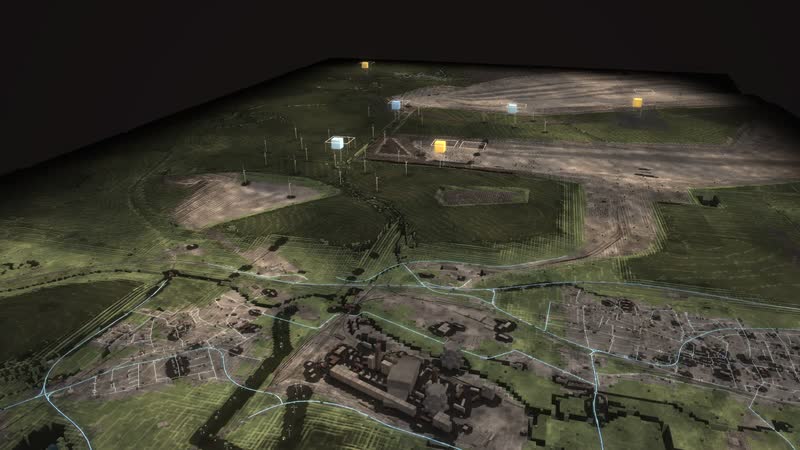
Real are terrain and buildings (Geobasis NRW, OpenStreetMap) and the plants with capacity and years. The position of the heat store, the route of the district heating lines and the rooftop photovoltaics are schematic, and the capacity of the store is estimated; power and heat now come from the model. With your data it shows more, such as your network with real routes, fill levels and connections per district.
Combined heat and power in Düsseldorf: at Lausward on the Rhine stands a combined-cycle gas plant that produces power and heat at the same time. The Fortuna unit has run since 2016 with 595 MW of power and 300 MW of heat, over 61 % electrical efficiency and about 85 % fuel use with heat extraction. Next to it stand two gas turbines from 1974/75 and the site of the old plant, built in 1955–1957 for hard coal.
The chain of the place: natural gas reaches the plant by pipeline, and the Fortuna unit generates power and uses the waste heat as well. A storage tank 58 m tall and 30 m wide keeps hot water: power is made when it is needed, the heat flows later. Hot water flows into the city along the district heating line and returns cooler, about 190 km of network; homes and offices heat with it instead of their own boiler.
In winter the heat demand grows, and the heat view shows the houses as a thermal image. Rooftops add solar power, most of it at midday. The page is for everyone who plans or explains power and heat in a city: suppliers and heat planners, municipalities and district development, chambers and associations, schools, universities and exhibitions.
The chain of the place
- 01
Natural gas: Natural gas reaches the Lausward plant by pipeline.
- 02
Power and heat: The Fortuna unit generates power and uses the waste heat as well: combined heat and power.
- 03
Buffering: The heat store keeps hot water: power is made when it is needed, the heat flows later.
- 04
Distributing: Hot water flows into the city along the district-heating line and returns cooler.
- 05
Heating: Homes and offices heat with district heat instead of their own boiler.
- 06
Rooftop solar: Rooftops add solar power, most of it at midday.
What is shown – why – for whom
| Cosa viene mostrato | Perché | Per chi |
|---|---|---|
| The chain Natural gas – Power and heat – Buffering – Distributing – Heating – Rooftop solar | Perchéexplains combined heat and power in six steps | Per chiSchools, the public |
| Heat view on a winter evening | Perchéshows the houses as a thermal image and columns at plants that supply heat | Per chiHeat planning, municipalities |
| Lausward heat store, 58 m tall, 30 m wide | Perchéshows how power and heat are decoupled in time | Per chiOperators, students |
| Diagram ‘Energy flow now’ | Perchéshows how fuels, power, heat and losses flow in this hour | Per chiPlanning, universities |
| Diagram ‘Capacity and output’ | Perchésets installed capacity against generated output by source | Per chiEnergy industry, associations |
| Diagram ‘Who supplies first’ | Perchéshows in which order the plants step in by cost | Per chiTeaching, energy industry |
| Diagram ‘Every plant from construction to demolition’ | Perchéshows operation, standstill and dismantling of the old plant, gas turbines, Fortuna unit and store | Per chiMuseums, communications |
Facilities and areas in the model
-
Block Fortuna (Lausward)
Combined-cycle gas and steam turbine since 2016: over 61 % electrical efficiency, about 85 % fuel use with heat extraction. 595 MW power, 300 MW heat.
-
Gasturbinen Block E
Two gas turbines from 1974/75 (about 130 MW together, figures from OSM).
-
Lausward Altanlage
Built 1955–1957 for hard coal, later natural gas and fuel oil. Units and years schematic here.
-
Fernwärmespeicher Lausward
58 m tall, 30 m diameter, since 2017: stores heat when power is in demand and releases it when the city needs it. Capacity estimated.
-
Fernwärmeleitung Innenstadt (schematisch)
Hot flow into the city, cooler return: about 190 km of network. Route schematic here.
-
Quartier Medienhafen
Example district on the network: offices and flats are supplied with district heat via transfer stations.
-
Innenstadt
Consumption centre: power from the distribution grid, heat from the district heating network, solar on the roofs.
-
Dach-Photovoltaik
Share of roofs with solar according to NRW capacity per year (distributed schematically).
Processes in the model
The chain of the place
- 01Natural gas: Natural gas reaches the Lausward plant by pipeline.
- 02Power and heat: The Fortuna unit generates power and uses the waste heat as well: combined heat and power.
- 03Buffering: The heat store keeps hot water: power is made when it is needed, the heat flows later.
- 04Distributing: Hot water flows into the city along the district-heating line and returns cooler.
- 05Heating: Homes and offices heat with district heat instead of their own boiler.
- 06Rooftop solar: Rooftops add solar power, most of it at midday.
One day
- 01“Play the day”
- 02the sun moves, wind and demand change every hour
- 03the stacks above the plants grow and shrink
- 04storage charges and discharges
Fifty years
- 01▶ at the year (time travel)
- 021975
- 031995
- 042015
- 052025
- 06plants appear, run, are shut down and dismantled; the history of the place jumps to every year
How a heat site can use the model
-
Operations and heat planning
Plant, store, pipeline and districts in one picture. The store buffers when power and heat are needed at different times: it takes in heat when power is in demand and releases it when the city needs it.
Per chiOperators, heat and network planning
-
Municipality and district
The media harbour is an example district on the network: offices and flats are supplied with district heat via transfer stations. A picture for talks about connection, expansion and heat planning.
Per chiMunicipalities, urban planning, economic development, chambers
-
Schools and universities
How does combined heat and power work? The six steps of ‘How it works’ lead from natural gas through power and heat, buffering, distributing and heating to rooftop solar; one click flies there and the part lights up.
Per chiTeachers, vocational schools, building services students
-
Museums and exhibitions
Time travel shows 1975, 1995, 2015 and 2025: the old plant until 2000, the gas turbines from 1974, the Fortuna unit from 2016 and the store from 2017. The history of the place jumps to every year.
Per chiExhibitions, city history, guided tours
-
Public communication
Why does a 58 m heat store stand on the Rhine? On a winter evening the thermal image shows where heat is used, and district heat flows into the city – an answer without jargon.
Per chiPublic relations, customers, neighbours
What you can change
Controls
- Year 1975–2025: plants appear and disappear, mix and grid change; ▶ lets the years run.
- Season: snow, foliage, meadows, chimney smoke; more heat and power demand in winter, more sun in summer.
- Time of day: sun position, dusk, night with windows and street lights; demand follows the daily profile.
- Wind: rotors turn faster, sea state, smoke plumes lie flat; wind power rises, curtailment in a storm.
- Sun: clouds and soft shadows; photovoltaics deliver more or less.
- Demand (households, industry): more lit windows, plant lighting, chimney smoke; more expensive plants step in.
- Views: power, heat, fuels, storage, CO₂ – each with its own columns, stacks and values.
Events
- Winter evening without wind or sun (tiles): Season winter, evening, calm, overcast: demand peaks, the stacks above wind and solar shrink, fossil plants, storage and imports carry the load.
- Stormy night (tiles): Night, gale, low demand: wind delivers more than is needed, storage charges, surplus is curtailed or exported.
What the model gives a heat site
-
01
Power and heat in one picture
The model shows heat as well as power: columns at the plants that supply heat and the houses as a thermal image on a winter evening.
-
02
A day in time-lapse
‘Play the day’ moves sun, wind and demand hour by hour. Storage charges and discharges, and rooftop solar rises at midday.
-
03
Into every house
At dusk the power runs from the substation via the local stations to every house connection, with cars and trains on the routes from OpenStreetMap.
-
04
Seasons you can see
Snow, foliage, chimney smoke: in winter heat and power demand rise, in summer the sun delivers more. The tiles switch season, time of day, wind, sun and demand at once.
-
05
In the browser and on the big screen
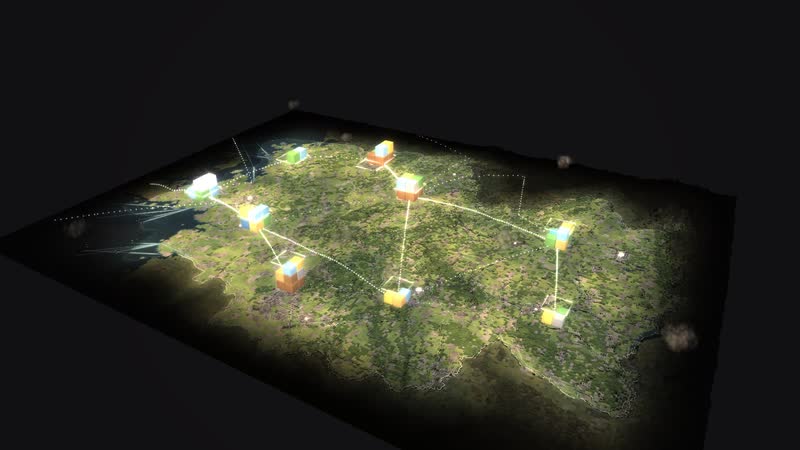
A browser is enough, and large projections work too. Eleven more places and the map of Germany are part of the same model, designed by an artist and developer.
Your heat network as a model
Would you like to show your plant, your heat store or your district heating network this way, with real routes and districts? Write to us or give us a call, and we will discuss which data the model needs. We will send you the password to the simulation on request.
cube4tec.de/spiele/minimal-energy/
Chiedere informazioni
Minimal Energy: Düsseldorf Lausward
Basis and limits
Real are terrain and buildings (Geobasis NRW, OpenStreetMap) and the plants with capacity and years. The position of the heat store, the route of the district heating lines and the rooftop photovoltaics are schematic; power and heat now come from the model.
Public sources the model is based on:
- Geobasis NRW (dl-de/zero-2.0)
- OpenStreetMap-Mitwirkende (ODbL)
- OPSD; Wikipedia: Liste fossil-thermischer Kraftwerke (sekundär)
More places in the model
-
Bochum · MARK 51°7
A former car plant above the Dannenbaum colliery as a walkable model: the new MARK 51°7 district is to draw heating and cooling from the water of the old mine, from 820 and 340 m down.
-
Datteln 4
Germany’s newest hard-coal plant as a walkable model: coal by ship on the Dortmund-Ems Canal, power for the grid and the railway, district heat as far as Recklinghausen.
-
Herdecke
Three generations of storage at Lake Hengstey as a walkable model: the Koepchenwerk of 1930, the pumped-storage plant of 1989 and batteries since 2017 – the level in the reservoir follows sun, wind and demand.
-
Hamm-Uentrop
Five decades of energy on the Lippe and the canal as a walkable model: the THTR-300 thorium reactor, the Westfalen hard-coal plant, a gas plant, a large battery – and soon direct current from Wilhelmshaven.
-
Wesseling
Germany’s largest refinery site as a walkable model: crude oil from Rotterdam and Wilhelmshaven, distillation column, tank farm and Rhine ships – and since 2021 hydrogen made from power.
-
Germany 1975–2025
Fifty years of energy supply on one map: 365 sites, ten grid regions and the power of every hour – from two separate grids in 1975 to wind and sun in 2025.
-
Rhineland lignite district
The Rhineland lignite district as a walkable model: from the Garzweiler mine via conveyors, boilers and cooling towers into the 380 kV grid – while wind, sun and batteries grow on the reclaimed land.
-
Lingen
The whole nuclear era in one place as a walkable model: the Lingen nuclear plant of 1968, the Emsland nuclear plant until April 2023, interim storage and dismantling – next to them gas, a battery and hydrogen.
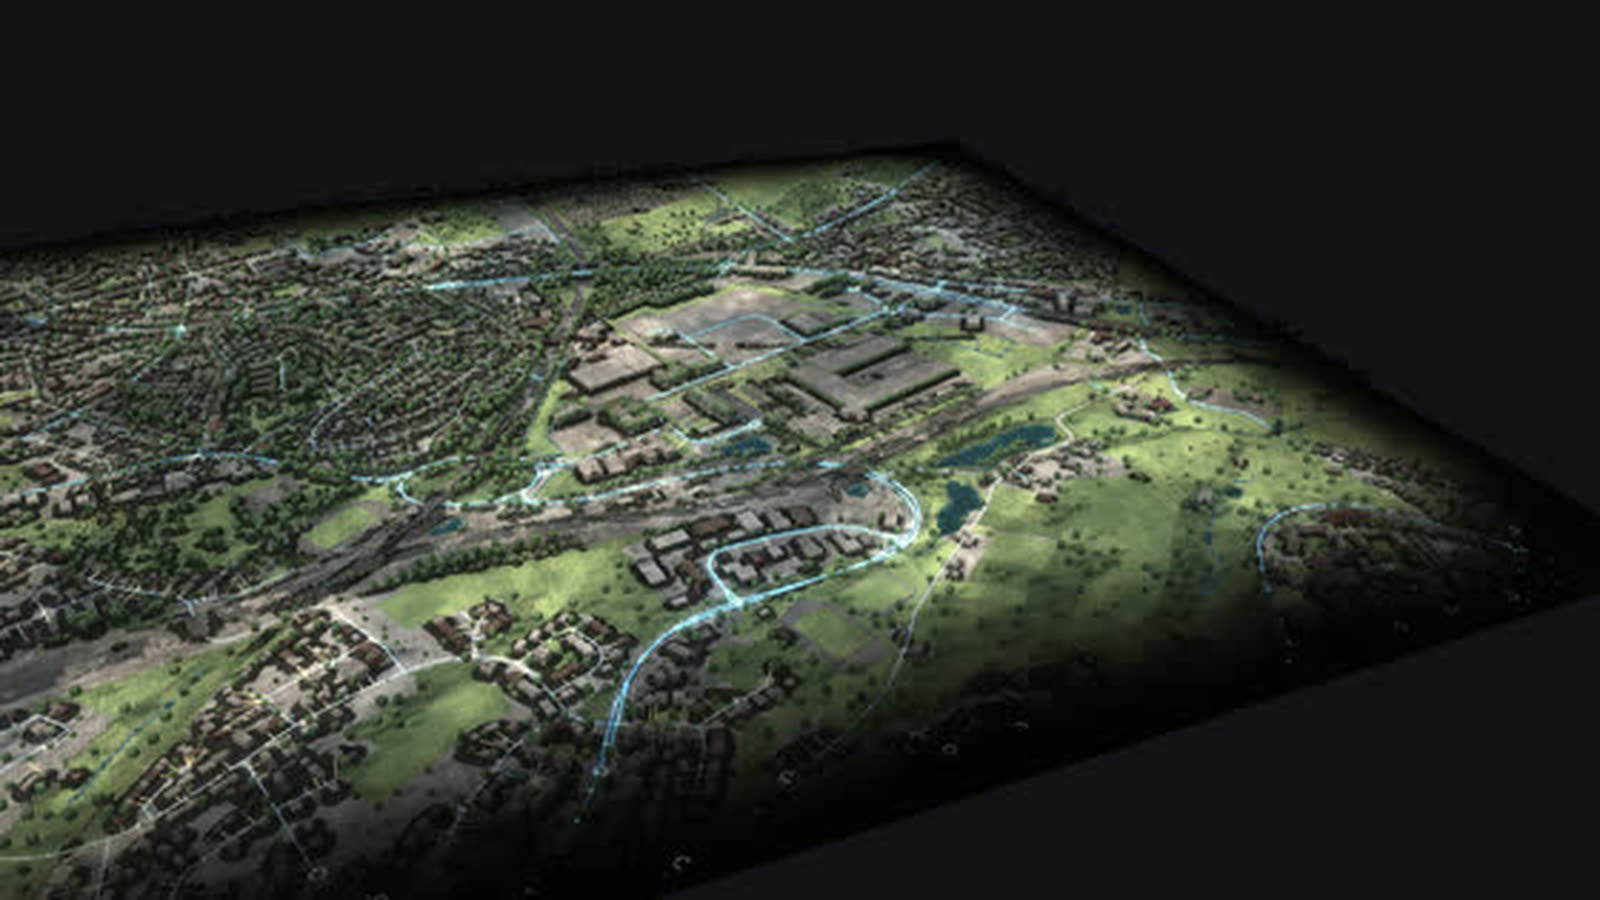
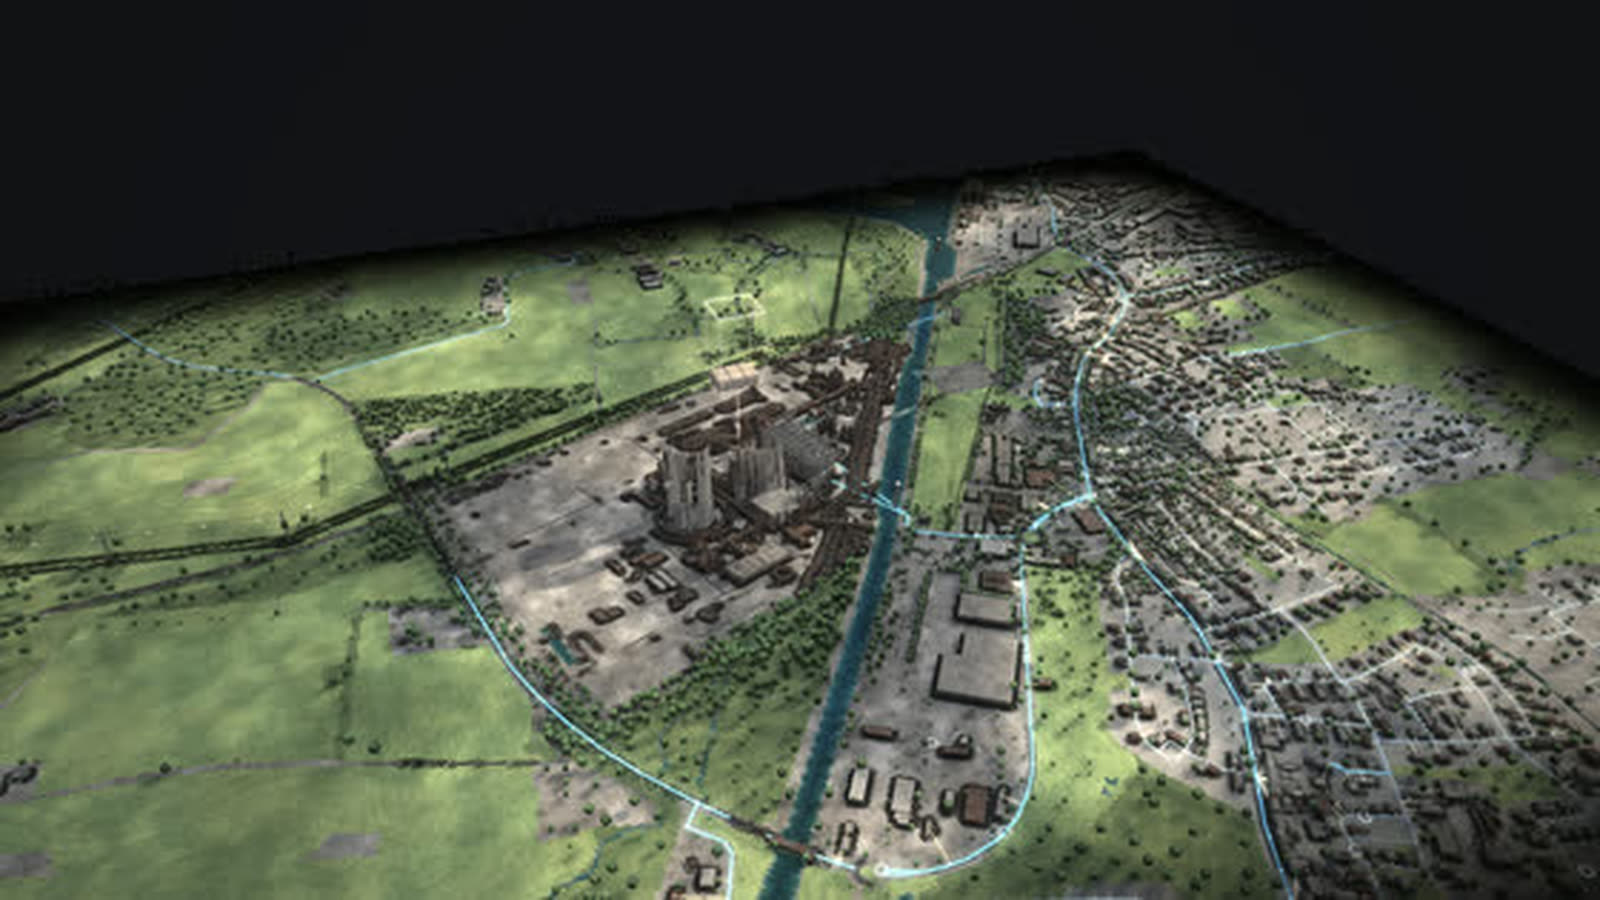
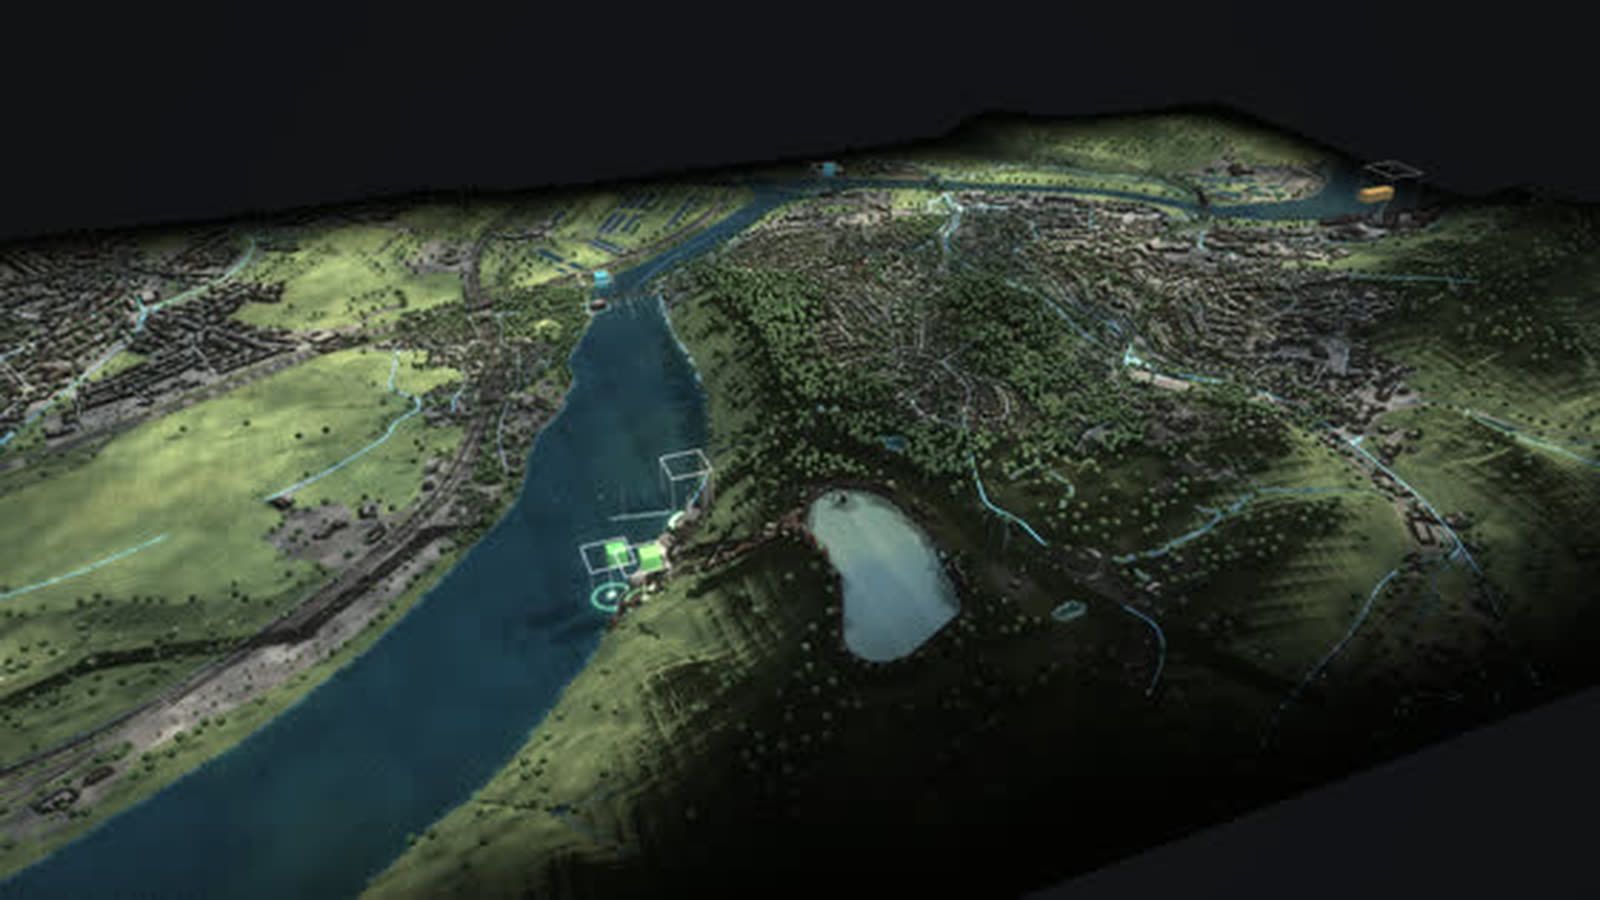
Real are terrain and buildings (Geobasis NRW, OpenStreetMap) and the plants with capacity and years. The position of the heat store, the route of the district heating lines and the rooftop photovoltaics are schematic, and the capacity of the store is estimated; power and heat now come from the mode…