
Simulation · Minimal Water · Dams and reservoirs
Siegburg · Wahnbach valley – a reservoir for drinking water only
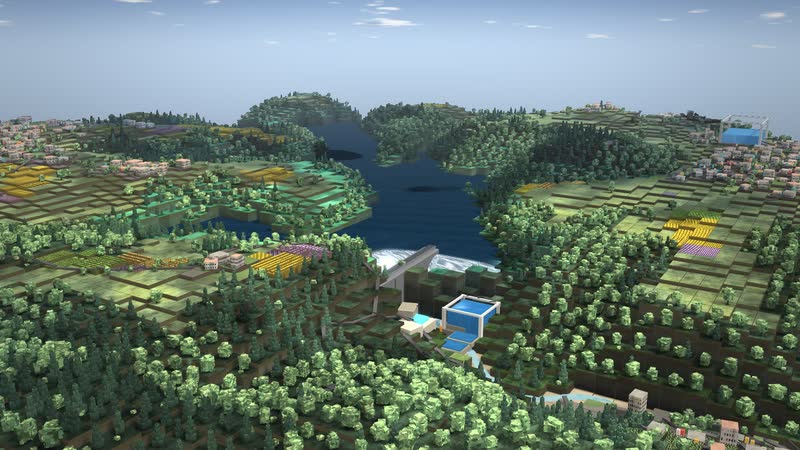
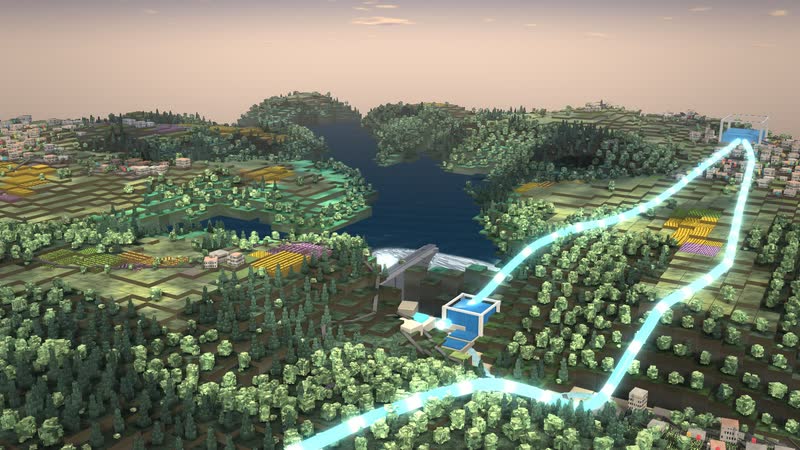
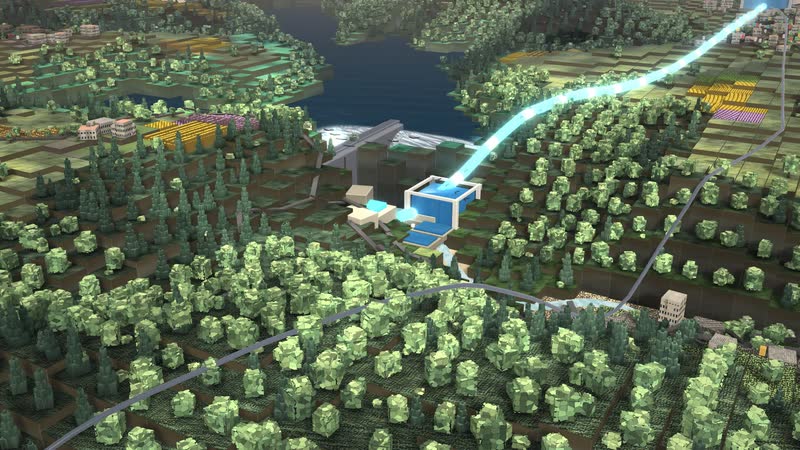
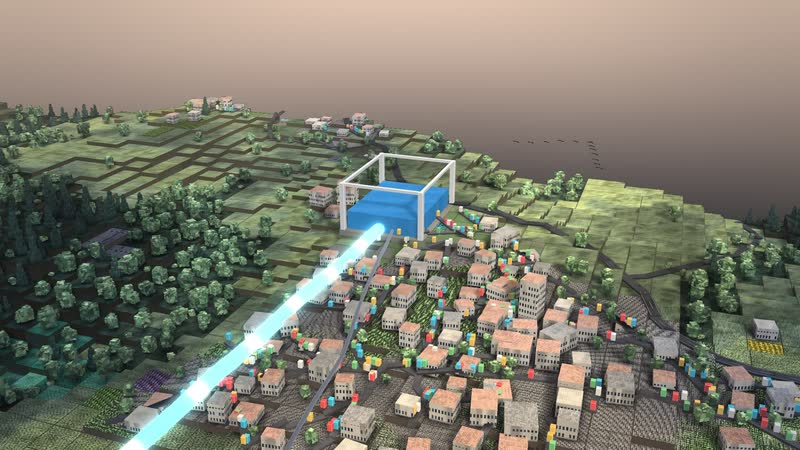
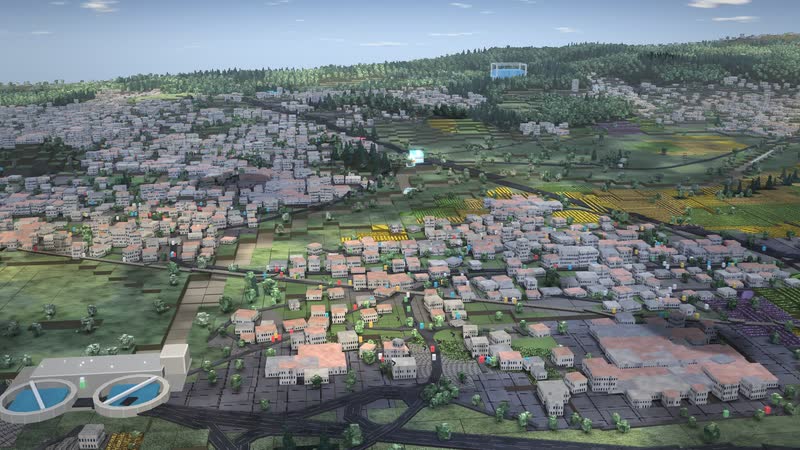
A drinking-water dam as a model: intake below the dam wall, treatment on the Siegelsknippen, almost five kilometres of downpipe into the valley and groundwater from the Sieg floodplain, mixing in the service reservoir.
Trailer
Real are location, terrain and buildings (OpenStreetMap, heights from SRTM and EU-DEM). The pipe network, sizes, demand and dam operation are invented and simplified, and the shares of dam and floodplain are model assumptions. It is not an operations control and not a planning tool. With your data, the model shows your site and your processes.
In the model the Wahnbach dam is a pure drinking-water reservoir: below the dam wall raw water is taken off and treated on the Siegelsknippen, and almost five kilometres of downpipe lead from the hill across the valley to the Kaldauen service reservoir. There it mixes with groundwater from wells in the Sieg floodplain; in the model three quarters of the drinking water come from the dam and one quarter from the floodplain. From there it flows to the town centre, Wolsdorf, Kaldauen and the commercial area, and the wastewater goes through the sewer to the sewage plant.
Three controls move the whole landscape: rain, heat and consumption, plus the weather situations normal year, hot summer, drought and heavy rain. If the rain stays away, the reservoir drops from the shore, the forest around it burns and the message lake almost empty appears; in heavy rain it fills, and the Sieg spills into the floodplain. In Kaldauen, the highest district just below the service reservoir, the pressure runs short first.
Real are location, terrain and buildings. The pipe network, sizes, demand and dam operation are invented and simplified: the shares of three quarters and one quarter are model assumptions. The page is for schools and universities, exhibitions, municipalities and water supply.
The path of water
- 01
the lake stores the water of the Wahnbach
- 02
raw water is drawn off below the dam
- 03
it is treated on the Siegelsknippen
- 04
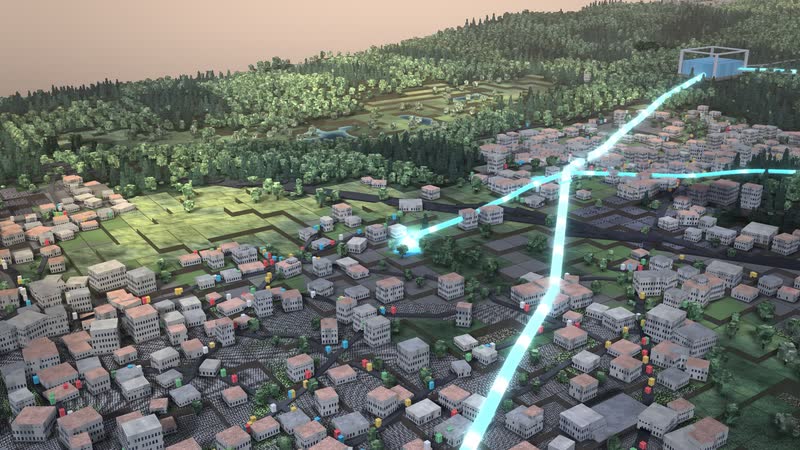
the gravity main carries it down to the Kaldauen reservoir
- 05
groundwater from the Sieg floodplain joins it
- 06
into the town centre, Wolsdorf, Kaldauen and the industrial area
- 07
through the sewer to the treatment plant
01
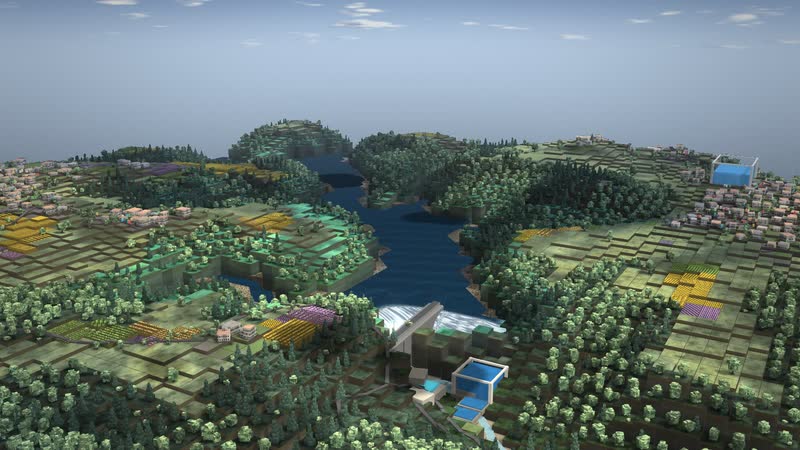
Water shapes the land
Siegburg · Wahnbach valley: The Wahnbach reservoir stores drinking water only: it is treated on the Siegelsknippen and flows to the town, while wells in the Sieg floodplain add groundwater.
02
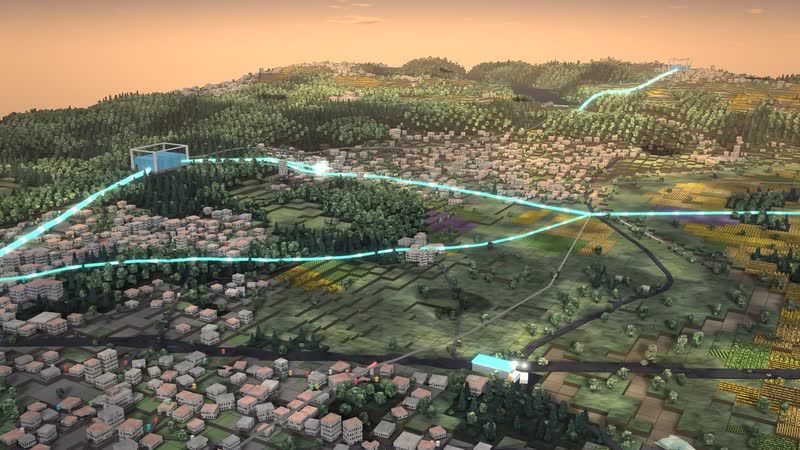
The path of water
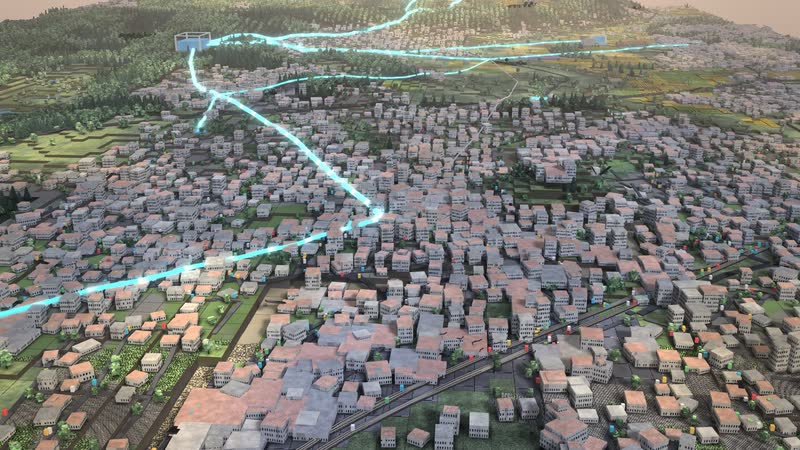
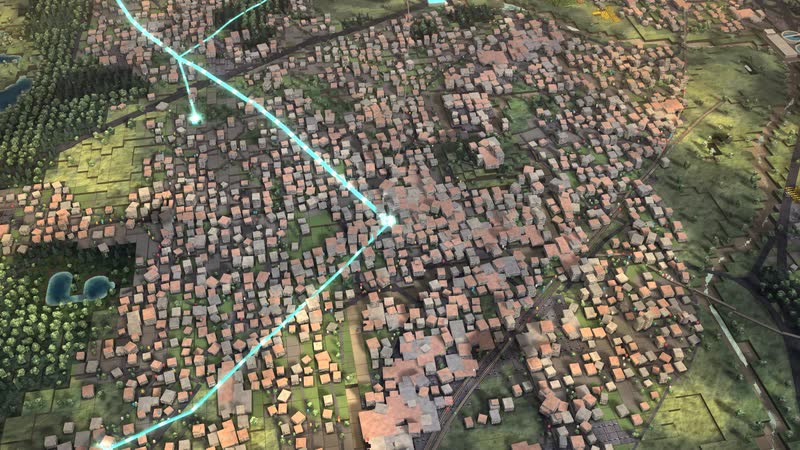
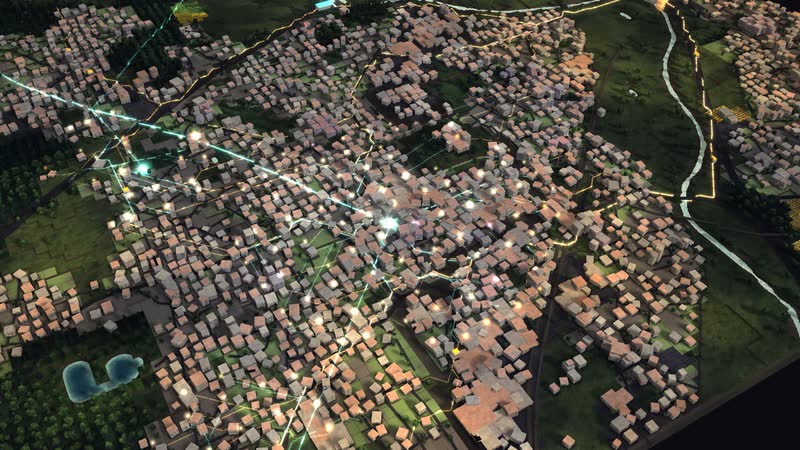
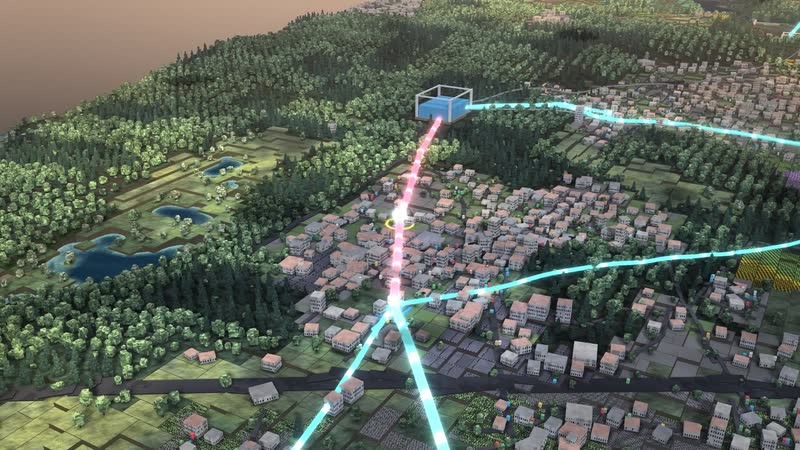
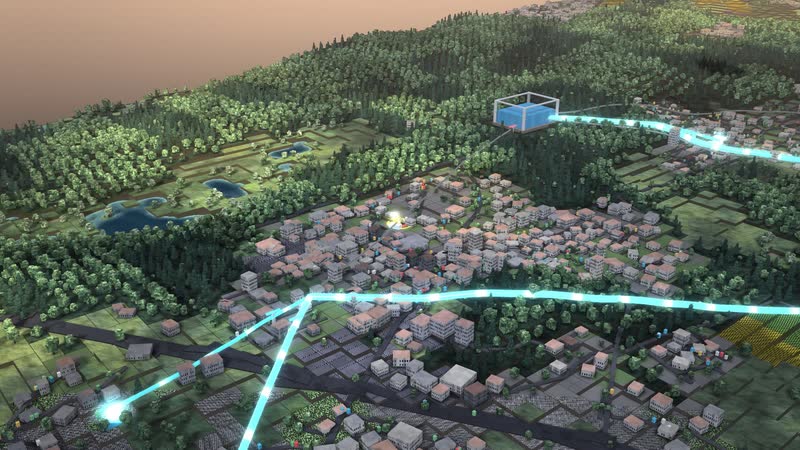
Glowing pipes – the path of the water as one continuous line, the waves run with the speed and direction of the flow.
What is shown – why – for whom
| Ce qui est montré | Pourquoi | Pour qui |
|---|---|---|
| Dam wall and lake in the Wahnbach valley | PourquoiShows how a reservoir releases water in dry times and drops from the shore. | Pour quiteaching, exhibition |
| Intake below the dam and Siegelsknippen waterworks | PourquoiShows where raw water becomes clear water; treatment is simplified. | Pour quiteaching, water supply |
| Downpipe of almost five kilometres | PourquoiShows how the water gets from the hill across the valley to the service reservoir. | Pour quiteaching, exhibition |
| Siegbogen groundwater works with wells in the Sieg floodplain | PourquoiShows the second source that mixes with the dam water. | Pour quiteaching, water supply |
| Kaldauen service reservoir at about 125 m | PourquoiShows where both waters mix and the town gets its pressure. | Pour quiteaching, municipalities |
| Town centre, Wolsdorf, Brückberg and Stallberg, Kaldauen, Buisdorf commercial area | PourquoiShows districts at different heights, from about 70 m to 100 m. | Pour quimunicipalities, teaching |
| Three controls and four weather situations | PourquoiShows connections in the model, not a statement about reality. | Pour quiteaching, education |
03
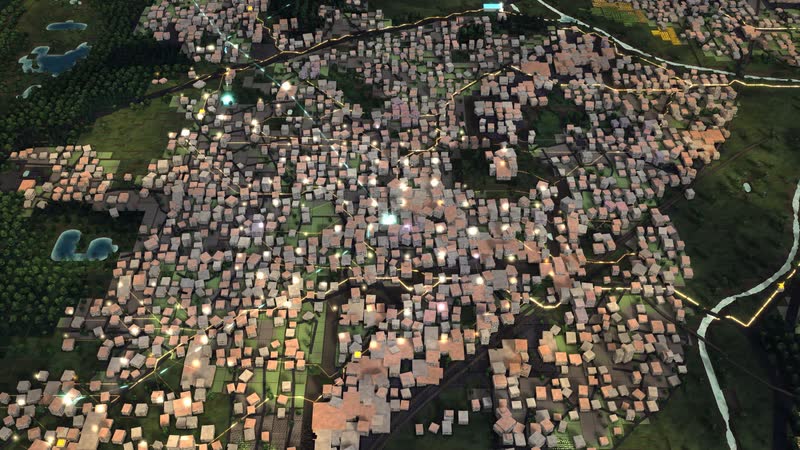
The city from within
Wastewater – From the house through the sewer to the plant.
04
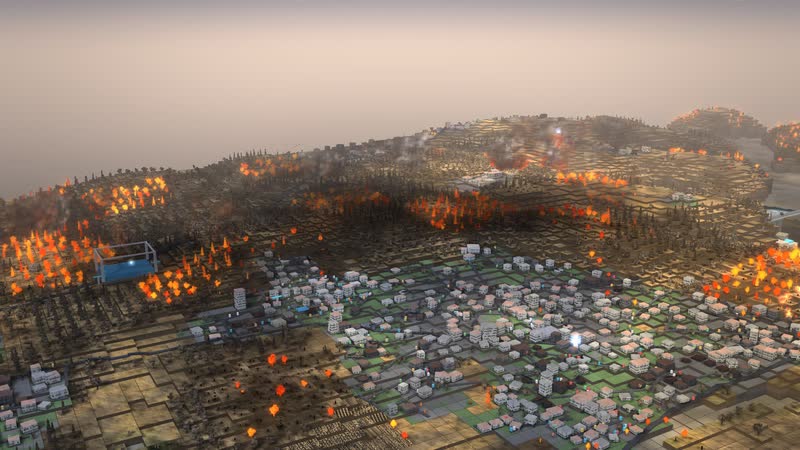
When things get tight
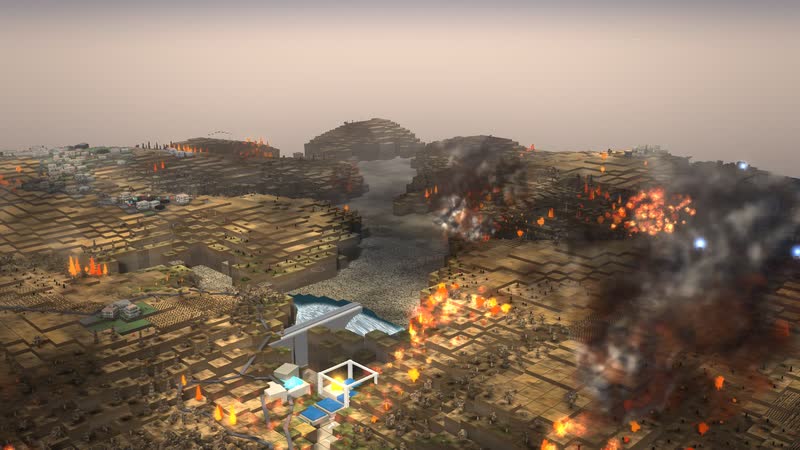
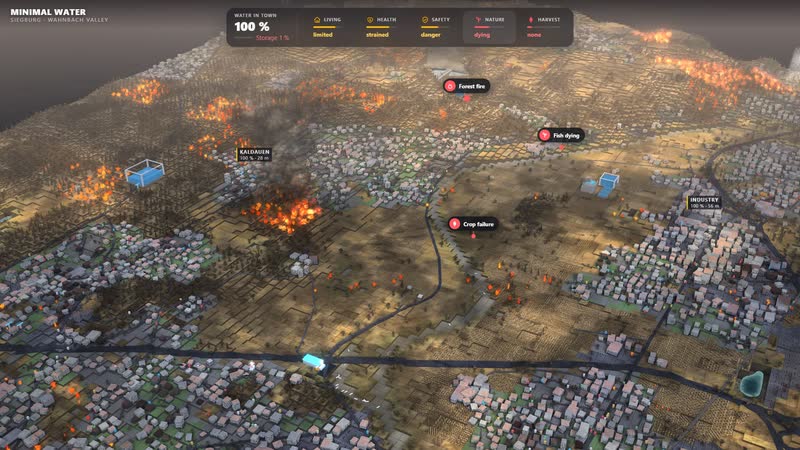
Forest fire – in drought and great heat a glowing front eats through the forest, rain puts it out.
Films from the model
-
Above Siegburg · Wahnbach valley
A flight across the area: low angles with sky, the lake backs up behind the dam, the water falls from the hill into the town, then over the town to the long shot – with the sound of the landscape.
-
The path of water
From the source via the works and the storage into the town, through the sewer and back into the river: station by station, the pipes glowing.
-
The city opens up
Beneath the streets: first the pipes, then the open cross-section, wastewater, rainwater in heavy rain, greywater – and everything together.
-
A water year
A normal year, then heat and drought: fields wither, river and lake sink, the forest burns – then heavy rain, thunderstorm and flood. The landscape answers in real time.
-
Pipe burst and flood
First a main bursts: the spot pulses red, a crew drives out, the storage carries the town. Then heavy rain: the water rises by elevation into floodplain and districts.
-
Using the software
With the full interface: tap weather situations, pull levers, look at stations on the wheel and consequences – every effect shows at once on the map.
Facilities and landscape in the model
-
Wahnbach reservoir · intake
The lake stores the water of the Wahnbach. Below the dam raw water is drawn off – three quarters of the drinking water come from here, the rest from wells in the Sieg floodplain.
-
Siegbogen groundwater works
Wells in the Sieg floodplain pump groundwater – a quarter of the drinking water. It is blended with the reservoir water.
-
Siegelsknippen waterworks
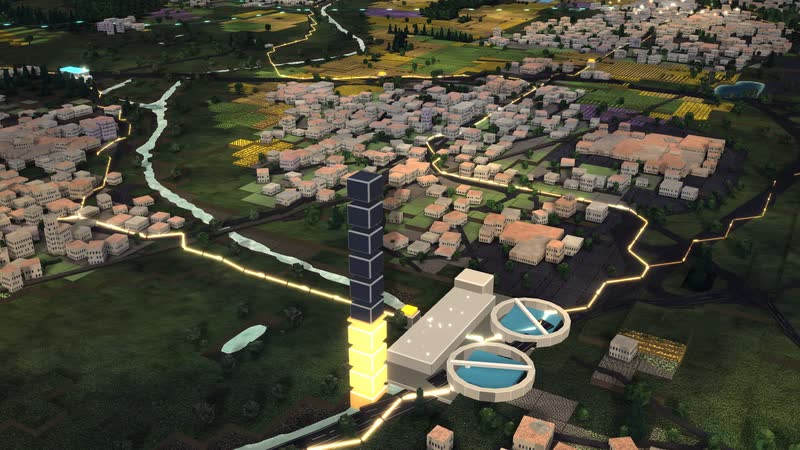
On the hill the raw water is treated (simplified here) and collected in the clear-water tank. From here it flows by gravity to the town.
-
Kaldauen service reservoir
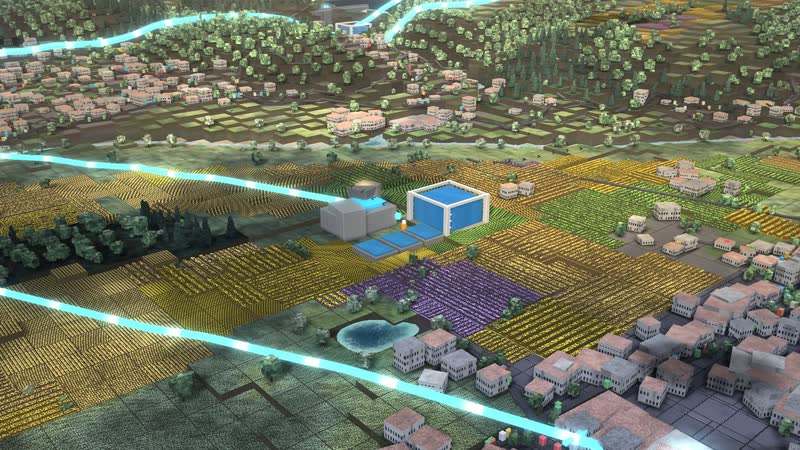
Storage at the forest edge above Kaldauen (about 125 m). Reservoir and groundwater blend here; it gives the town its pressure.
-
Dam wall and reservoir
The reservoir stores water. In dry times it releases water so the river does not run dry.
-
Town centre
Siegburg's centre by the Michaelsberg, about 70 m – low, plenty of pressure.
-
Wolsdorf
Residential area on the slope north-east of the centre, about 95 m.
-
Brückberg · Stallberg
Residential districts in the west, about 75 m.
-
Kaldauen
Highest district, about 100 m, just below the service reservoir – pressure gets tight here first.
-
Buisdorf industry
Businesses along the Sieg working in shifts.
-
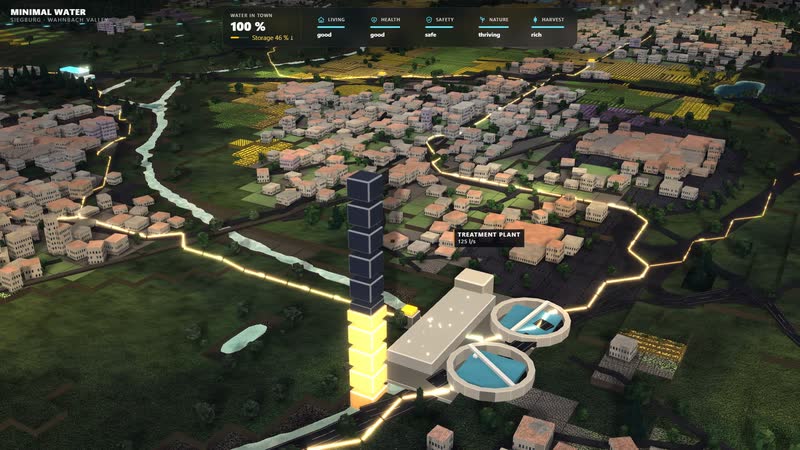
Treatment plant
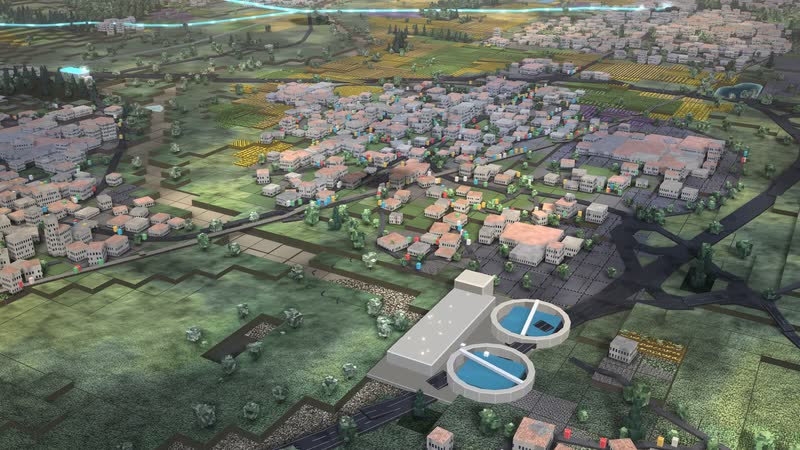
The treatment plant cleans the waste water and returns it to the river. In a storm it overflows.
05
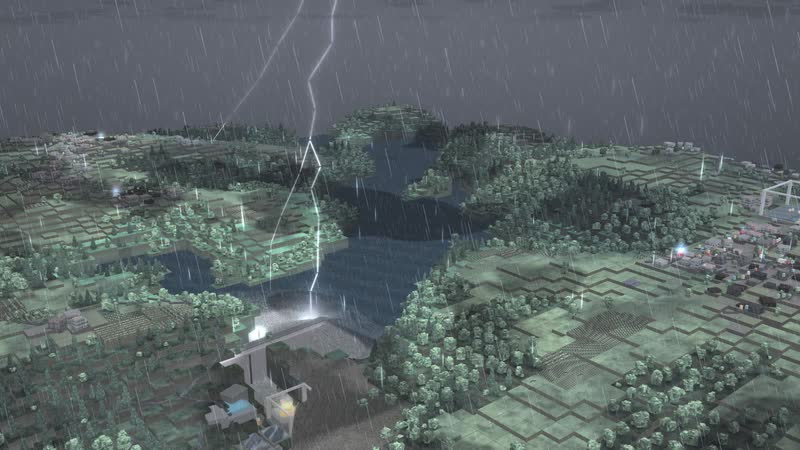
Thunderstorm
Thunderstorm – lightning in view, the cloud lights up from within around the strike, the cover tears open along the line of sight.
06
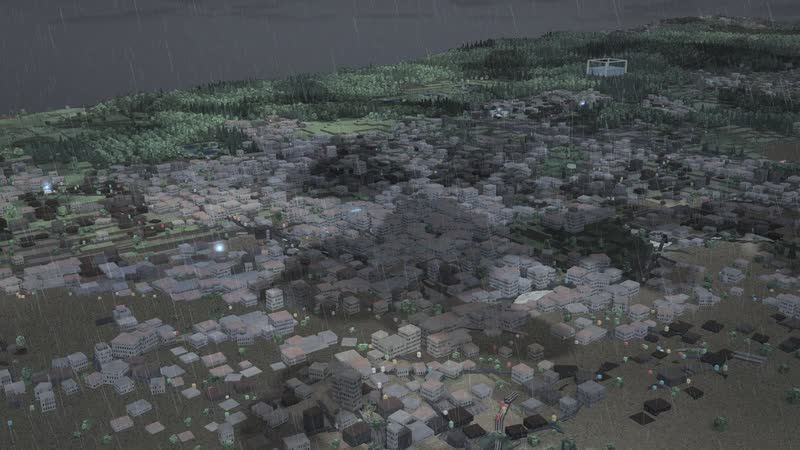
Flood by contour lines
Flood by contour lines – the floodplain and low-lying districts fill up bit by bit, with a dirty rim of foam.
Processes in the model
The path of water
- 01the lake stores the water of the Wahnbach
- 02raw water is drawn off below the dam
- 03it is treated on the Siegelsknippen
- 04the gravity main carries it down to the Kaldauen reservoir
- 05groundwater from the Sieg floodplain joins it
- 06into the town centre, Wolsdorf, Kaldauen and the industrial area
- 07through the sewer to the treatment plant
Heat and drought
- 01no rain and great heat
- 02the soil dries out, the river narrows
- 03the fields wither first
- 04the forest dies and burns, rain puts it out
- 05the lake sinks and dries out from the shore
- 06water runs short in the town, the storage empties
- 07rain brings soil, river and harvest back quickly; dead forest takes far longer
Heavy rain and flood
- 01the soil soaks up all it can
- 02what it cannot hold rushes into streams and the river
- 03the floodplain and low-lying districts fill by contour line
- 04sewers and treatment plant reach their limit
- 05after the rain the water falls again
Pipe burst
- 01a pipe bursts, water escapes
- 02a crew drives out from the depot
- 03the section is shut off
- 04the storage carries the town
- 05after the repair the pipe goes back into service
What the model can be used for
-
What a drinking-water dam is
A reservoir that exists only for drinking water: you see intake, treatment, downpipe and service reservoir one after the other and understand how the water gets from the hill to the town.
Pour quiwater supply, schools, universities
-
Dam and groundwater together
Two sources, one tank: the model shows how dam water and groundwater mix in the service reservoir and what share each source has in the model.
Pour quiwater supply, municipalities, training
-
Playing through a drought
When the rain stays away, the lake drops from the shore. You see how long the storage lasts, and where in town the pressure runs short first.
Pour quicivil protection, municipalities, education
-
Museum and exhibition
A valley, a dam, a pipeline and a town in one picture that can be explored: where does the water come from, and where does it go?
Pour quimuseums, exhibitions, visitor centres
07
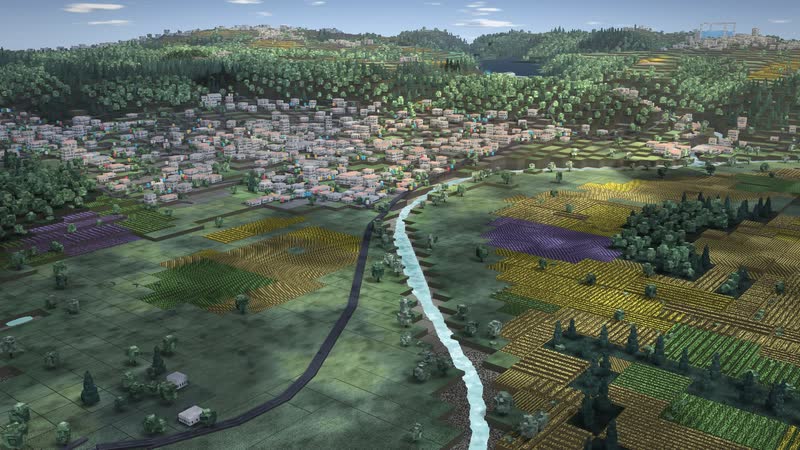
The course
The course – the lake backs up behind the dam, the water falls from the hill into the town; waves and foam move with the current in real time.
08
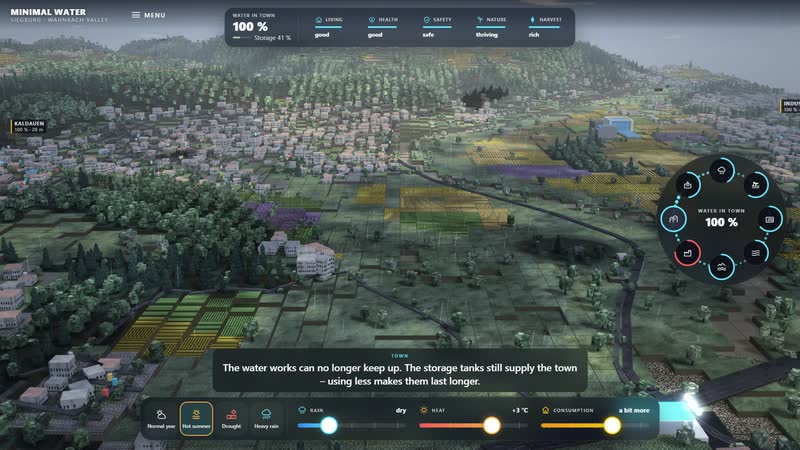
The whole software
Hot summer with one tap – the levers visibly move there, the camera follows the effect, below a sentence explains what is happening.
What you can change
Controls
- Rain: From drought to storm: rain fills soil, groundwater and river; little rain lets everything dry out, a lot of it lets it overflow.
- Heat: Up to four degrees more: more evaporates from lakes, fields and trees, and everyone needs more water.
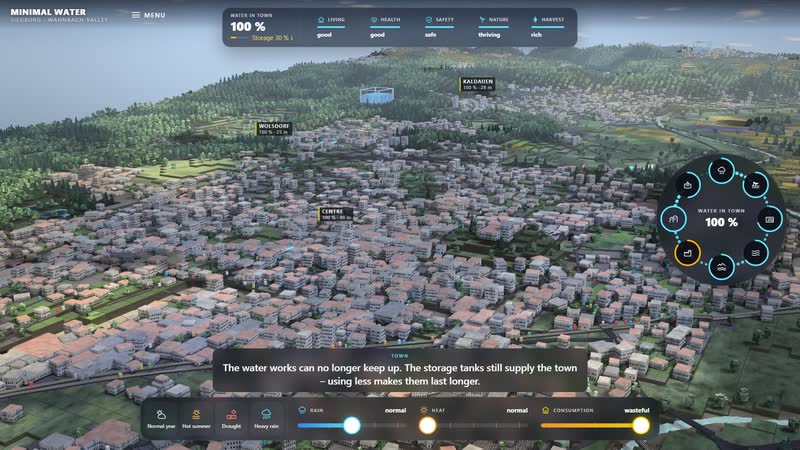
- Consumption: From frugal to wasteful: wasteful speeds up the shortage, frugal delays it.
- Weather situations: Normal year, Hot summer, Drought, Heavy rain: One tap sets all three levers, they visibly move there, and the view goes to where the effect shows.
Disruptions
- Water shortage: Water is running short in town: the first homes are without water – people are moving away.
- Failed harvest: The fields are withering – the harvest fails, food becomes scarce and expensive.
- Fish die-off: The river is shallow and warm, oxygen is running out – the fish are dying.
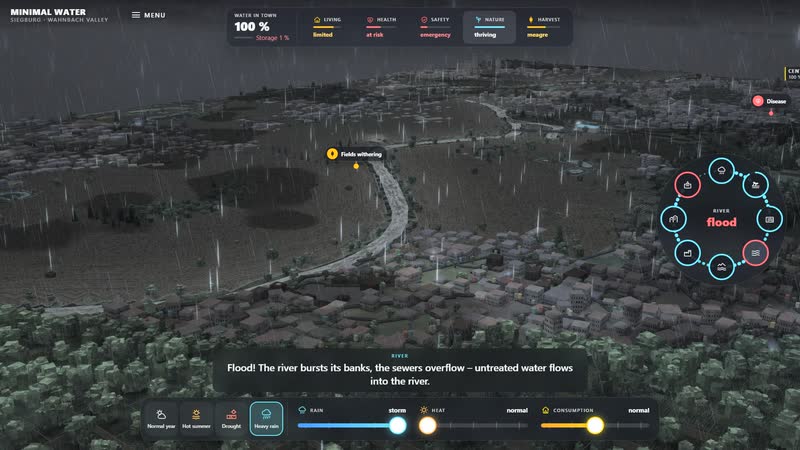
- Flood: Flood! The river bursts its banks, the sewers overflow – untreated water flows into the river.
- Health: Without enough clean water, health suffers: heat, poor hygiene, disease. Ambulances are on their way.
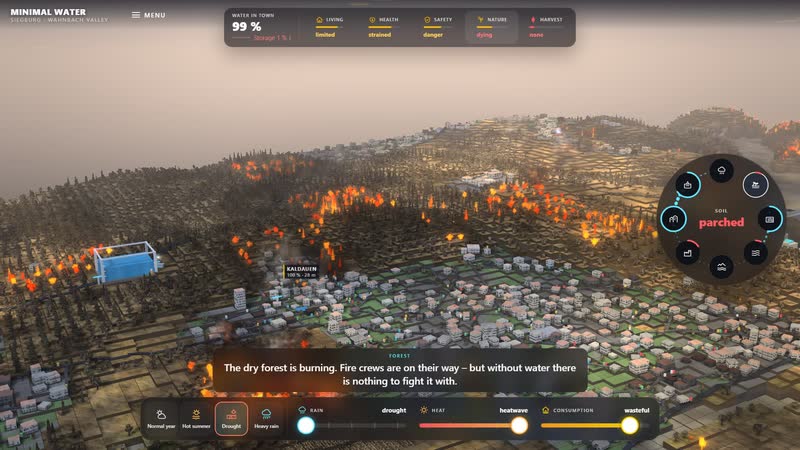
- Forest fire: The dry forest is burning. Fire crews are on their way – but without water there is nothing to fight it with.
- Tree dieback: The trees are dying. It takes decades for a forest to grow back.
- Lake almost empty: The reservoir is almost empty. It supported the river – now the water for dry times is missing.
- Pipe burst: Pipe bursts hit lines, never a single building; the storage carries the town until the crew has repaired the section.
- The extreme: Everything is parched: no water, no harvest, no trees, no animals. Life is no longer possible here.
What the model brings
-
01
The real valley as a stage
Reservoir, hill and floodplain stand on terrain from OpenStreetMap and elevation data. You show the valley as it lies, not as a diagram.
-
02
From dam to tap, step by step
Intake, treatment, downpipe, service reservoir and districts can be shown one by one. You understand the path before you change anything.
-
03
Situations without damage
Drought, heavy rain, pipe burst: you see where it gets tight first, and set it back. A pipe burst hits a pipe, never a single building.
-
04
In the browser, with one tap
The model runs in the browser. One tap sets rain, heat and consumption together to a weather situation.
-
Siegburg · Wahnbach valley: The Wahnbach reservoir stores drinking water only: it is treated on the Siegelsknippen and flows to the town, while wells in the Sieg floodplain add groundwater. -
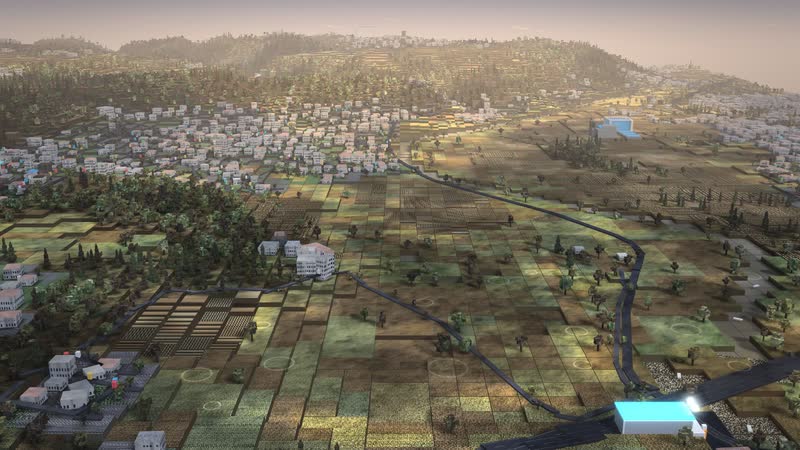
Siegburg · Wahnbach valley in the evening – low sun, long shadows, the water mirrors the sky. -
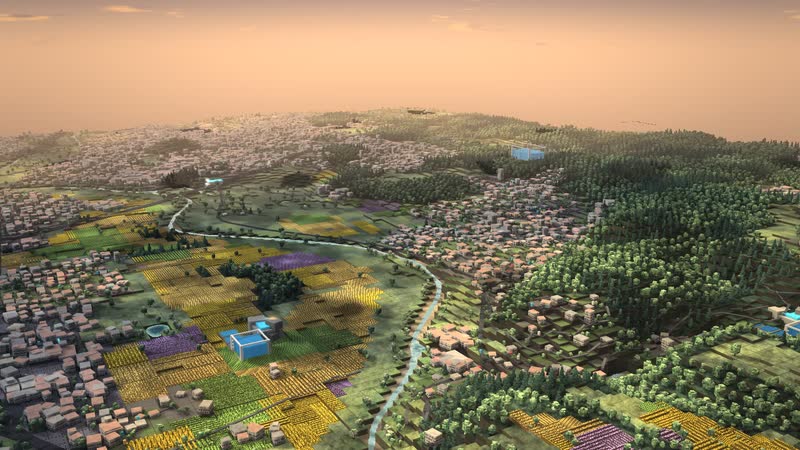
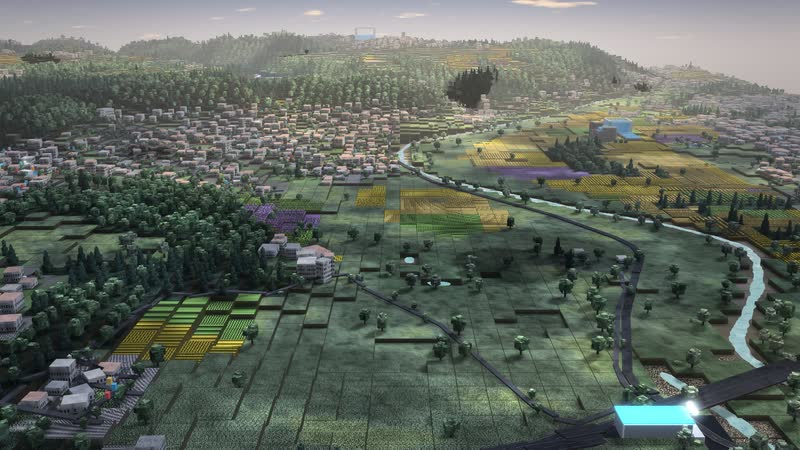
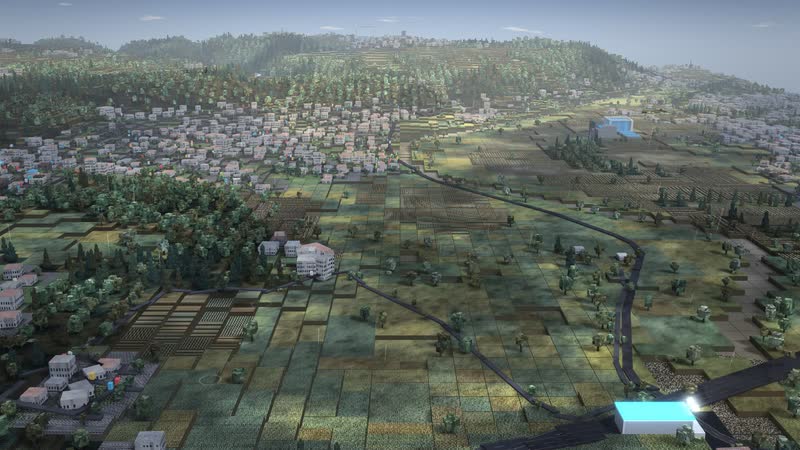
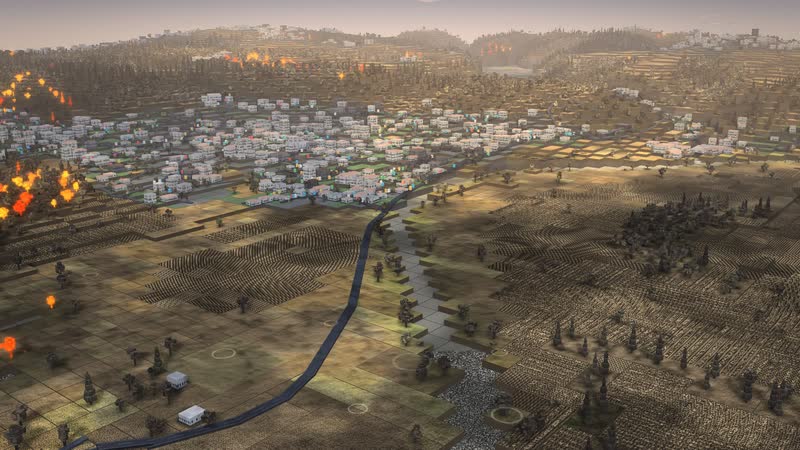
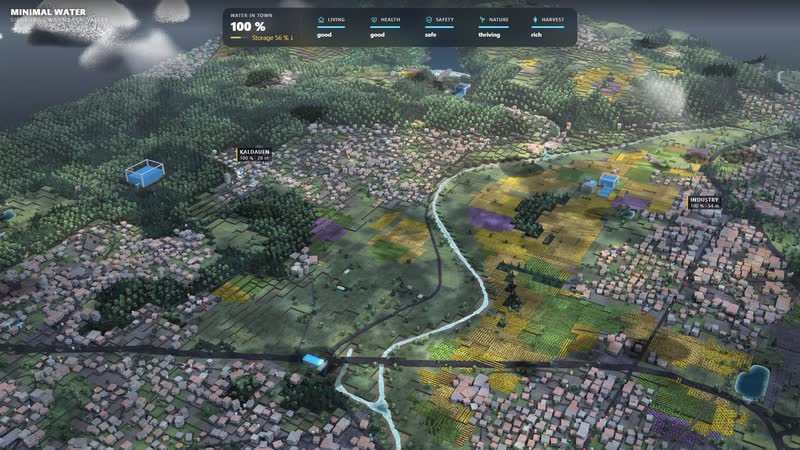
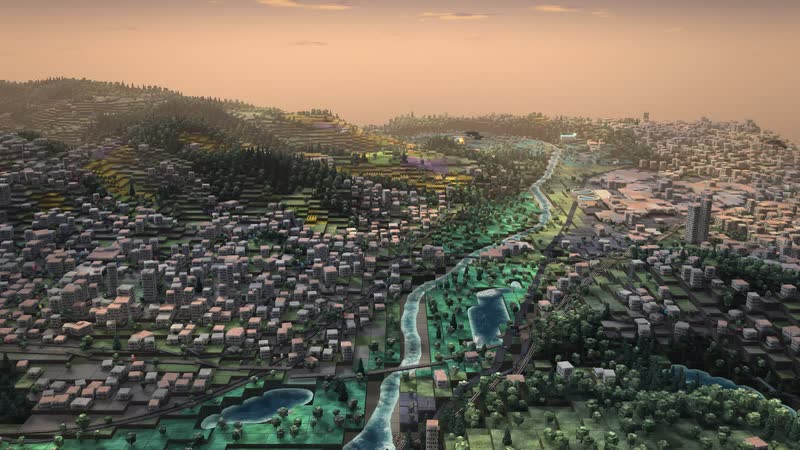
Morning in the Wahnbach valley near Siegburg – haze over the land, terrain and buildings come from elevation data and OpenStreetMap. -
The course – the lake backs up behind the dam, the water falls from the hill into the town; waves and foam move with the current in real time. -
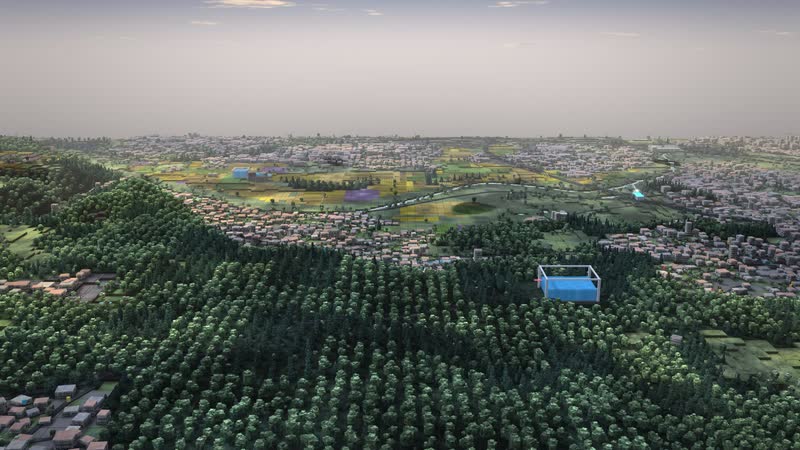
Far across the land – forest, fields and settlements hang on the same water. -
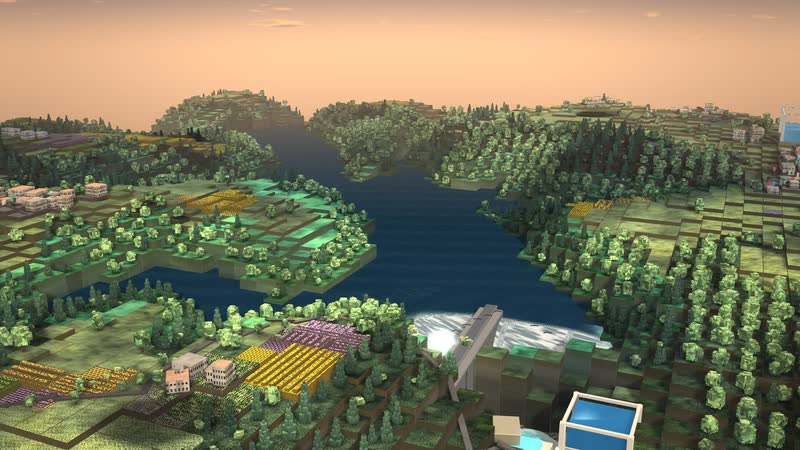
The lake as storage – it holds water for dry times; in the model its level sinks when the rain stays away. -
The lake backs up behind the wall – in the valley below runs only what the dam releases. -
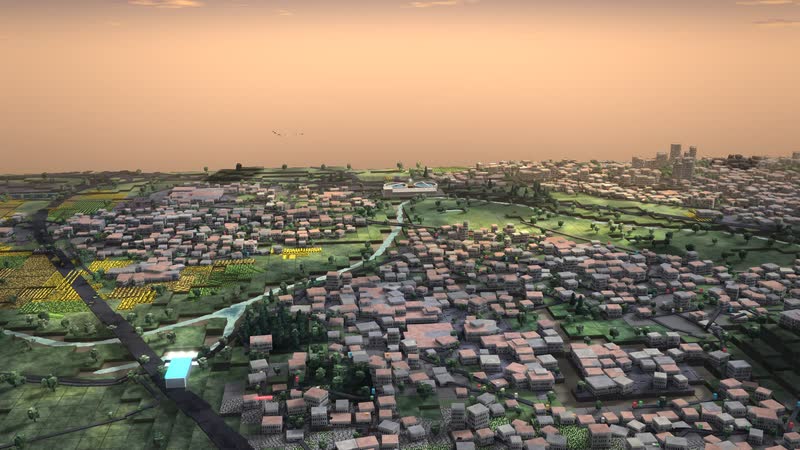
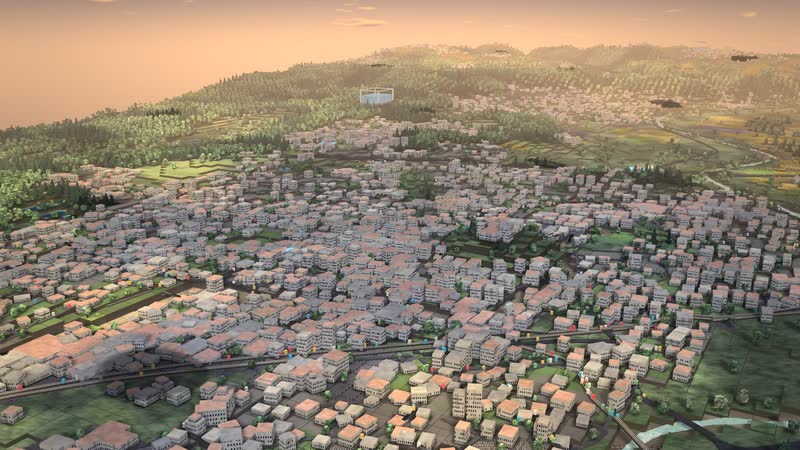
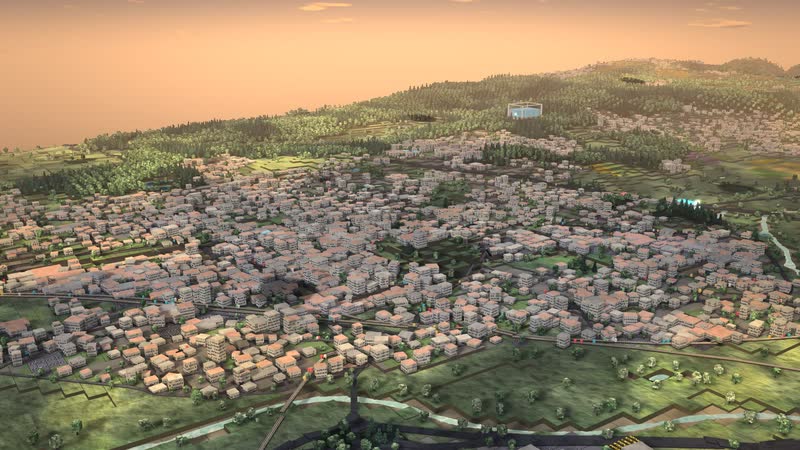
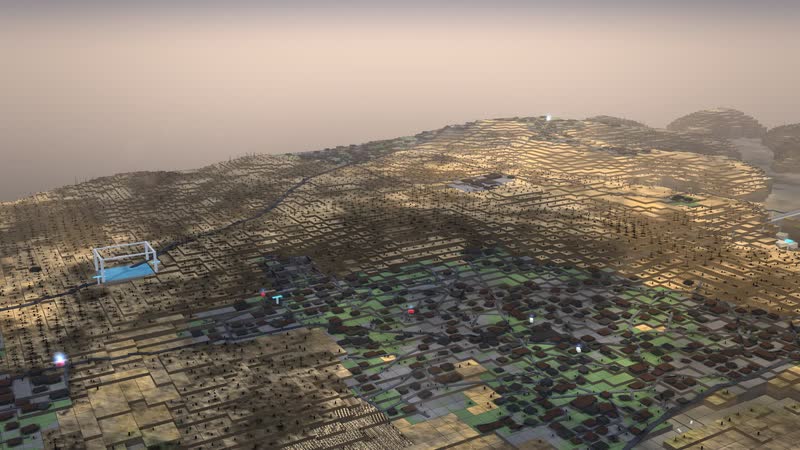
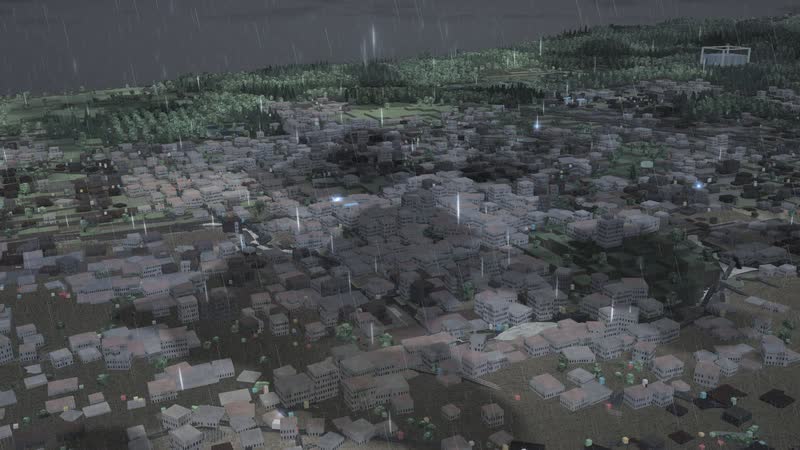
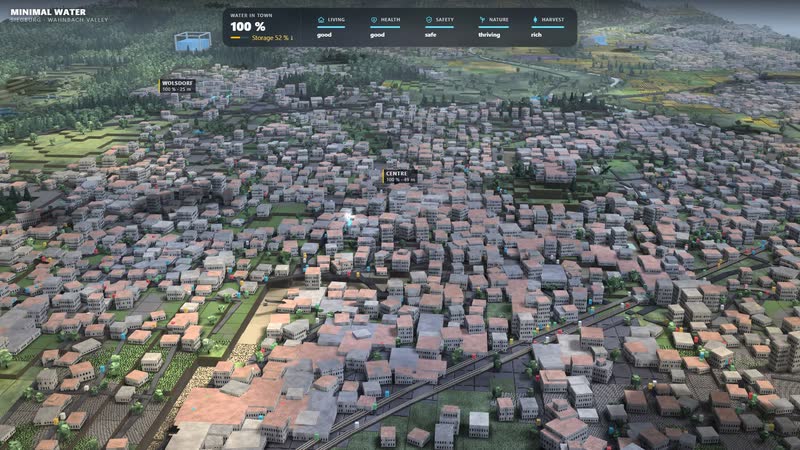
Town centre from outside – every house a block, warm in the evening light. -
Dusk in the Wahnbach valley near Siegburg – the houses grow darker, the last glow lies over the land. -
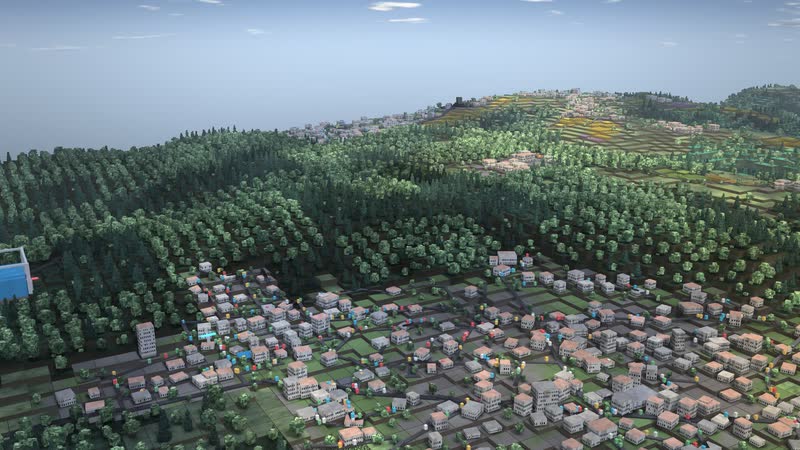
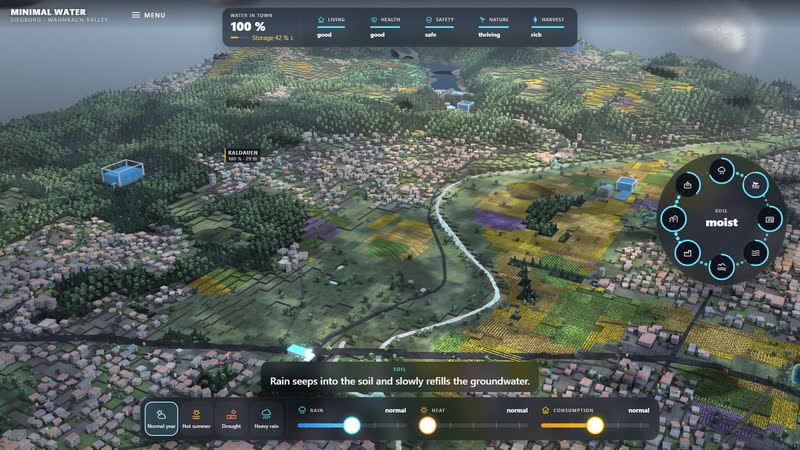
Forest – deciduous trees with trunk and crown, conifers in stands; here the cycle begins with the rain that stays in the soil. -
Fields and meadows – the rows grow with the harvest and wither in the drought; the soil is a sponge. -
The source – the water comes from the reservoir; its way into town starts in front of the wall. -
Wahnbach reservoir · intake – The lake stores the water of the Wahnbach. Below the dam raw water is drawn off – three quarters of the drinking water come from here, the rest from wells in the Sieg floodplain. -
Siegbogen groundwater works – Wells in the Sieg floodplain pump groundwater – a quarter of the drinking water. It is blended with the reservoir water. -
Siegelsknippen waterworks – On the hill the raw water is treated (simplified here) and collected in the clear-water tank. From here it flows by gravity to the town. -
Glowing pipes – the path of the water as one continuous line, the waves run with the speed and direction of the flow. -
Town centre – Siegburg's centre by the Michaelsberg, about 70 m – low, plenty of pressure. -
Wolsdorf – Residential area on the slope north-east of the centre, about 95 m. -
The treatment plant cleans the waste water and returns it to the river. In a storm it overflows. -
Back in the river – what has been cleaned flows back in; downstream the cycle starts again. -
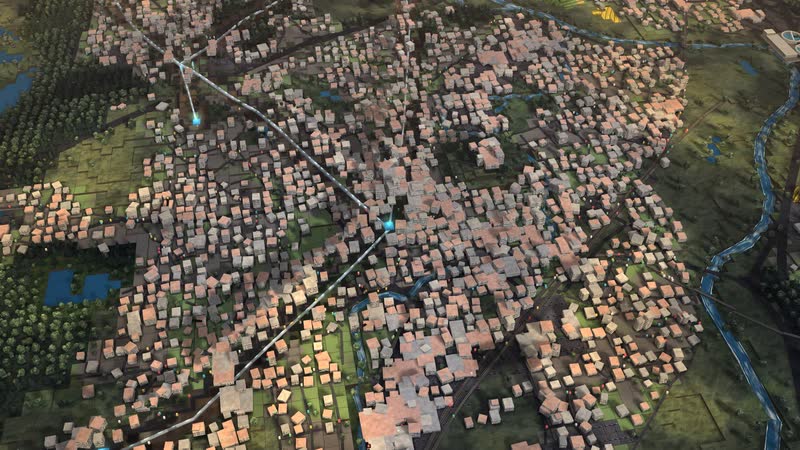
The city from within – pipes and connections: width by flow, light runs from the reservoir to the houses. -
Cross-section – the ground opens up, pipes lie exposed beneath the streets. -
Wastewater – From the house through the sewer to the plant. -
Rainwater – sealed surfaces drain off: what does not soak away runs over streets and through sewers. -
All at a glance – drinking water and sewer together: what flows into the houses runs out again below. -
The sewer ends at the treatment plant – in a normal year it cleans everything, in a storm it overflows. -
Hot summer – little rain, more evaporation: the soil dries out, people need more, the town’s storage sinks. -
Drought – the fields wither first: green turns to straw, the rows wilt, the harvest fails. -
Low water – the river carries very little, grows narrow and warm; oxygen runs short and the fish die. -
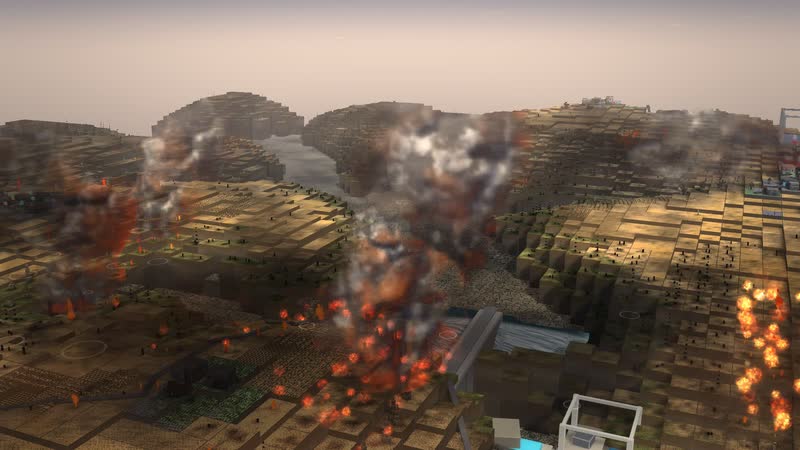
Forest fire – in drought and great heat a glowing front eats through the forest, rain puts it out. -
Smoke over the land – the fires carry dark columns, lit from within, visible from afar. -
The lake sinks – it has supported the river, the bed dries out from the shore; now the water for dry times is missing. -
What remains – fields and town recover quickly, dead and burnt forest stays visible for a long time. -
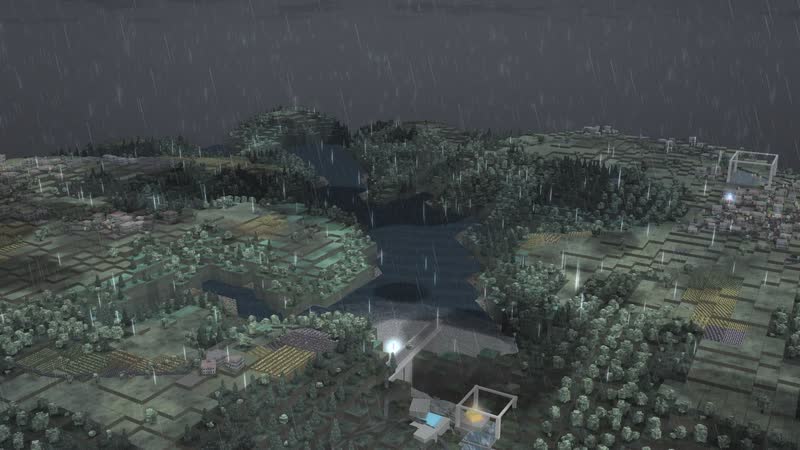
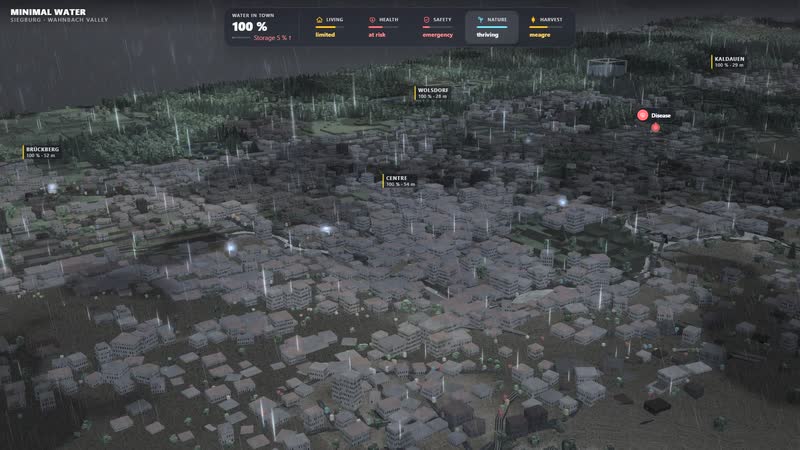
Heavy rain – it grows dark, dense rain sweeps over the land, the soils soak up all they can. -
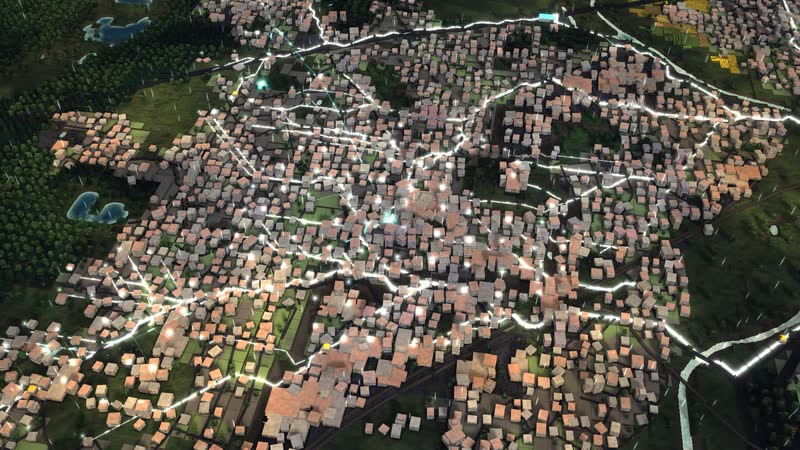
Thunderstorm – lightning in view, the cloud lights up from within around the strike, the cover tears open along the line of sight. -
Flood by contour lines – the floodplain and low-lying districts fill up bit by bit, with a dirty rim of foam. -
Water among the houses – what lies lowest floods first; the model reaches up to six metres above mean water level. -
Pipe burst – the line pulses red, water escapes; a crew is called out. -
Shut off – a crew drives out, the section stands still, the storage carries the town until the repair is done. -
The districts by name – above the map stand the quarters, at the top water in the city, storage and the five consequences. -
Town centre and the neighbouring districts – each name shows with a bar how well the district is supplied. -
Signs on the map – when a consequence turns critical, its sign stands where it happens: fields wither, forest dies, no water. -
Flood in figures – safety and harvest fall, the sign by the river stands over the spot that fills first. -
Treatment plant and inflow – on the sewer it says how much is arriving and whether it overflows. -
The whole software – at the top water in the city and five consequences, on the right the wheel of the cycle, below four weather situations and three levers. -
Hot summer with one tap – the levers visibly move there, the camera follows the effect, below a sentence explains what is happening. -
One lever, visible at once – consumption set to wasteful: the town needs more, the storage sinks, an arrow at the top shows the direction. -
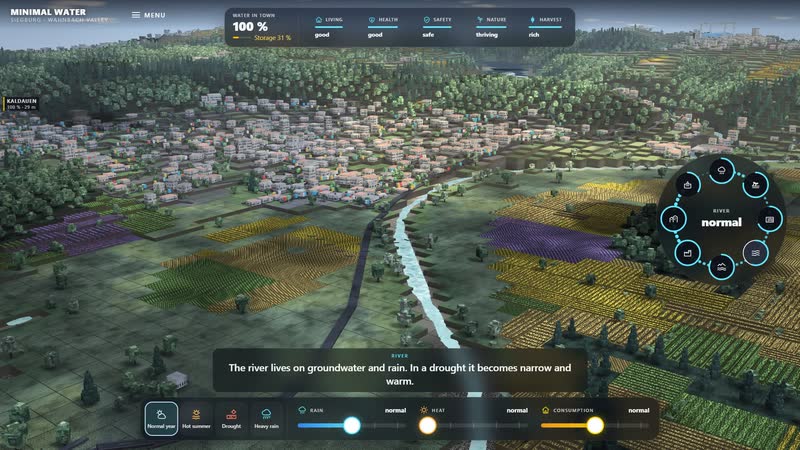
The wheel explains – station River tapped: The river lives on groundwater and rain. In a drought it becomes narrow and warm. -
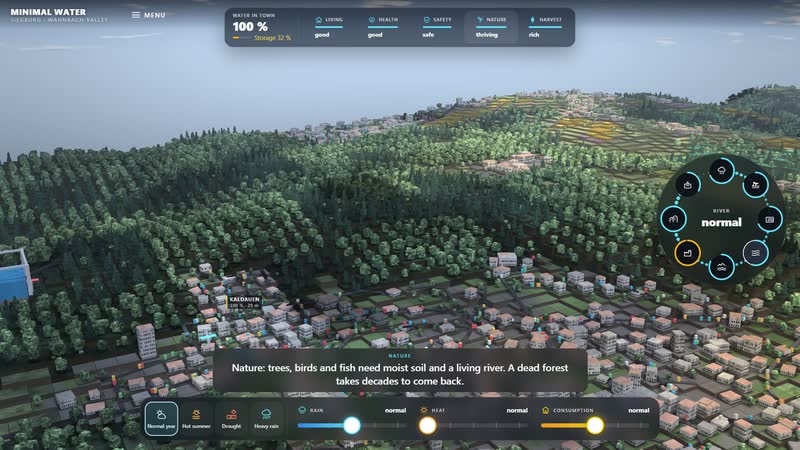
Tap a consequence – Nature: the bar at the top explains what water means for people and nature. -
Drought in the interface – the consequences turn red, signs stand on the map, the subtitle says what comes next. -
Heavy rain in the interface – soil and river on the wheel rise, the flood sign stands by the river, safety falls. -
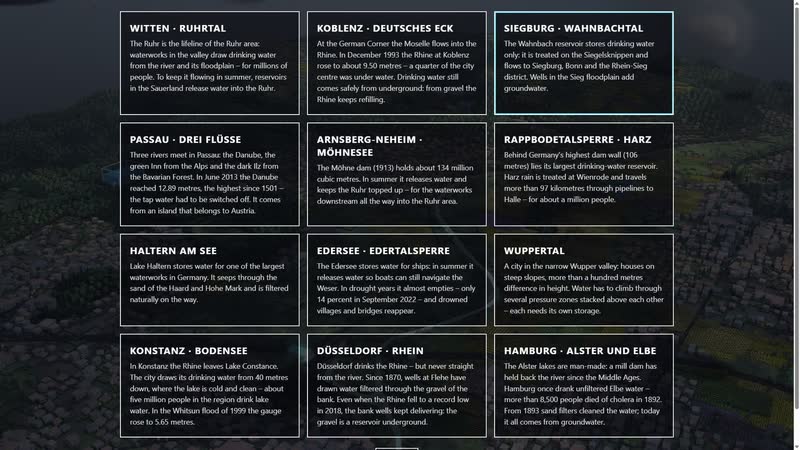
Twelve water landscapes – confluences, dams and large lakes across Germany, each in its real place. -
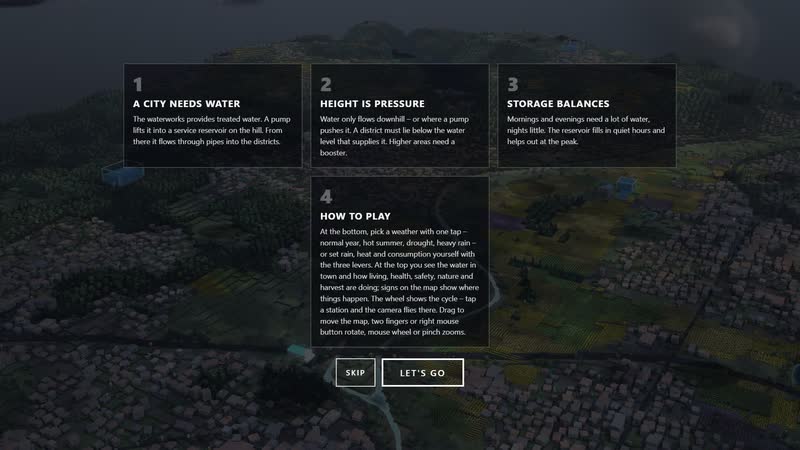
The introduction – four cards say what it is about and how to use it.
Your area as a model
Would you like to show your area, your museum or your school like this? Write to us or call. We will send you the password for starting it on request.
cube4tec.de/spiele/minimal-water/
Poser une question à ce sujet
Minimal Water: Siegburg · Wahnbachtal – ein Stausee nur für Trinkwasser
Basis and limits
Terrain and buildings: © OpenStreetMap contributors (ODbL), elevation: Mapzen/Tilezen Terrain Tiles (SRTM, EU-DEM). Facility locations follow OpenStreetMap; pipe network, sizes, demand and reservoir operation are invented and simplified. Simplified educational model – not a real control system and not a planning tool.
Public sources the model is based on:
- Terrain and buildings: © OpenStreetMap contributors (ODbL)
- Elevation: Mapzen/Tilezen Terrain Tiles (SRTM, EU-DEM)
More areas in the model
Real are location, terrain and buildings (OpenStreetMap, heights from SRTM and EU-DEM). The pipe network, sizes, demand and dam operation are invented and simplified, and the shares of dam and floodplain are model assumptions. It is not an operations control and not a planning tool. With your data,…