
Simulación · Minimal Organization · Digital platforms
Cloud provider
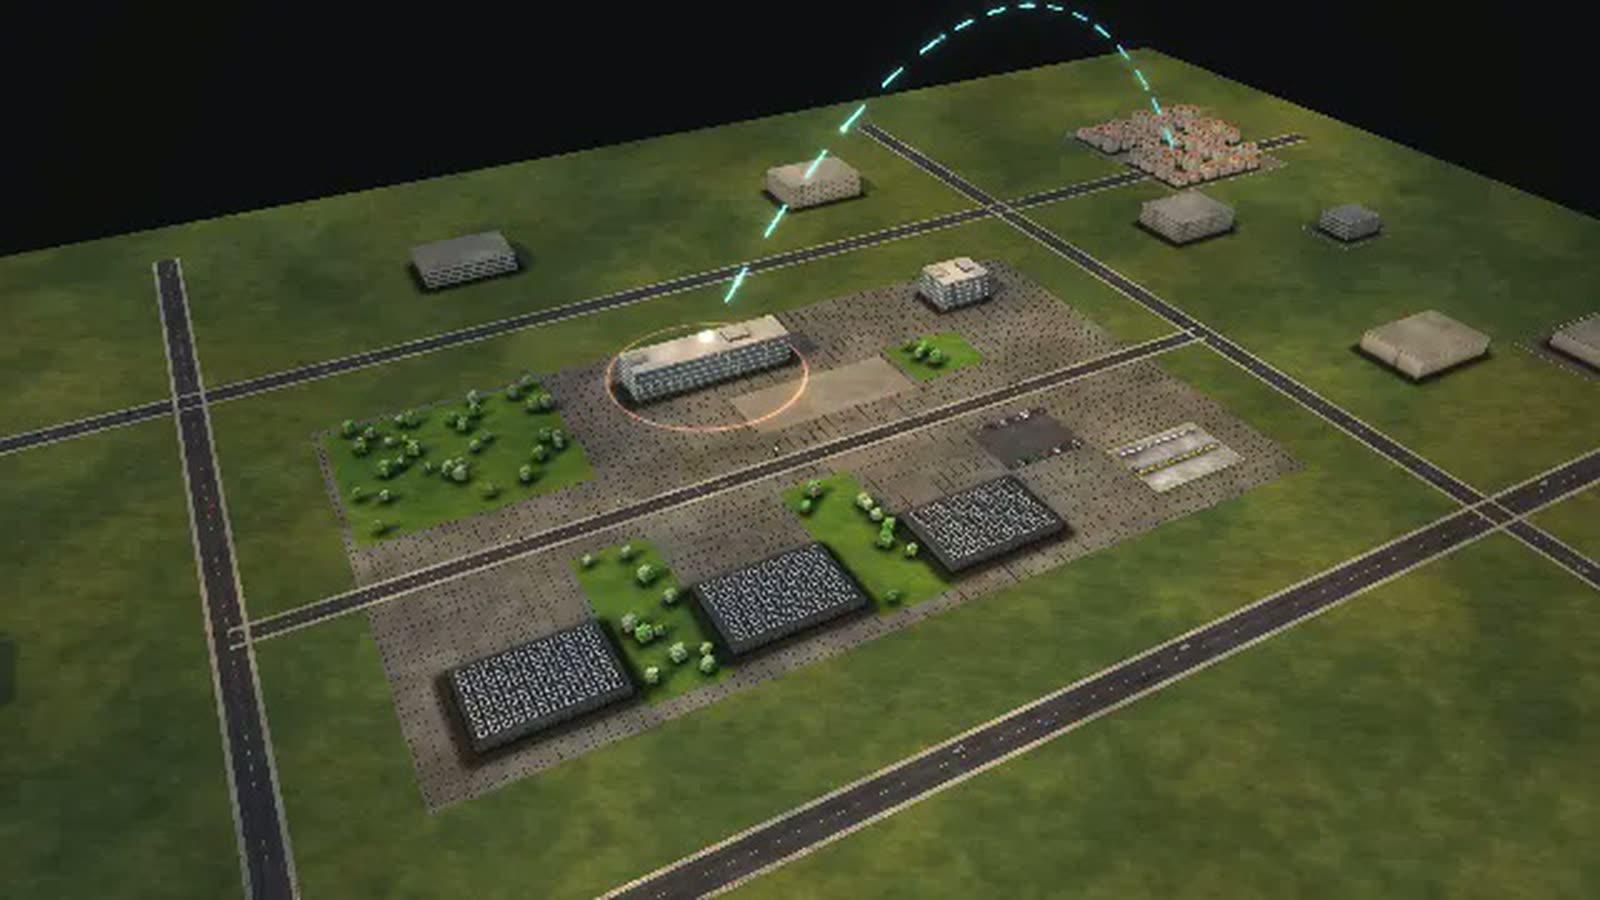
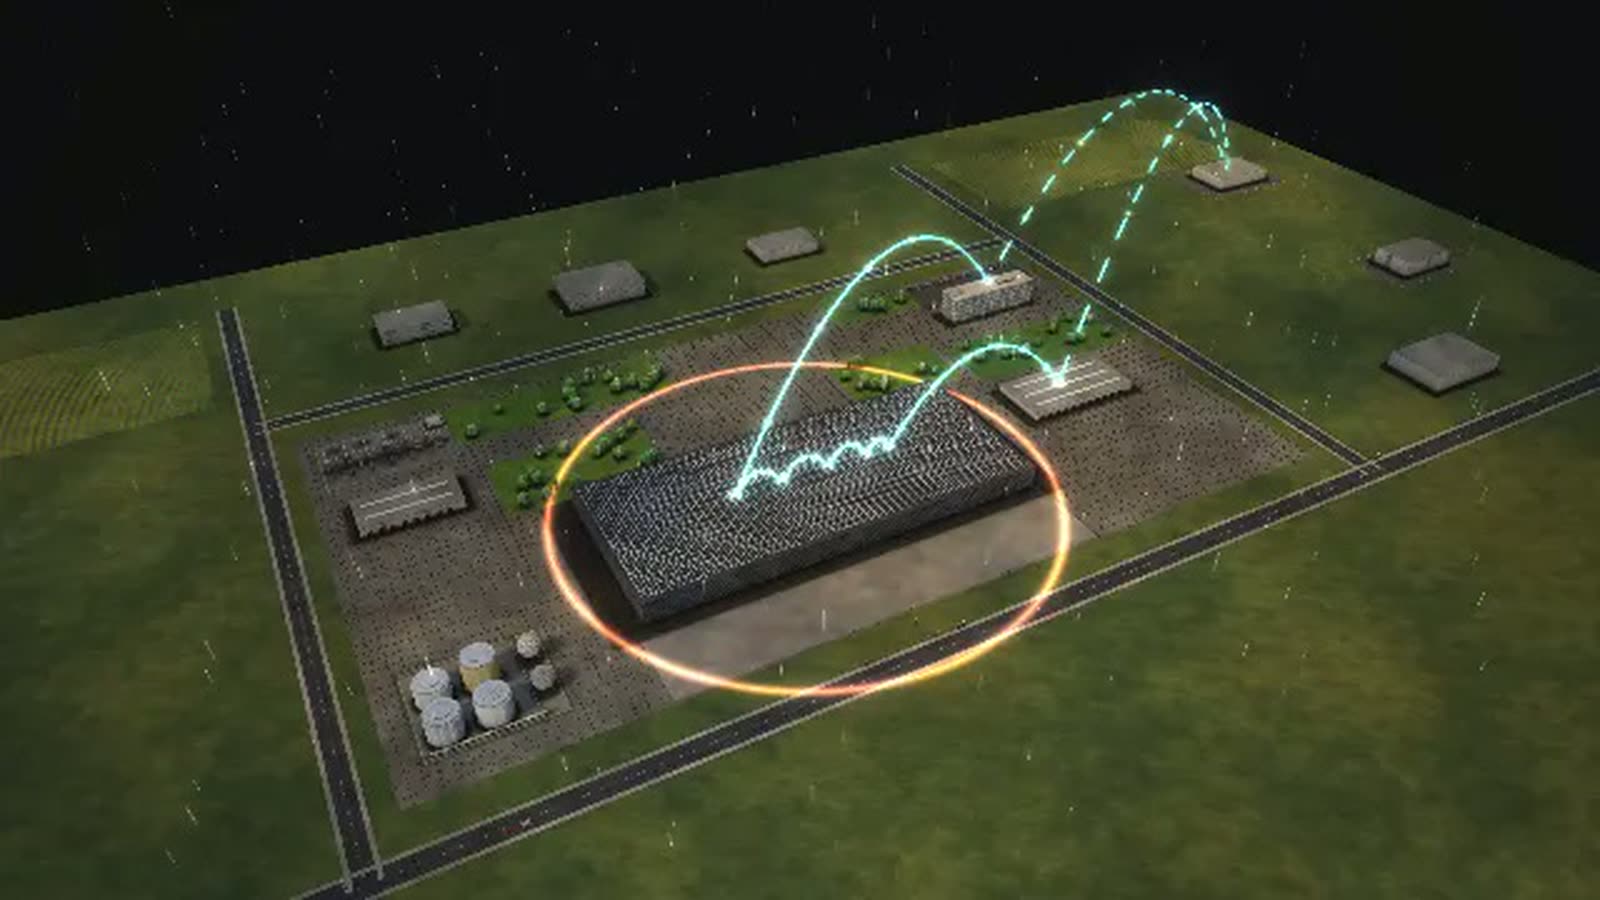
A cloud provider as a walkable model: support cases, zone outages and new data centres on three time scales, in a running simulation.
All data are fictional; NIMBORA is not modelled on any provider. The model can be fitted to your company's real data and then shows what is scattered today: ticket volumes and escalation rates per service, or load and error budget per zone, live.
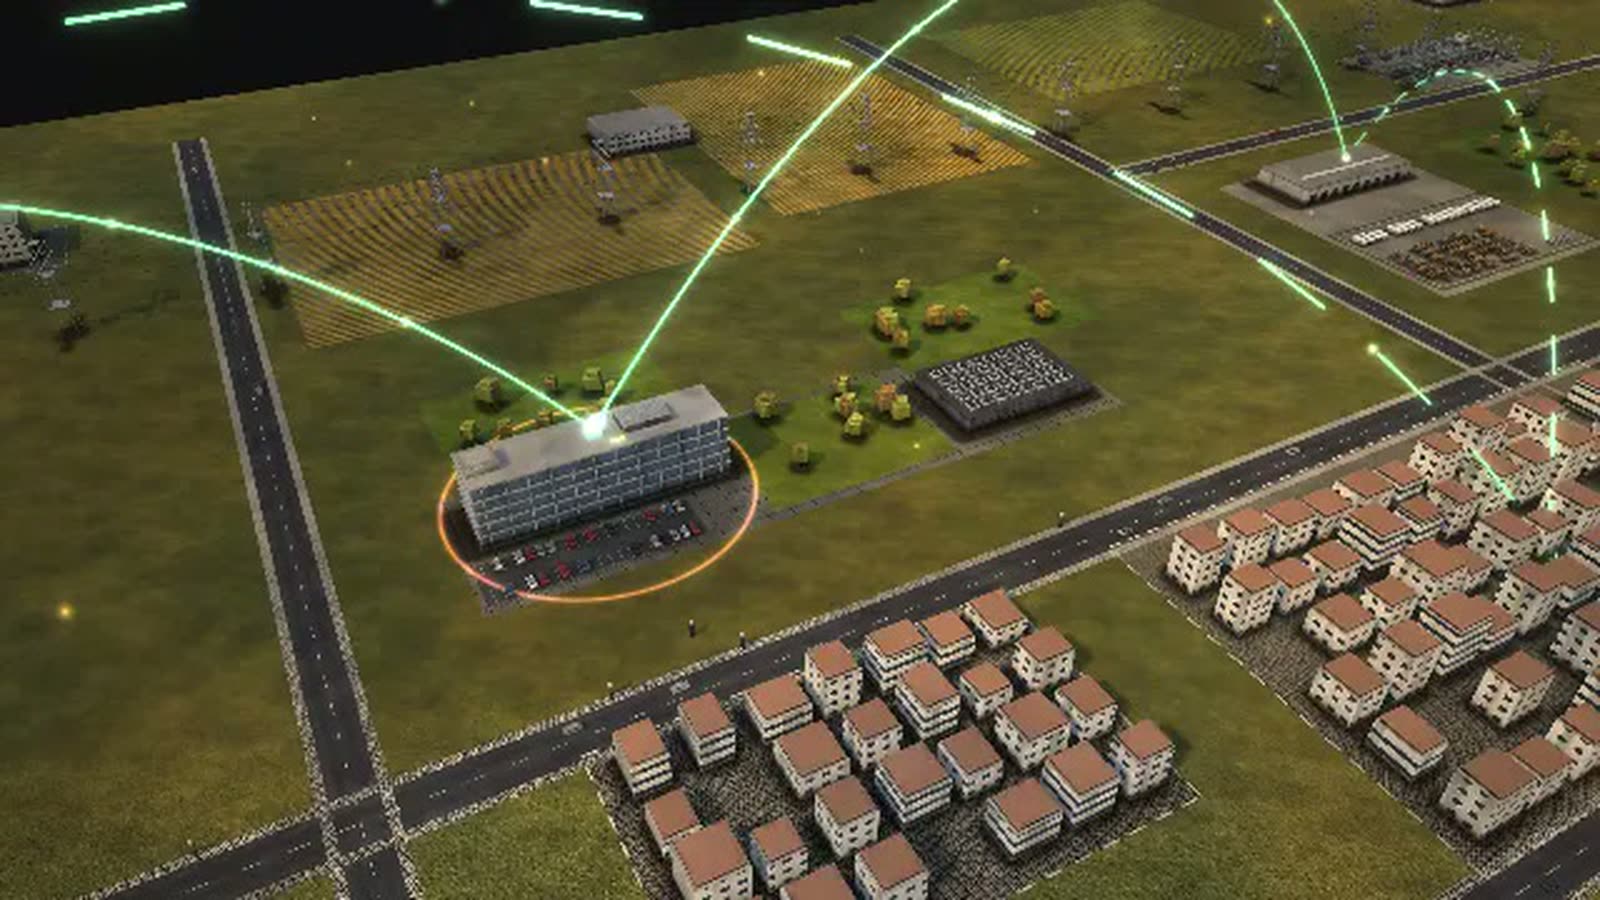
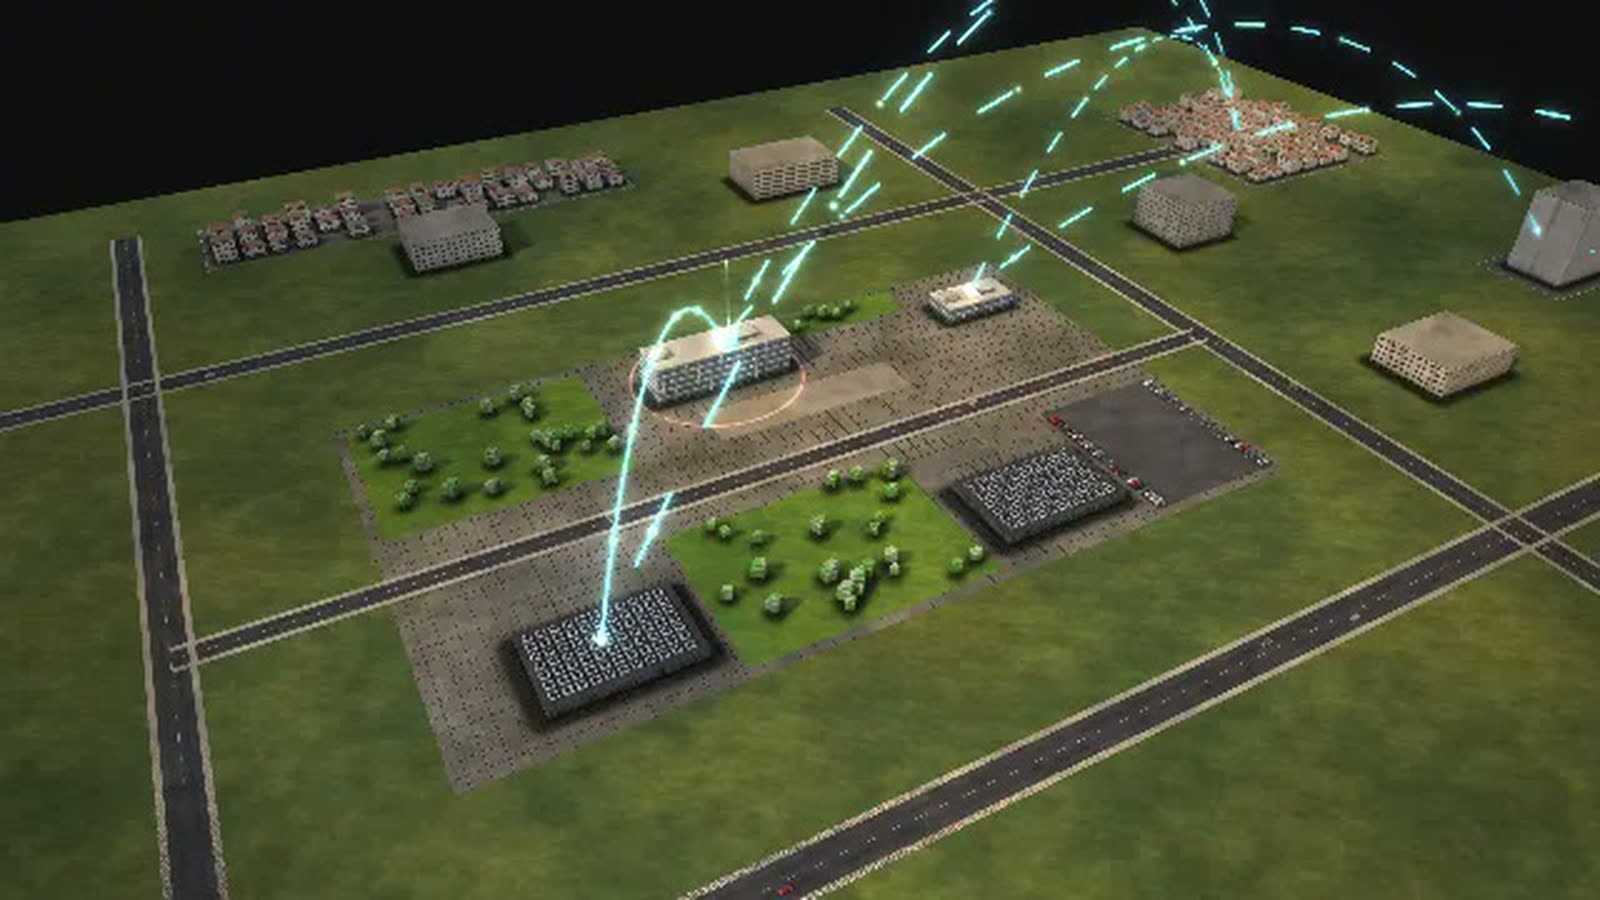
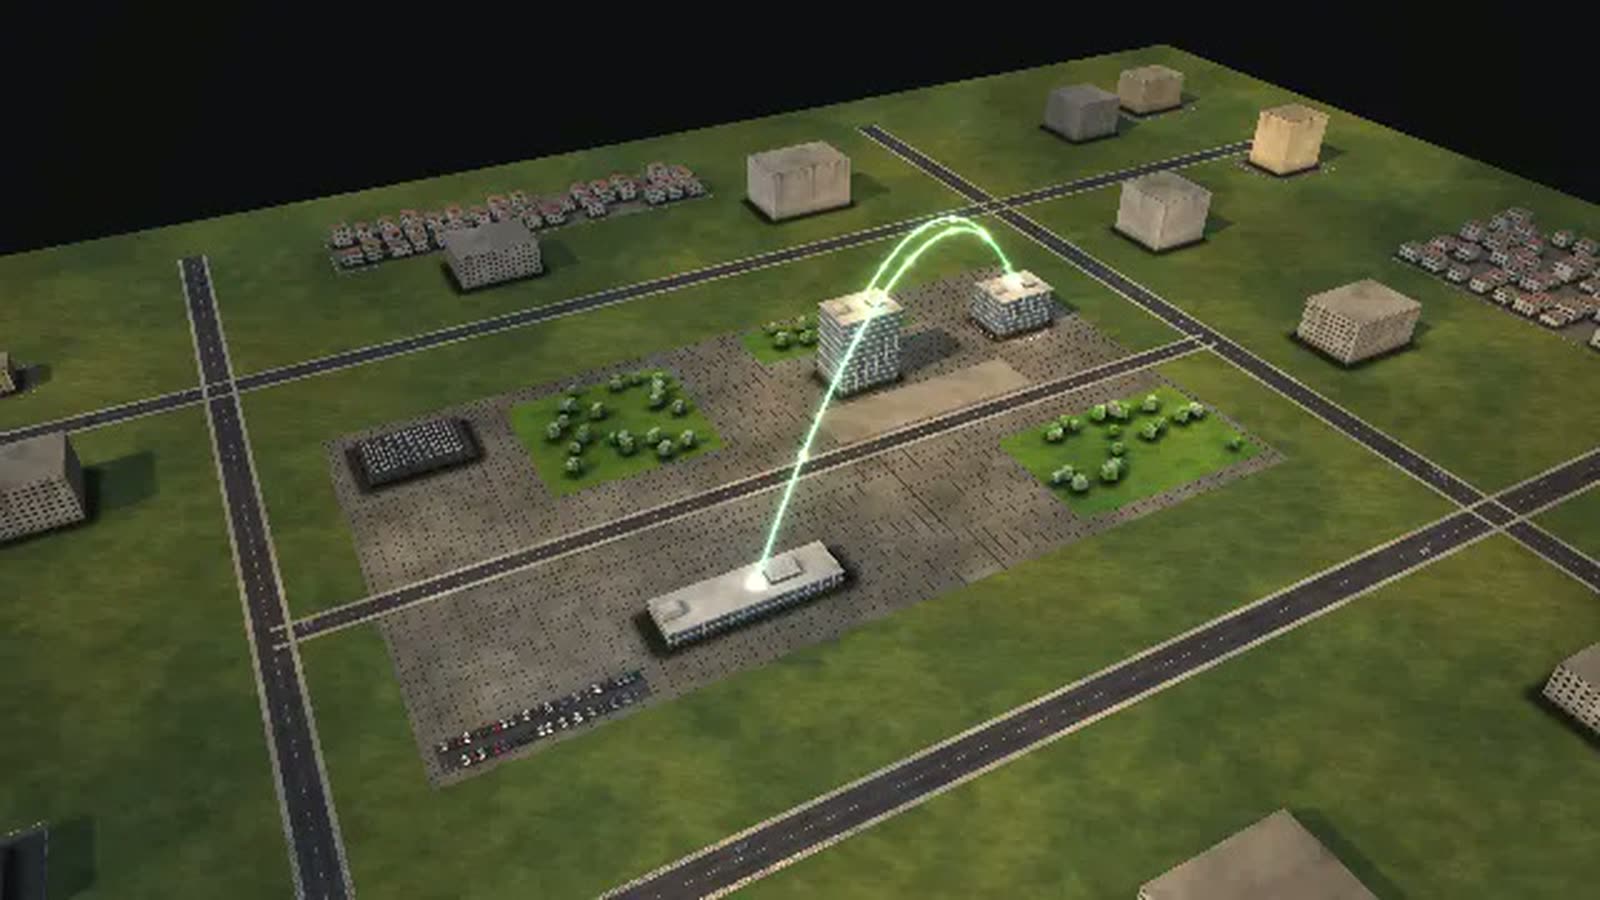
How does the cloud support escalation process work in practice? NIMBORA, a fictional cloud and enterprise software provider, shows it on three time scales: computing by the minute, support cases by the hour, new data centres by the year. In the main process a customer reports that their database is responding slowly. The case moves from first line to specialists and on to the service engineers – and waits whenever the customer has to supply details.
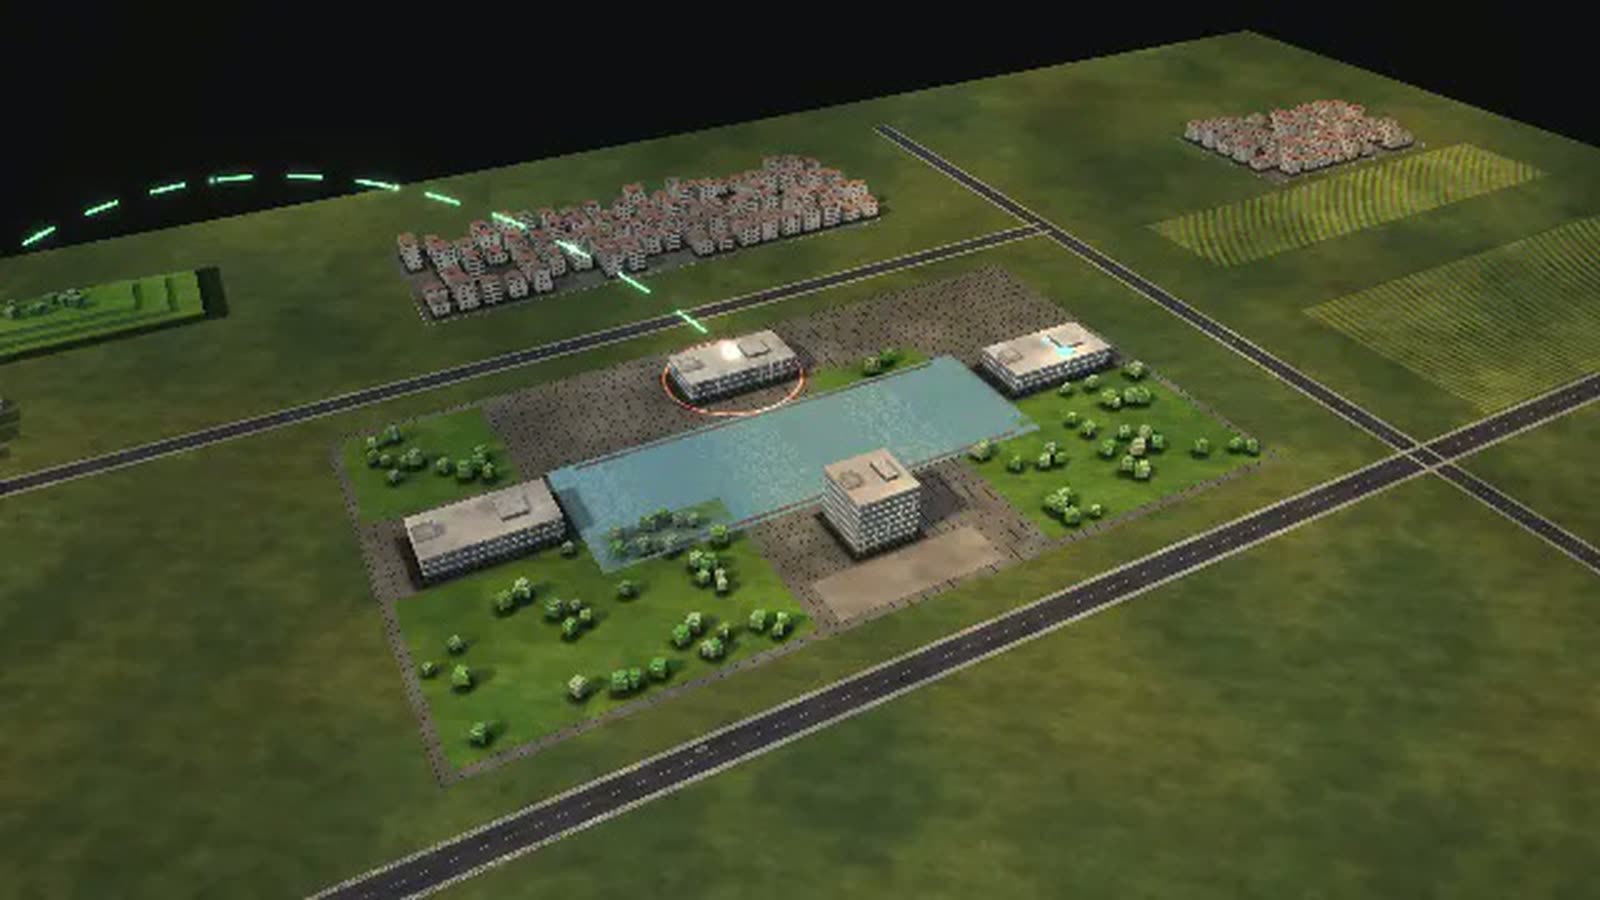
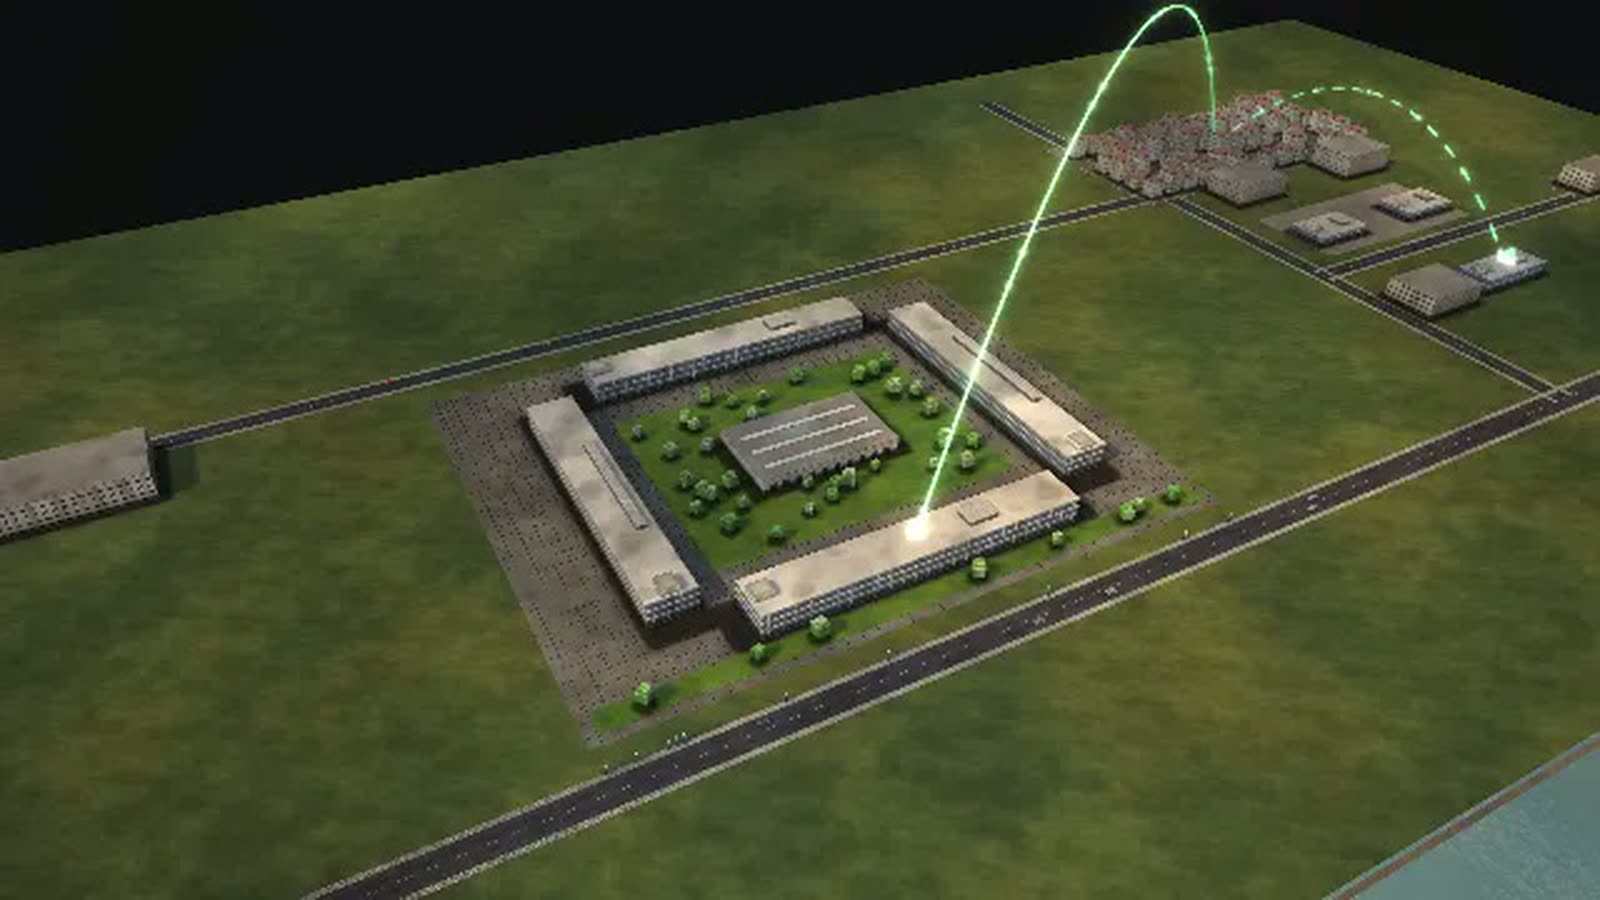
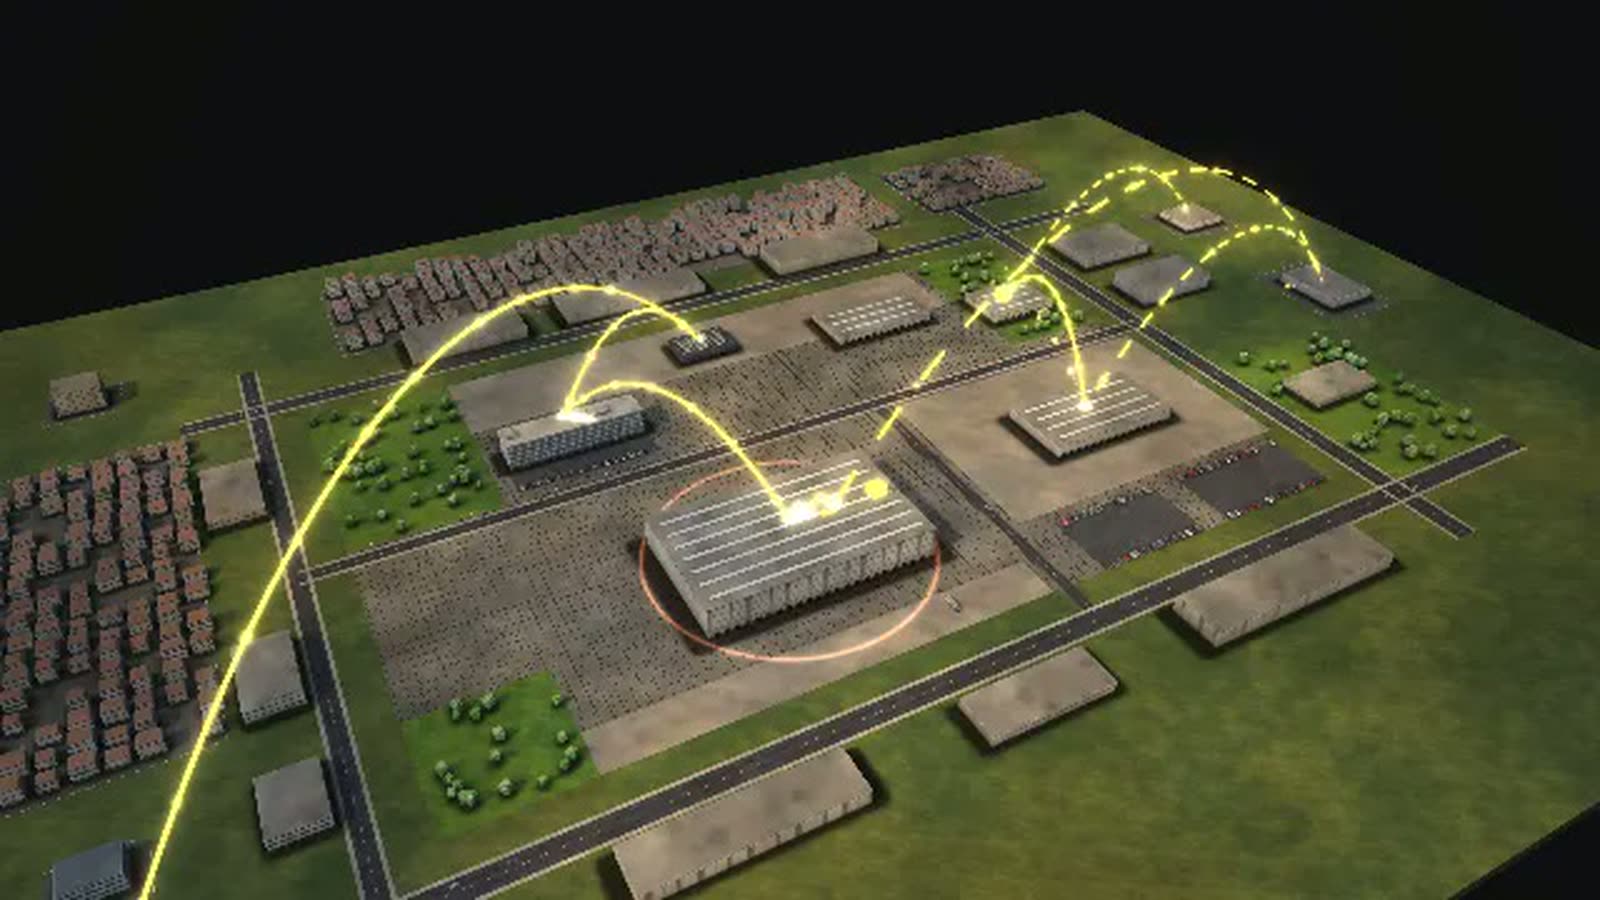
The site holds the engineering campus, the sales house, zones A, B and C, and a substation with fuel depot. When zone B goes down, many services are hit at once and the incident room works on several incidents in parallel. A change freeze when the error budget is spent means fewer outages, but new features arrive later. Alongside, a large customer moves to the cloud and a new data centre waits for its grid connection.
This page is for people at a cloud or software provider who run support, operations, sales or strategy – or have to explain them to others.
A customer needs help
- 01
Customer reports a problem: A customer reports: the database responds slowly.
- 02
Support first line: The first line solves known problems itself.
- 03
Support specialists: Specialists analyse logs and configuration.
- 04
Customer provides details: The customer provides details.
- 05
Service engineers: The service engineers look for the bug in the code.
- 06
Solved.
How a cloud provider can use the model
-
Internal communication
Support, service teams and the incident room work closely together, while sales sits in its own building next door. The diagram ‘Who works with whom’ makes that closeness and distance visible to everyone.
Para quiénLeadership, engineering management, internal comms
-
Onboarding
New solution architects and sales staff see in the collaboration view who brings a large customer to the cloud: proof of concept, security questionnaire, deal desk, migration with a partner.
Para quiénSales, solution architects, customer success
-
Training
The disruption ‘Zone B goes down’ and the process ‘A service fails in one zone’ put the incident room under load: on-call, incident commander, status page, blameless postmortem.
Para quiénIncident leads, on-call engineers, new SRE teams
-
Explaining to customers
Business customers see where the 24-hour target is lost: waiting for their own details, or waiting for the engineers. The diagram ‘Where the time goes’ shows both.
Para quiénAccount management, customer success
-
Strategic overview
More specialists or better documentation? ‘What each control does’ compares the two. The process ‘A new data centre is built’ shows why half a year of grid bottleneck pushes new capacity back.
Para quiénBoard, strategy, capacity planning
What is shown – why – for whom
| Qué se muestra | Por qué | Para quién |
|---|---|---|
| Path of a support case through first line, specialists and engineering (Processes view) | Por quéShows how often and where cases are escalated. | Para quiénHead of support, account management |
| Diagram ‘What each control does’: documentation, specialists, change freeze | Por quéCompares more staff with better tools. | Para quiénEngineering management, finance |
| Diagram ‘Where the time goes’: waiting for customer details and engineers | Por quéShows where the 24-hour target is lost. | Para quiénHead of support, account management |
| Diagram ‘What the work depends on’: zones A, B, C and power supply | Por quéShows which services a zone outage hits. | Para quiénOperations, risk management, supervisors |
| Disruption ‘Zone B goes down’ on the site | Por quéShows the incident room under load. | Para quiénIncident leads, training |
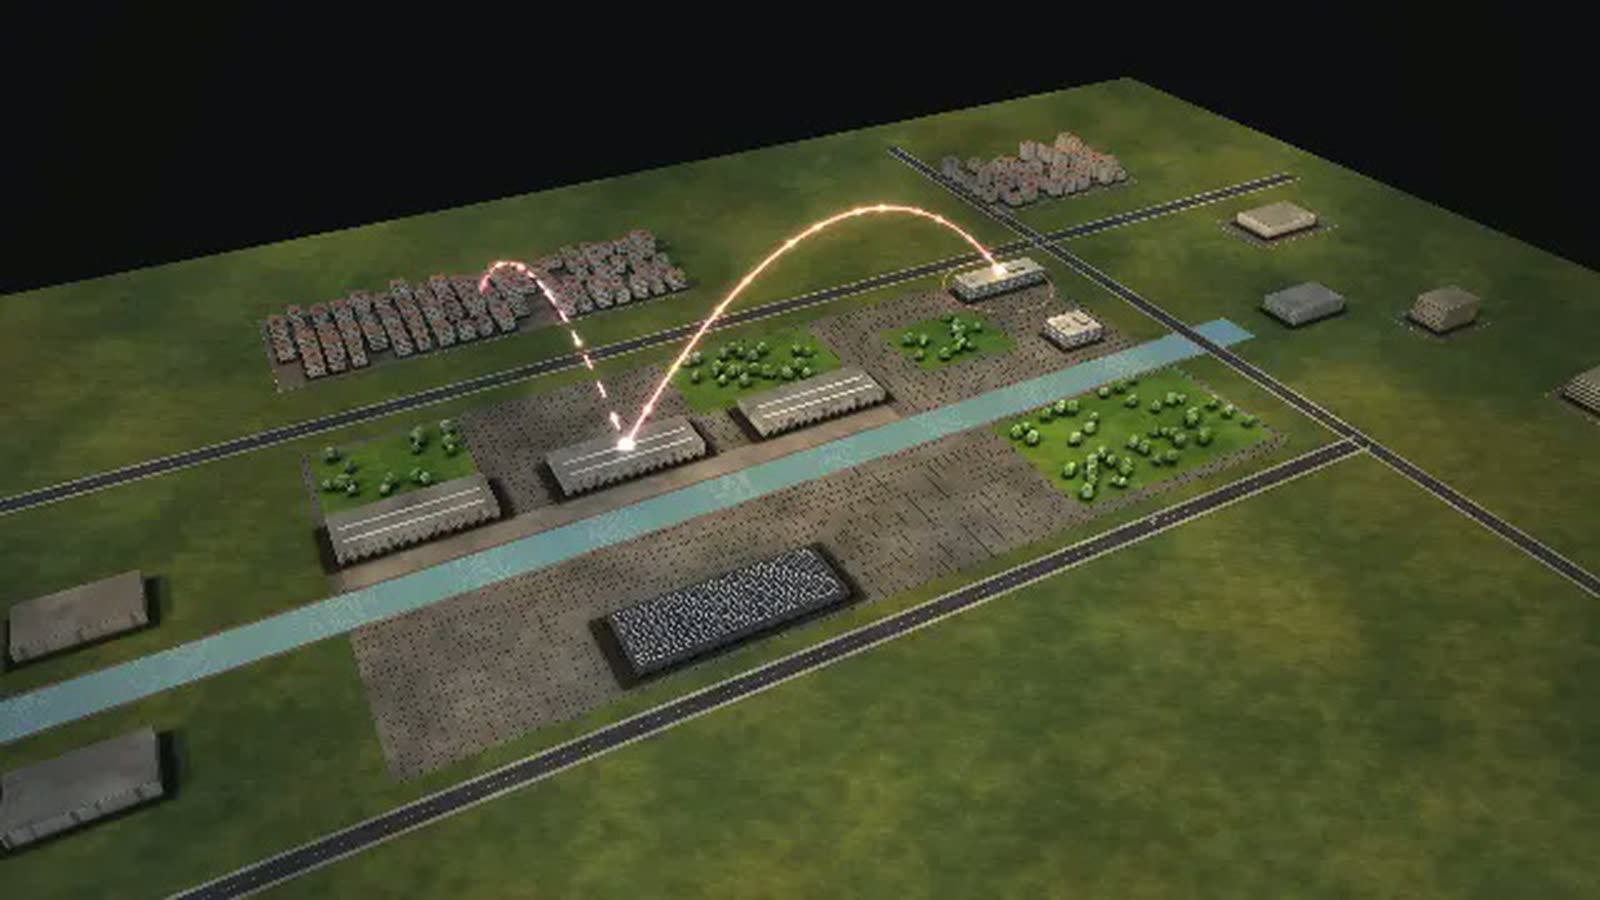
| Process ‘A new data centre is built’ with the disruption ‘Grid bottleneck’ | Por quéExplains the years between demand and capacity. | Para quiénStrategy, site planning |
| Collaboration view between engineering campus and sales house | Por quéShows who brings a large customer into the cloud. | Para quiénSales, onboarding |
Departments in the model
-
Board
Leads products, regions and sales.
-
Service teams compute and storage
Build and run their services themselves: you build it, you run it.
-
Service teams data and AI
Databases, analytics, AI services.
-
Operations (SRE)
On-call, incident room, capacity; measures availability against error budgets.
-
Security
Security operations around the clock, vulnerabilities, customer questionnaires.
-
Compliance and certification
Attestations to C5 and ISO 27001, requirements of financial customers.
-
Data centres and energy
Sites, power, cooling, construction.
-
Data centre operations
Install servers, replace faulty parts, patrol the halls.
-
Capacity planning
Calculates years ahead how much computing power will be needed.
-
Sales
Wins large contracts with minimum commitments.
-
Solution architects
Build the proof of concept with the customer.
-
Customer success
Accompanies customers after signing as usage ramps up.
-
Support
Three tiers: first line, specialists, then the service engineers.
-
Finance and deal desk
Usage billing, discount approvals, credits.
-
Legal
Contracts, data protection, outsourcing clauses.
All processes in the model
A customer needs help
- 01Customer reports a problem: A customer reports: the database responds slowly.
- 02Support first line: The first line solves known problems itself.
- 03Support specialists: Specialists analyse logs and configuration.
- 04Customer provides details: The customer provides details.
- 05Service engineers: The service engineers look for the bug in the code.
- 06Solved.
A service fails in one zone
- 01Alert: error budget burning: Monitoring fires: too many errors, the error budget is burning.
- 02On-call responds: On-call is paged and assesses severity.
- 03Incident commander takes over: An incident commander takes over; roles are assigned.
- 04Mitigation and communication run in parallel.
- 05Roll back or drain the zone: The service team rolls back the change or drains traffic from the zone.
- 06Status page and customer info: The status page is updated.
- 07The service runs again.
- 08Recovery and data reconciliation: Data is reconciled, the zone comes back.
- 09Blameless postmortem: Blameless postmortem: what do we learn?
- 10Service credit: Customers receive a contractual credit.
- 11Closed.
A large customer moves to the cloud
- 01Qualify the need: Sales checks: an insurer wants to close its data centres.
- 02Proof of concept and security questionnaire run in parallel.
- 03Proof of concept with the customer: Solution architects build a proof with the customer.
- 04Security questionnaire: Hundreds of questions on encryption, access, audits.
- 05Proof and security passed.
- 06Contract negotiation: Sales, legal and finance negotiate prices and clauses.
- 07Discount approval (deal desk): The deal desk approves the discount – or sends it back.
- 08Lost.
- 09Customer procurement signs: The customer's procurement signs – often at quarter end.
- 10Migration with a partner: A partner moves the applications.
- 11Usage ramps up: Customer success accompanies, usage grows.
- 12Won.
A new data centre is built
- 01Demand forecast: Capacity planning sees: in three years there will not be enough space.
- 02Choose a site: A site with power, fibre and land is sought.
- 03Grid connection and building permit run in parallel.
- 04Grid connection from the grid operator: The grid operator builds the connection.
- 05Municipal approval: The municipality approves.
- 06Connection and permit in place.
- 07Construction and hardware ordering run in parallel.
- 08Construction of the halls: A general contractor builds the halls.
- 09Order servers and chips: Servers, chips and network are ordered.
- 10Hall stands, hardware here.
- 11Installation and burn-in: Data centre operations install and burn everything in.
- 12Release to customers: SRE releases the new capacity to customers.
- 13Opened.
What you can change
Controls
- Customer load: After a product launch many more questions come in.
- Documentation and tools: The first line solves more cases itself (model assumption).
- Support specialists: How many cases the second line handles at once.
- Change freeze when the error budget is spent: Fewer changes, fewer outages – new features come later.
Disruptions
- Faulty configuration rolled out globally: For four hours five times as many tickets, specialists take longer.
- Zone B goes down: For two hours many services are hit at once: the incident room works on several incidents in parallel.
- Grid bottleneck: For half a year every new grid connection takes twice as long.
What the model gives a cloud provider
-
01
Minutes, hours, years
Computing time, support cases and data-centre construction run in one model, which shows why capacity is planned years before it is needed.
-
02
Levers, not gut feeling
The simulation runs queues at first and second line. Controls for documentation, specialists and change freeze show their effect straight away in the diagram.
-
03
Outages without the risk
Trigger ‘Faulty configuration rolled out globally’ or ‘Zone B goes down’ and watch the response unfold – without a single customer noticing.
-
04
Dependencies laid out
‘What the work depends on’ shows zones and power supply as one chain – useful when operations, risk management and supervisors sit at the same table.
-
05
On the big screen
Walkable in the browser and on large projections, with a guided tour on first start – for all-hands meetings, customer workshops or the boardroom.
Basis and limits
Fictional cloud provider · model based on researched industry structures · no forecast for real companies
1 case = 10 support cases, 1 incident, 1 enterprise deal or 1 data centre · 1 figure ≈ 30 employees
All volumes, durations, rates and capacities are model assumptions, not values of a real provider.
The source on regions and zones describes a common principle; NIMBORA is not modelled on any provider.
Documented: error budgets and incident roles as a method, C5 security attestation, oversight of critical IT providers under DORA.
Public sources the model is based on:
- BSI C5 Kriterienkatalog Cloud Computing
- Verordnung (EU) 2022/2554 (DORA)
Your cloud as a model
Would you like to see your support tiers, zones or expansion plans like this? Write or call us and we'll discuss which systems the model should draw your figures from. The password to open NIMBORA is available on request.
cube4tec.de/spiele/minimal-organization/
Preguntar sobre esto
Minimal Organization: Cloud-Anbieter
Similar business models
-
Search engine
A search and advertising group as a walkable model: auctions in milliseconds, experiments over weeks, and a new ad campaign that waits for people.
-
Electricity grid operator
A grid operator as a walkable model: see how a solar system or heat pump gets connected and when grid planning becomes the bottleneck.
-
Payment service provider
A payment service provider as a walkable model: a card payment from authorisation in milliseconds to the payout to the merchant in the morning.
-
Smartphone maker
A smartphone maker without its own factory as a walkable model: repairs, spare parts, supply chain and product launch in a running simulation.
-
Bank
A bank as a walkable model: a business loan from first vote to disbursement, with sales and risk kept apart up to the board, in a running simulation.
-
Online retail
An order from click to doorstep as a walkable model: payment check, warehouse, packing, trucks, sortation and delivery in a running simulation.
-
Social network
A social network as a walkable model: how a report moves through triage, moderation, statement of reasons and appeal, language by language.
-
Semiconductor manufacturer
A chip fab as a walkable model: see where a wafer lot spends its weeks and why lithography sets the pace for the whole fab.
All data are fictional; NIMBORA is not modelled on any provider. The model can be fitted to your company's real data and then shows what is scattered today: ticket volumes and escalation rates per service, or load and error budget per zone, live.