模拟 · Minimal Energy · Wind and sea
Paderborn plateau
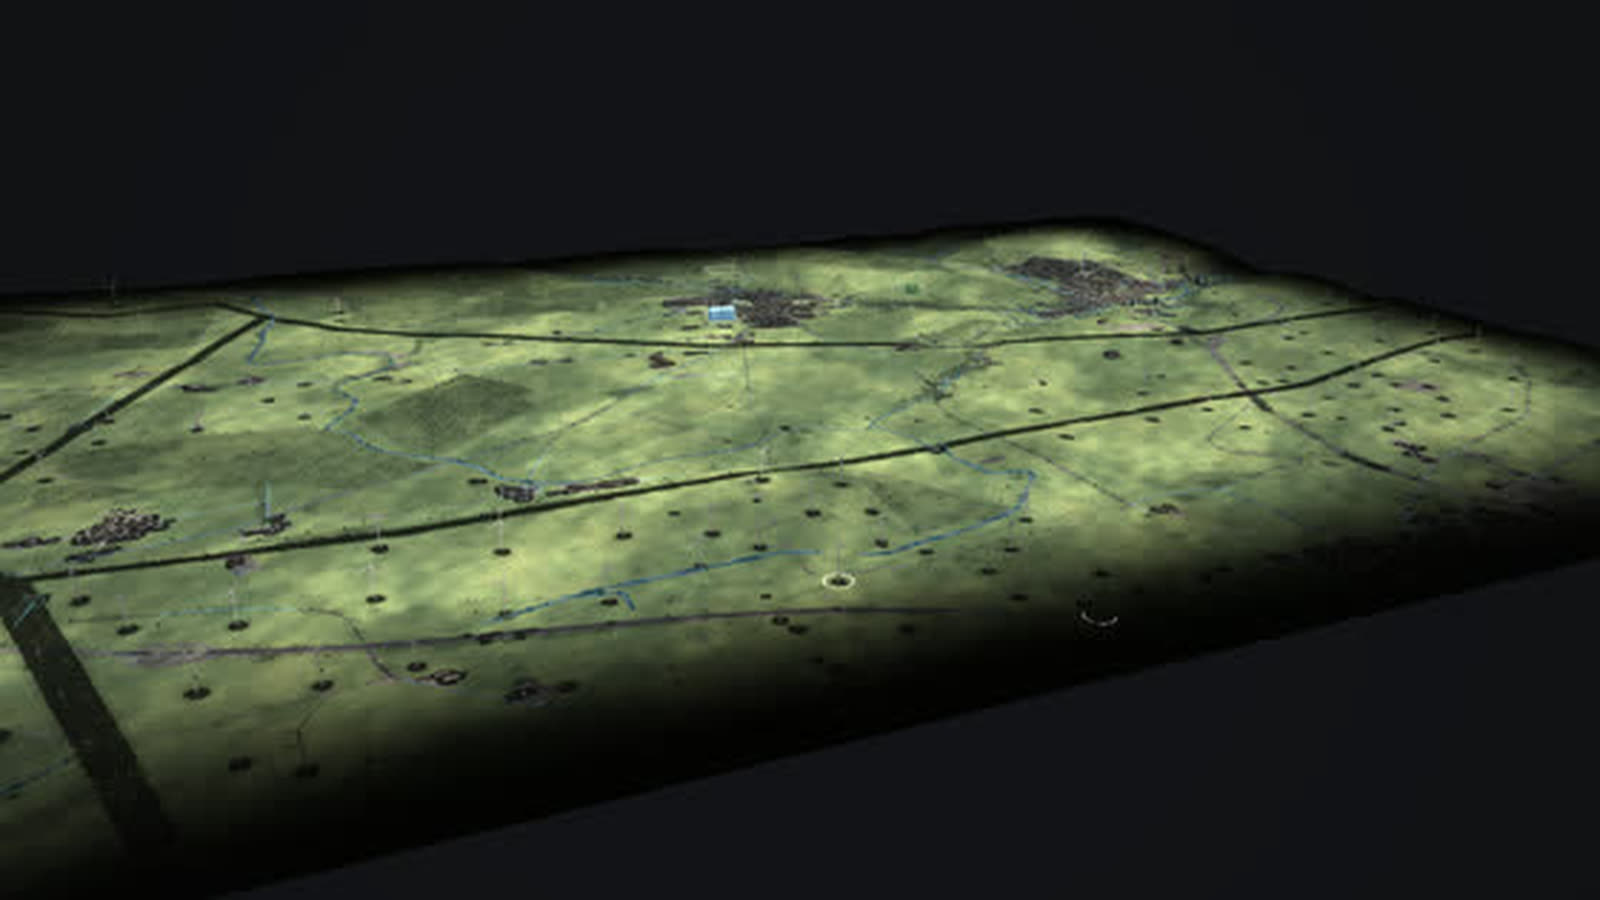
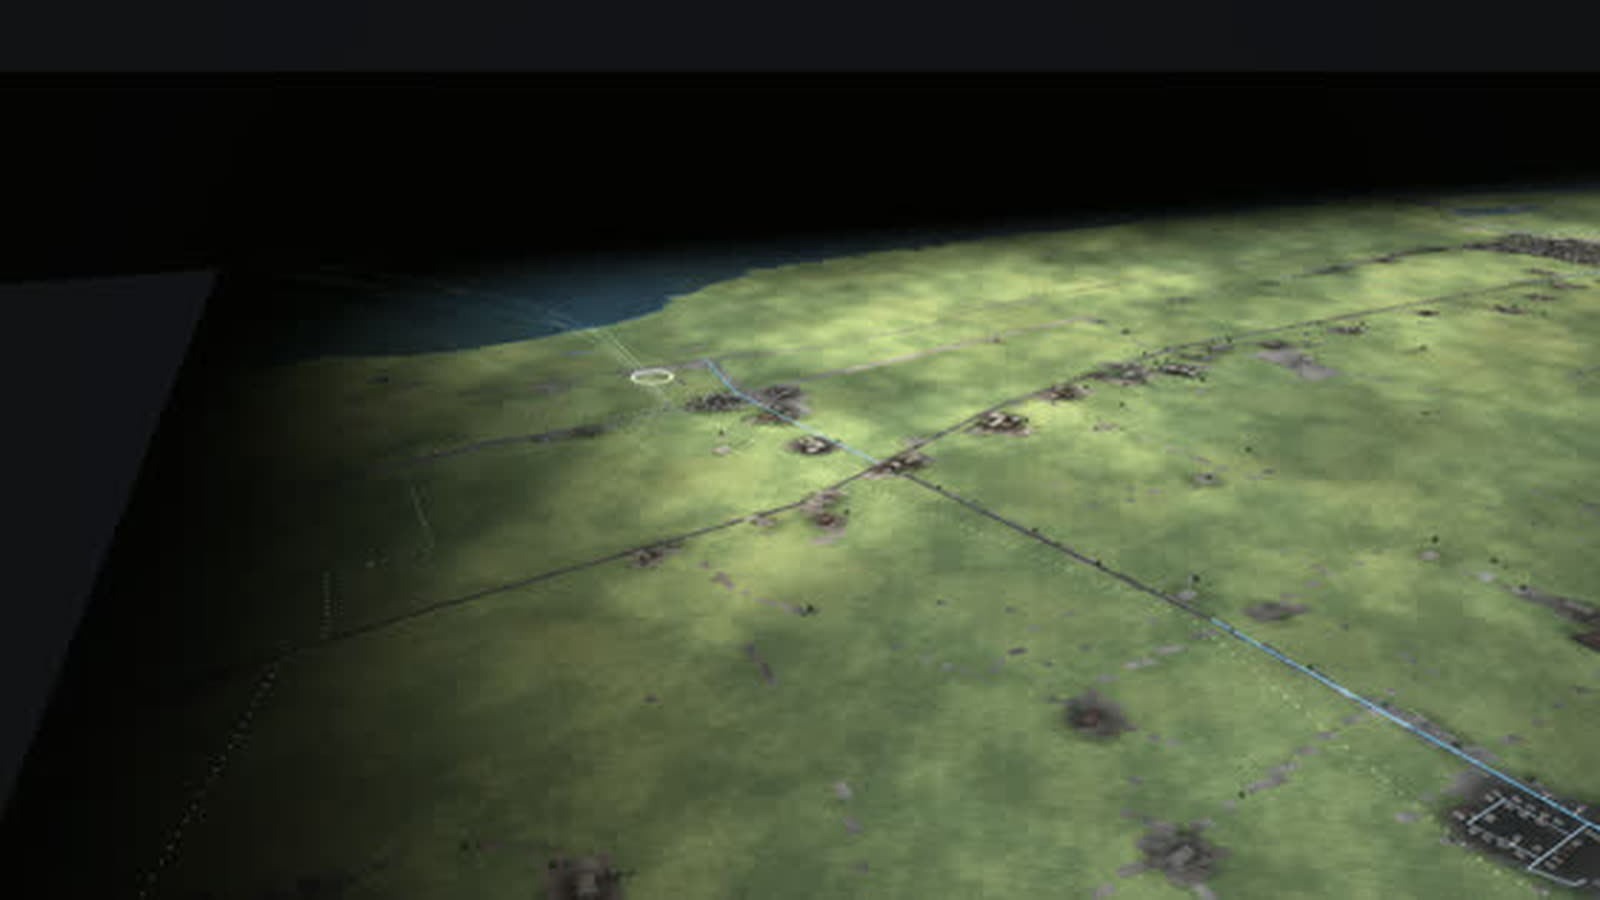
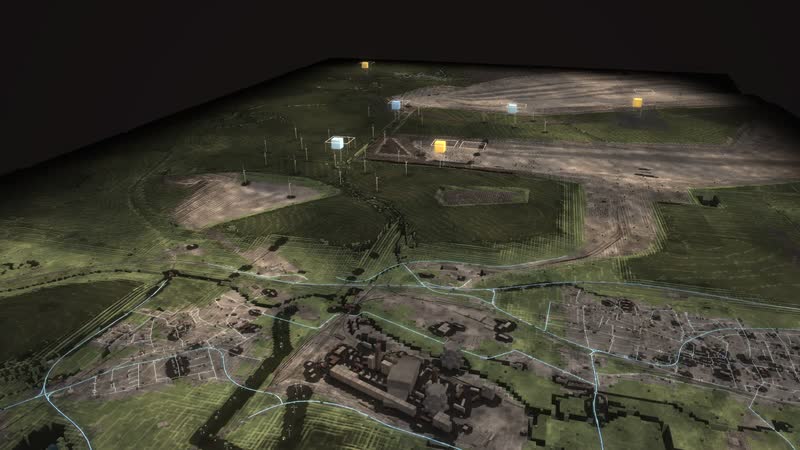
One of the densest wind landscapes in North Rhine-Westphalia as a walkable model: every turbine with its year, from the 500 kW turbine of 1995 to the 6.2 MW turbine with a 169 m hub.
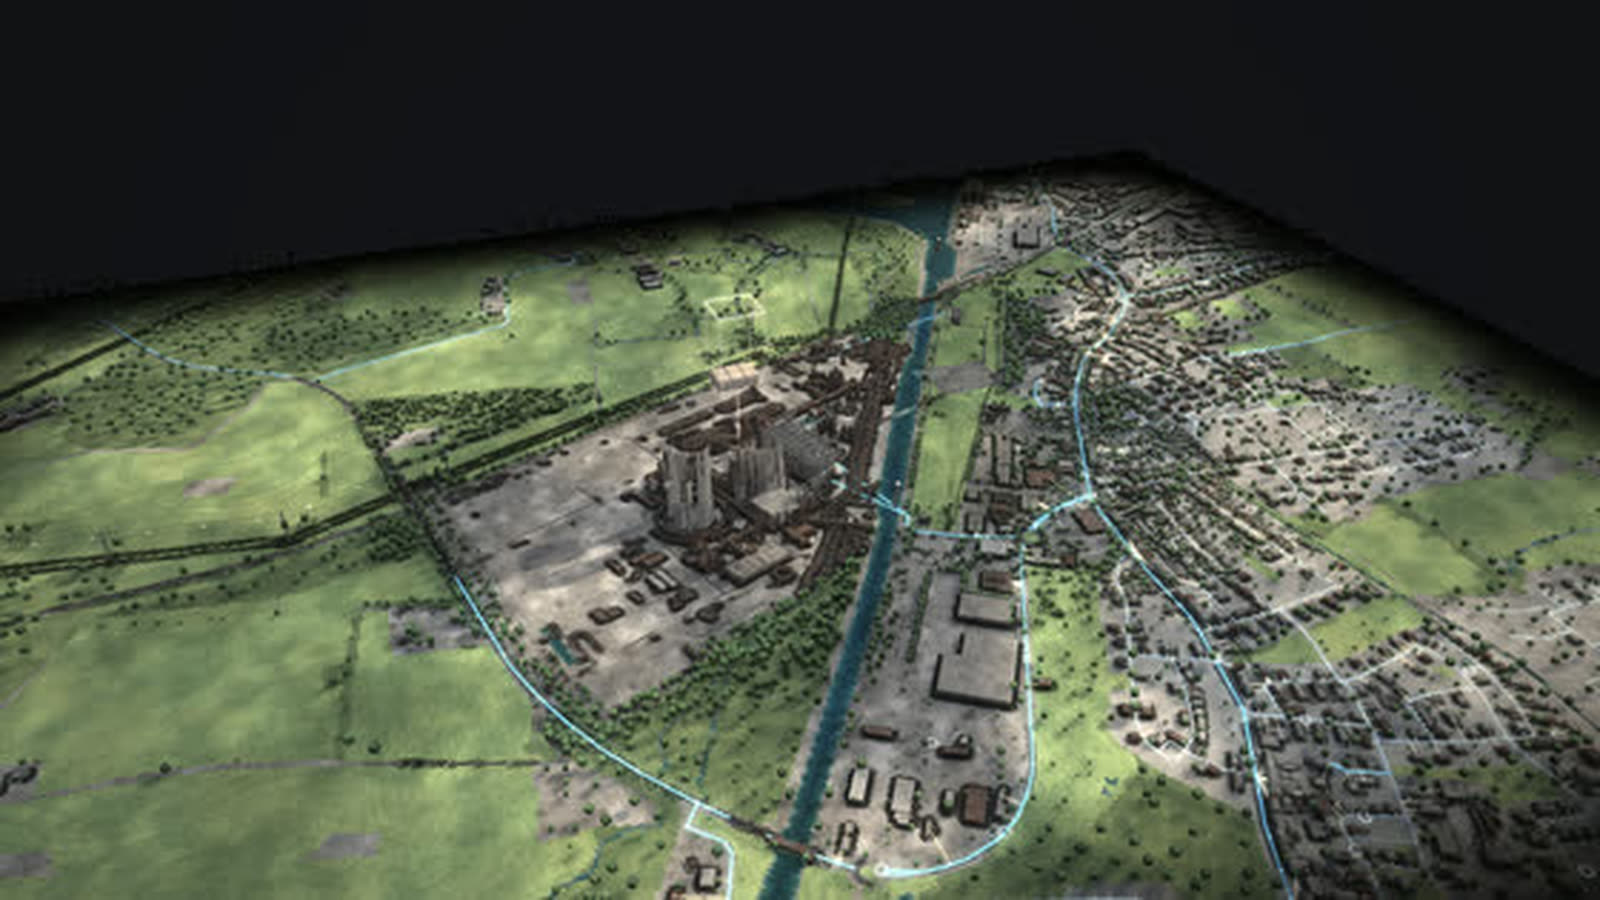
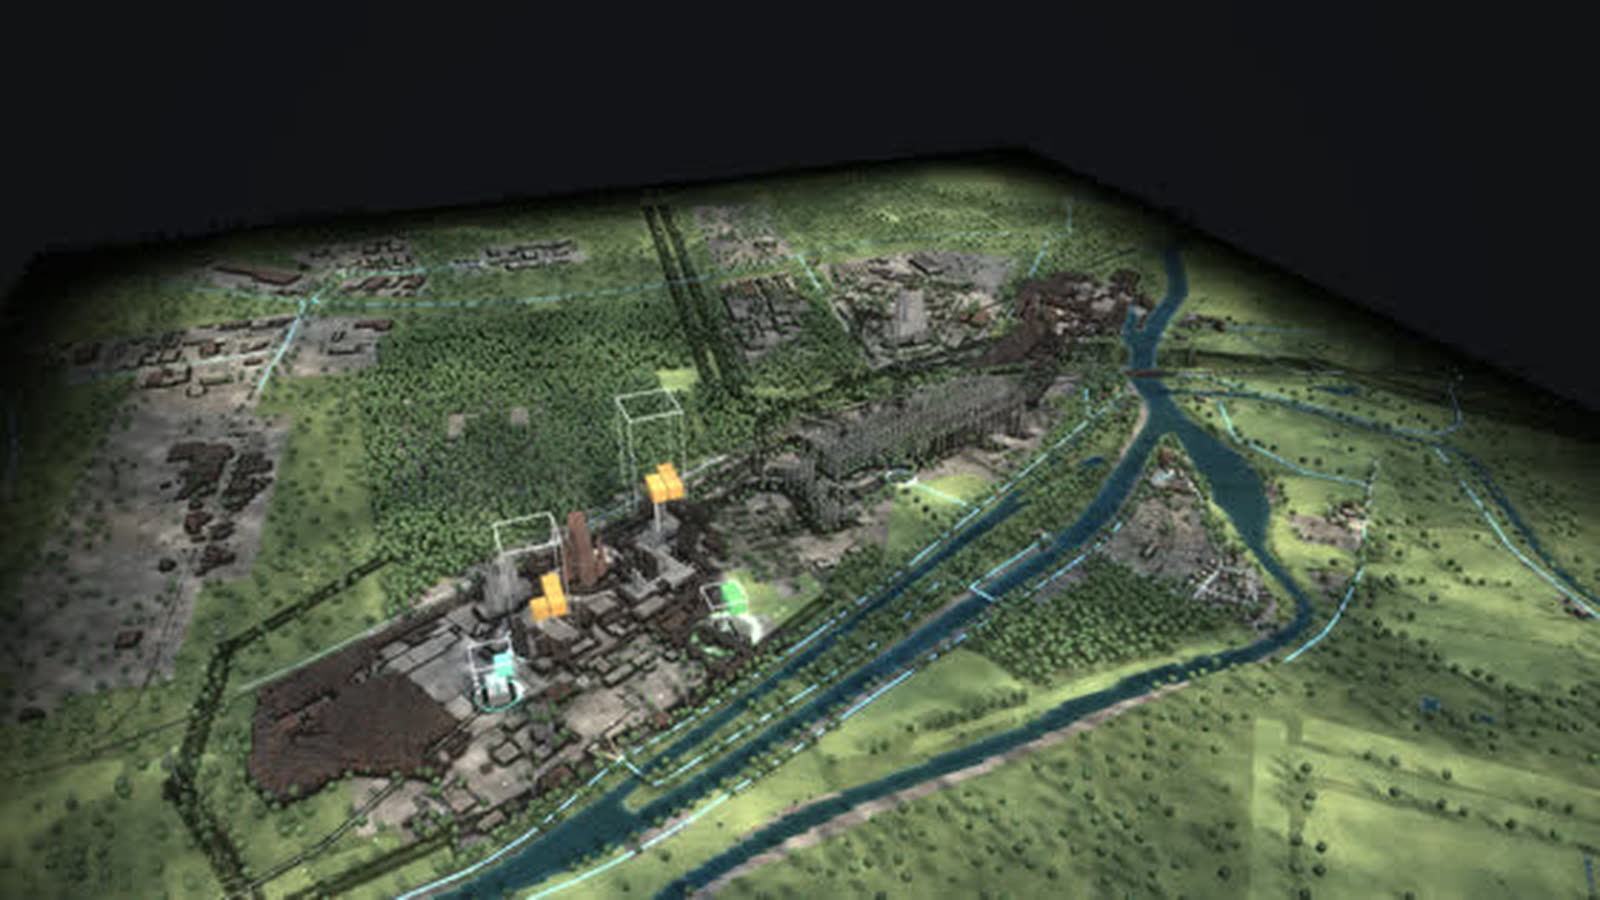
Real are terrain and buildings (Geobasis NRW, OpenStreetMap) and every wind turbine with its year from the market master data register. Turbines dismantled before 2019 are missing there, so early years show too few; what the turbines deliver now comes from the model. With your data it shows more, such as real yields per turbine, hours of curtailment or planned sites.
Onshore wind on the Paderborn plateau: between Bad Wünnenberg and Lichtenau stands one of the densest wind landscapes in North Rhine-Westphalia. Every turbine stands here individually with year built, hub height, rotor and removal from the market master data register; since the mid-1990s ever larger turbines have been added.
Repowering in one picture: the oldest turbine still running on the Eilerberg has delivered 500 kW since August 1995, with a 50 m hub and a 41 m rotor. About 700 m away, a turbine with 6.2 MW, a 169 m hub and a 162 m rotor has run since February 2025. It has the rated power of twelve first-generation turbines and harvests steadier wind higher up. Half a year before start-up, the tower grows next to the crane in the model.
The array grid collects the power at the Helmern, Vierlinden, Meerhof and Grüner Weg substations and lifts it into the 110 kV grid. Biogas farms supply power and heat even when the wind drops. In the stormy night the wind delivers more than is needed, and yellow rings show curtailment. For wind farm planners and operators, municipalities and regional planning, chambers and associations, schools and universities.
The chain of the place
- 01
Wind becomes power: The wind turns the rotor, the generator turns it into power; in calm weather the turbines stand still.
- 02
Taller and bigger: New turbines carry their hub almost 170 m up and deliver 6 MW: the wind is steadier up there.
- 03
Repowering: The oldest turbines from 1995 have 500 kW; today a few large ones replace many small ones.
- 04
Feeding in: The array grid collects the power at the substation and lifts it to 110 kV.
- 05
Biogas: Biogas farms supply power and heat even when the wind drops.
What is shown – why – for whom
| 展示内容 | 为什么 | 适用对象 |
|---|---|---|
| Every wind turbine individually from the market master data register | 为什么shows the stock, year built, hub height and removal | 适用对象Planning, municipalities |
| Oldest turbine of 1995 and new generation of 2025 on the Eilerberg | 为什么makes repowering visible with two turbines | 适用对象The public, teaching |
| Diagram ‘Additions and closures’ | 为什么shows how much capacity is added and removed each year | 适用对象Regional planning, associations |
| Diagram ‘A day on the grid’ | 为什么shows demand, generation, storage and imports over 24 hours | 适用对象Grid planning, universities |
| Diagram ‘Capacity of this place 1975–2025’ | 为什么shows the installed capacity of the plateau per year by source | 适用对象Economic development, municipalities |
| Event ‘Stormy night’ | 为什么shows surplus, curtailment and power flowing south and abroad | 适用对象Grid operations, the public |
| Helmern, Vierlinden, Meerhof and Grüner Weg substations | 为什么show where the wind power enters the 110 kV grid | 适用对象Grid connection, planning |
Facilities and areas in the model
-
Wind turbines of the plateau
Every turbine individually: year built, hub height, rotor and removal from the register. Half a year before start-up the tower grows next to the crane.
-
Biogas on the farms
Biogas plants and a wood-fired CHP plant from the register: digesters with gas roofs, a combined heat and power unit next to them. They run almost around the clock, regardless of the wind, and also supply heat for barns and houses.
-
Oldest turbine: Eilerberg 1995
A Nordtank NTK 500 with 500 kW, 50 m hub and 41 m rotor, in operation since August 1995. It is the oldest turbine still running here.
-
New generation: Eilerberg 2025
A turbine with 6.2 MW, 169 m hub and 162 m rotor, in operation since February 2025, about 700 m from the 1995 turbine. It has the rated power of twelve first-generation turbines and harvests steadier wind higher up.
-
Umspannwerk Helmern
110/33 kV: here the array grid of the surrounding turbines collects the power and lifts it into the 110 kV grid. Position from OpenStreetMap, year built not documented.
-
Umspannwerk Vierlinden
Feed-in substation of the wind farms in the west (110 kV). Position from OpenStreetMap, year built not documented.
-
Umspannwerke Meerhof und Grüner Weg
Two feed-in points for the wind farms in the east (110 kV). Position from OpenStreetMap, year built not documented.
Processes in the model
The chain of the place
- 01Wind becomes power: The wind turns the rotor, the generator turns it into power; in calm weather the turbines stand still.
- 02Taller and bigger: New turbines carry their hub almost 170 m up and deliver 6 MW: the wind is steadier up there.
- 03Repowering: The oldest turbines from 1995 have 500 kW; today a few large ones replace many small ones.
- 04Feeding in: The array grid collects the power at the substation and lifts it to 110 kV.
- 05Biogas: Biogas farms supply power and heat even when the wind drops.
One day
- 01“Play the day”
- 02the sun moves, wind and demand change every hour
- 03the stacks above the plants grow and shrink
- 04storage charges and discharges
Fifty years
- 01▶ at the year (time travel)
- 021995
- 032005
- 042015
- 052025
- 06plants appear, run, are shut down and dismantled; the history of the place jumps to every year
How a wind region can use the model
-
Planning and operations
Every turbine individually with year, hub and rotor, plus the substations: the model shows the stock and how capacity grows over the years – a basis for talks about repowering.
适用对象Developers, operators, grid connection
-
Municipality and region
What stands here, since when, and what comes next? Time travel shows 1995, 2005, 2015 and 2025 from the same camera – a factual basis for planning and public meetings.
适用对象Municipalities, regional planning, economic development, chambers
-
Schools and universities
How much power does a modern wind turbine generate, what does repowering mean? The five steps from wind to power via taller hubs, repowering and feed-in to biogas fly to each part.
适用对象Teachers, pupils, energy engineering students
-
Exhibitions and information centres
Two turbines, thirty years: the 1995 turbine and the 2025 turbine stand 700 m apart. The diagram ‘Additions and closures’ shows how much capacity is added and removed each year.
适用对象Exhibitions, information centres, technology museums
-
Public communication
Why do the turbines stand still in calm weather, and what is curtailment? The stormy night shows the surplus with yellow rings, the winter evening without wind or sun what still delivers then.
适用对象Public relations, public dialogue, associations
What you can change
Controls
- Year 1975–2025: plants appear and disappear, mix and grid change; ▶ lets the years run.
- Season: snow, foliage, meadows, chimney smoke; more heat and power demand in winter, more sun in summer.
- Time of day: sun position, dusk, night with windows and street lights; demand follows the daily profile.
- Wind: rotors turn faster, sea state, smoke plumes lie flat; wind power rises, curtailment in a storm.
- Sun: clouds and soft shadows; photovoltaics deliver more or less.
- Demand (households, industry): more lit windows, plant lighting, chimney smoke; more expensive plants step in.
- Views: power, heat, fuels, storage, CO₂ – each with its own columns, stacks and values.
Events
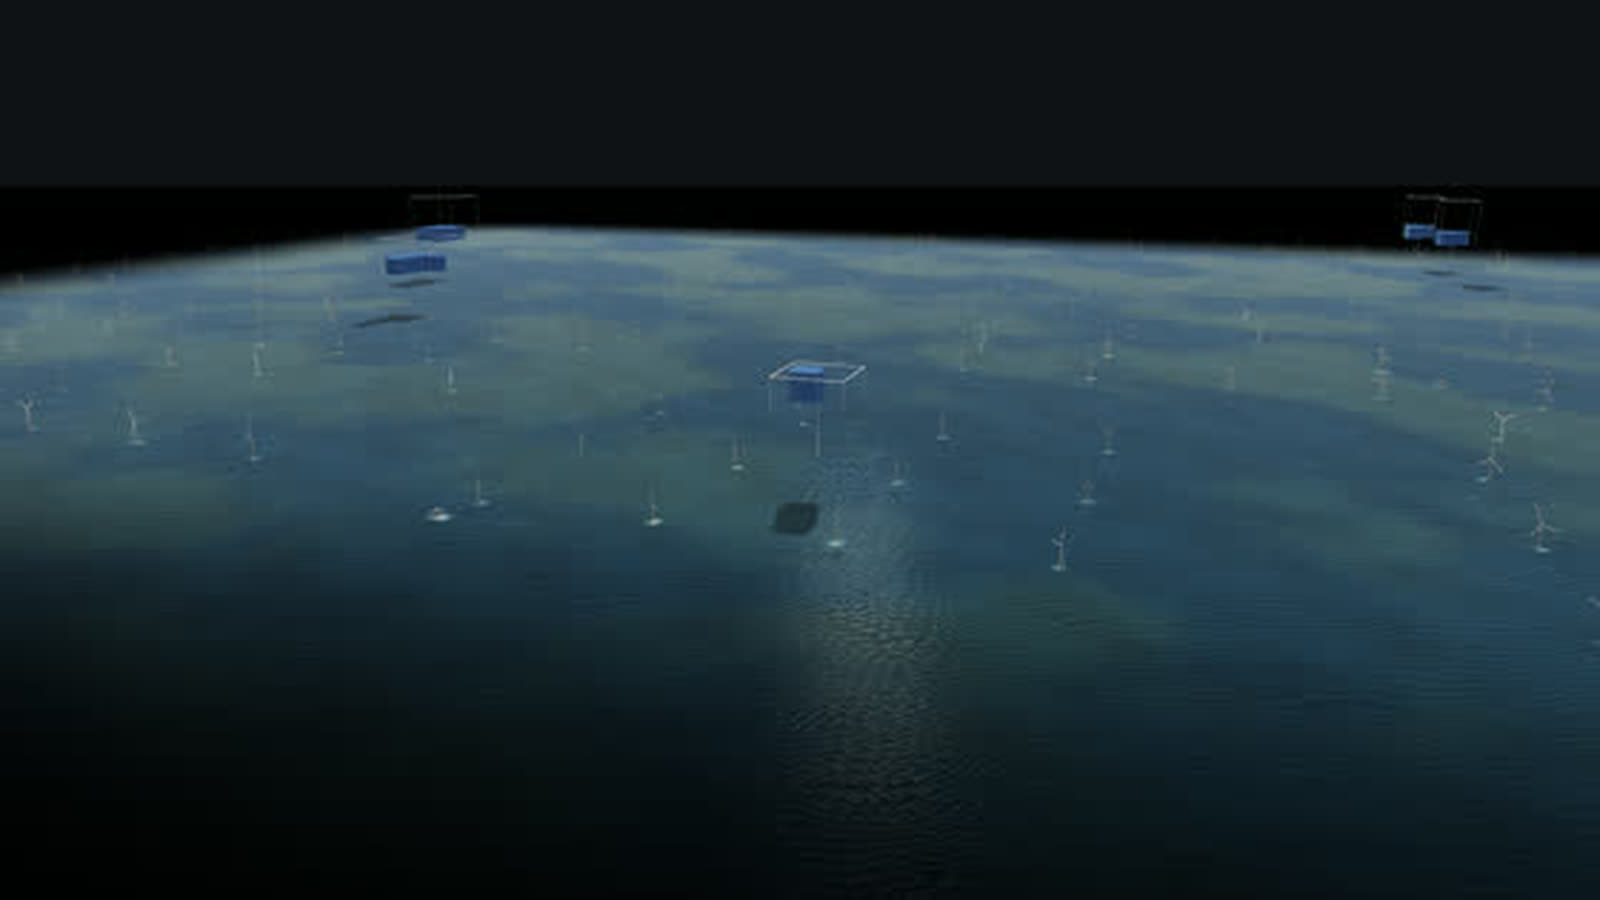
- Stormy night: Winter gale at 3 am with low demand. Wind delivers more than is needed. Look for: blue cubes above the frame, power flows south and abroad, yellow rings show curtailment, storage charges.
- Winter evening without wind or sun (tiles): Season winter, evening, calm, overcast: demand peaks, the stacks above wind and solar shrink, fossil plants, storage and imports carry the load.
- Stormy night (tiles): Night, gale, low demand: wind delivers more than is needed, storage charges, surplus is curtailed or exported.
What the model gives a wind region
-
01
Every turbine in its place
No symbolic turbines: every turbine stands with year built, hub height and rotor from the register, on terrain from Geobasis NRW.
-
02
Thirty years of growth
Time travel shows how the turbines have grown taller and bigger since 1995. The history of the place jumps to every year.
-
03
Wind that moves
The wind control makes the rotors turn faster and the smoke plumes lie flat; wind power rises, and in a storm it is curtailed.
-
04
Power now above the field
Above the plateau’s turbines stands a stack of cubes, one cube 20 MW, the frame the installed capacity – so you see how much is being delivered right now.
-
05
In the browser and on the big screen
A browser is enough, and large projections work too. Eleven more places and the map of Germany are part of the same model, designed by an artist and developer.
Your wind farm as a model
Would you like to show your wind farm, your region or your repowering this way, with real yields and planning status? Write to us or give us a call, and we will discuss which data the model needs. We will send you the password to the simulation on request.
cube4tec.de/spiele/minimal-energy/
就此咨询
Minimal Energy: Paderborner Hochfläche
Basis and limits
Real are terrain and buildings (Geobasis NRW, OpenStreetMap) and every wind turbine with its year from the market master data register. Turbines dismantled before 2019 are missing there, so early years show too few; what the turbines deliver now comes from the model.
Public sources the model is based on:
- Geobasis NRW (dl-de/zero-2.0)
- OpenStreetMap-Mitwirkende (ODbL)
- Marktstammdatenregister der Bundesnetzagentur (dl-de/by-2-0)
More places in the model
-
Coast near Norden
Where energy from the North Sea comes ashore, as a walkable model: six direct-current cables under the dike, natural gas from Norway since 1995 and more than 200 wind turbines behind the dike.
-
North Sea off Borkum
The beginning of German offshore wind as a walkable model: twelve test turbines from 2009, a cluster of 284 turbines and about 1,660 MW, substation and converter platforms and the way ashore.
-
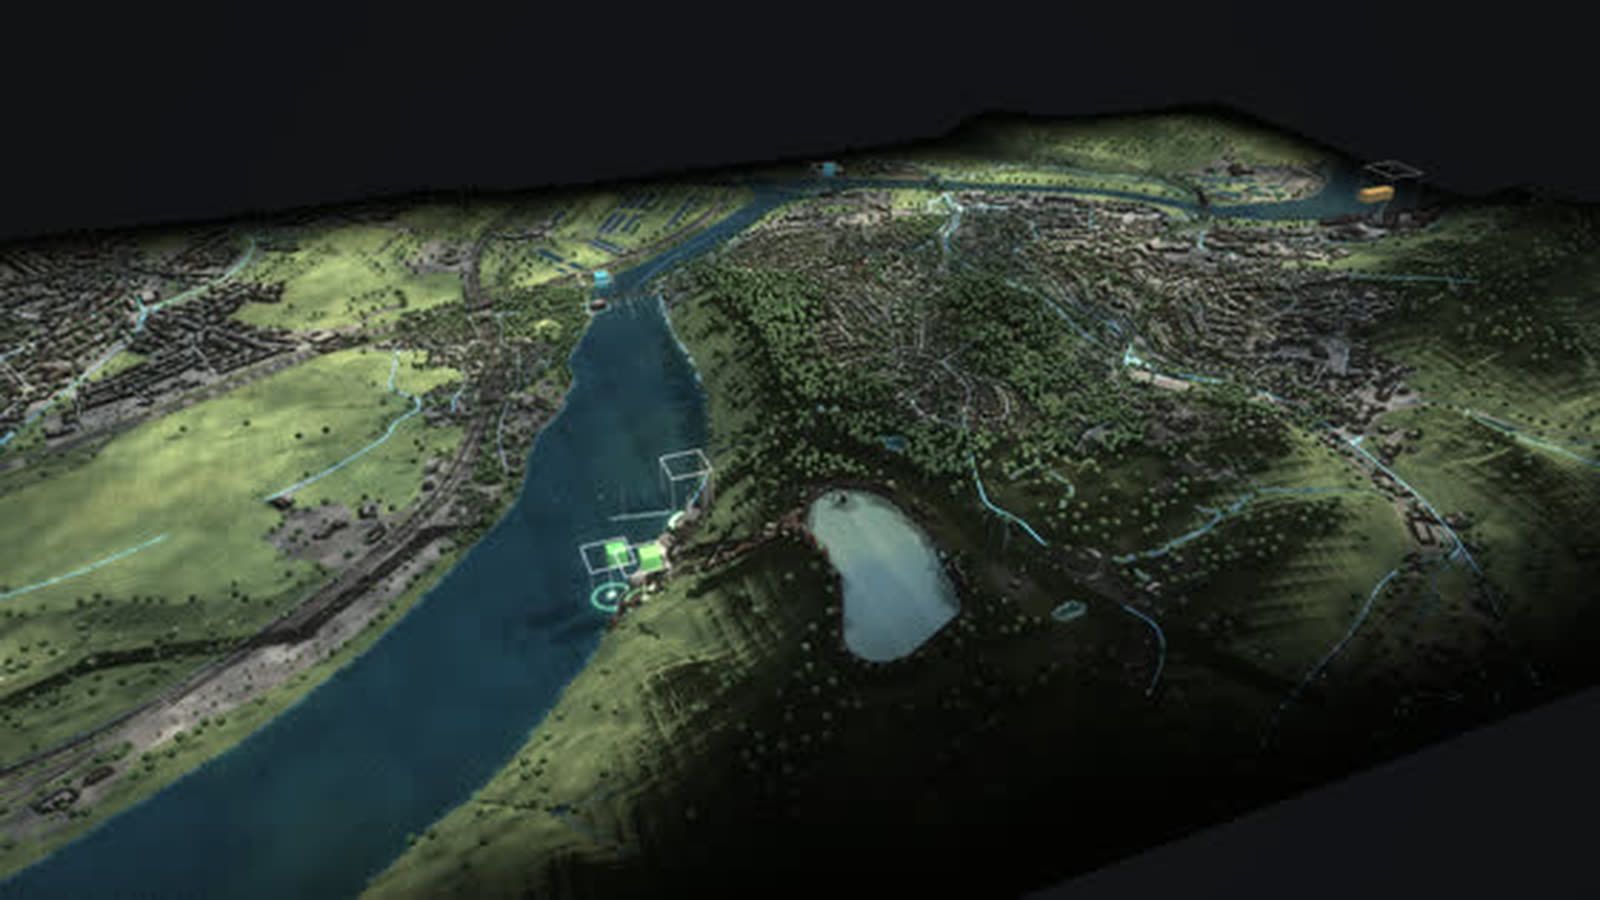
Rhineland lignite district
The Rhineland lignite district as a walkable model: from the Garzweiler mine via conveyors, boilers and cooling towers into the 380 kV grid – while wind, sun and batteries grow on the reclaimed land.
-
Herdecke
Three generations of storage at Lake Hengstey as a walkable model: the Koepchenwerk of 1930, the pumped-storage plant of 1989 and batteries since 2017 – the level in the reservoir follows sun, wind and demand.
-
Germany 1975–2025
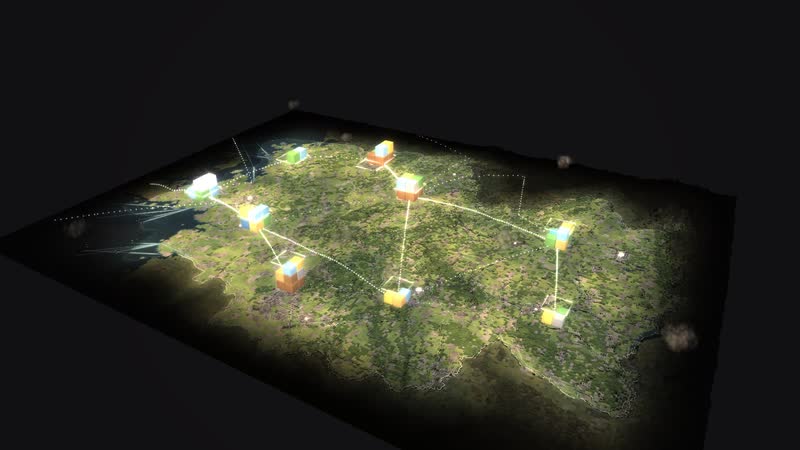
Fifty years of energy supply on one map: 365 sites, ten grid regions and the power of every hour – from two separate grids in 1975 to wind and sun in 2025.
-
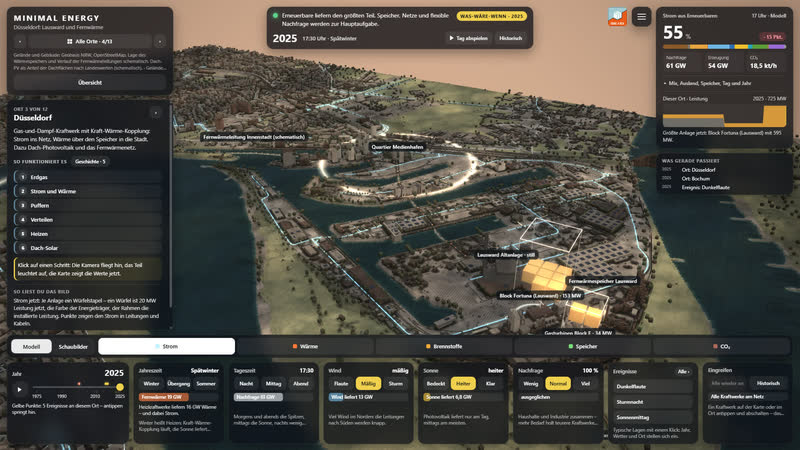
Düsseldorf Lausward
A combined-cycle gas plant on the Rhine as a walkable model: power to the grid, heat via a 58 m storage tank and the district heating line into the media harbour and the city centre.
-
Datteln 4
Germany’s newest hard-coal plant as a walkable model: coal by ship on the Dortmund-Ems Canal, power for the grid and the railway, district heat as far as Recklinghausen.
-
Lingen
The whole nuclear era in one place as a walkable model: the Lingen nuclear plant of 1968, the Emsland nuclear plant until April 2023, interim storage and dismantling – next to them gas, a battery and hydrogen.
Real are terrain and buildings (Geobasis NRW, OpenStreetMap) and every wind turbine with its year from the market master data register. Turbines dismantled before 2019 are missing there, so early years show too few; what the turbines deliver now comes from the model. With your data it shows more, s…