
模拟 · Minimal Energy · Overview
Germany 1975–2025
Fifty years of energy supply on one map: 365 sites, ten grid regions and the power of every hour – from two separate grids in 1975 to wind and sun in 2025.
Trailer
Real are the location, capacity and operating years of the 365 sites from public sources (AG Energiebilanzen, German Environment Agency, Federal Network Agency, BASE) as well as grid and terrain (OpenStreetMap, open elevation data). What happens each hour – dispatch, flows between the ten regions, storage, CO₂ – is calculated by a deliberately simple model; corridors and couplings are model assumptions. With your data it shows more, such as your grid region, your plants or load profiles that appear on no single map today.
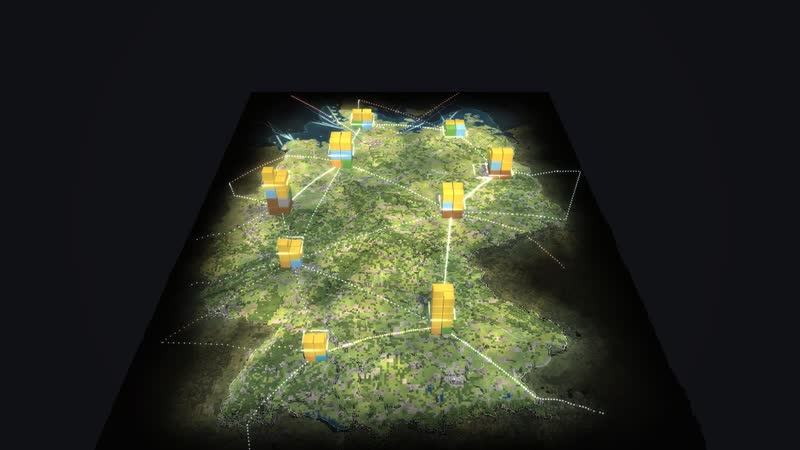
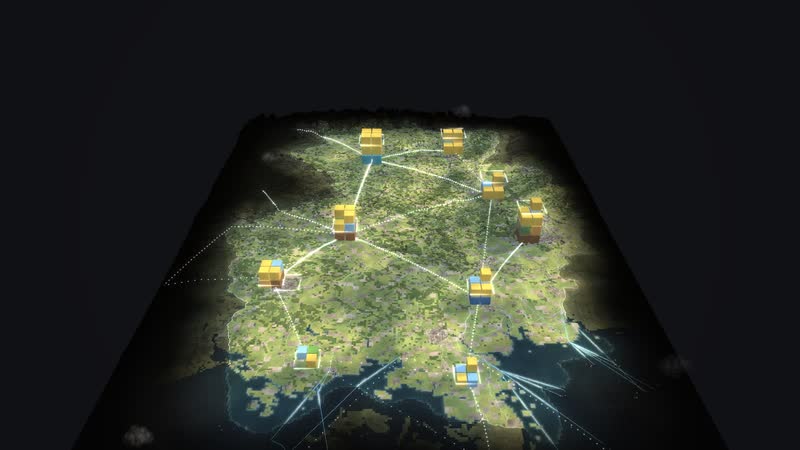
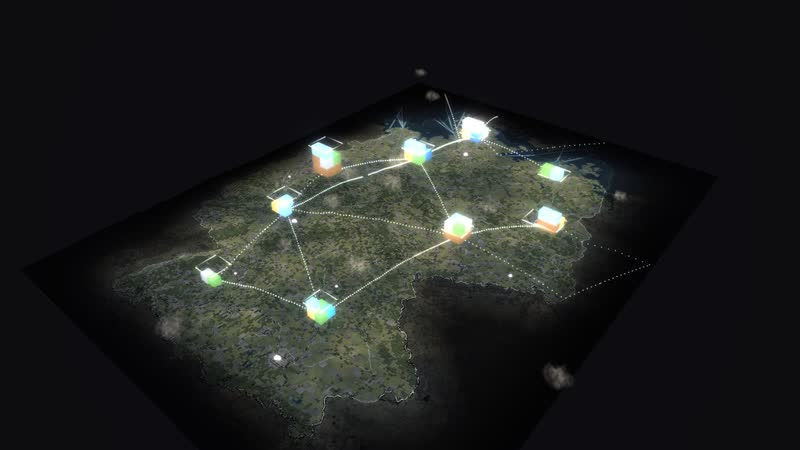
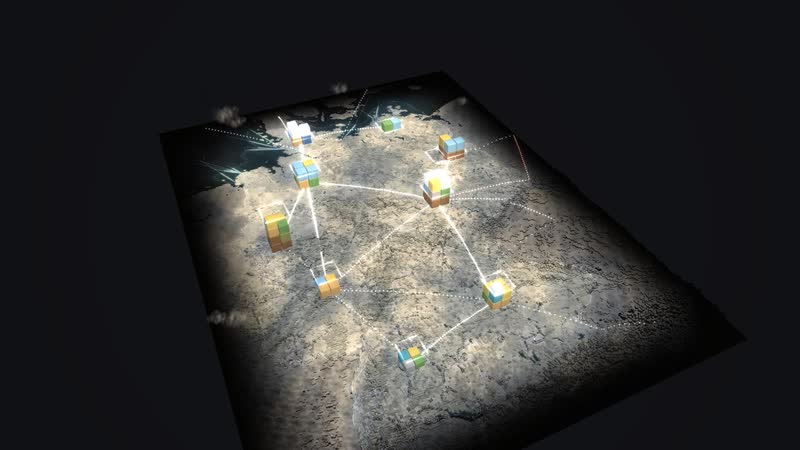
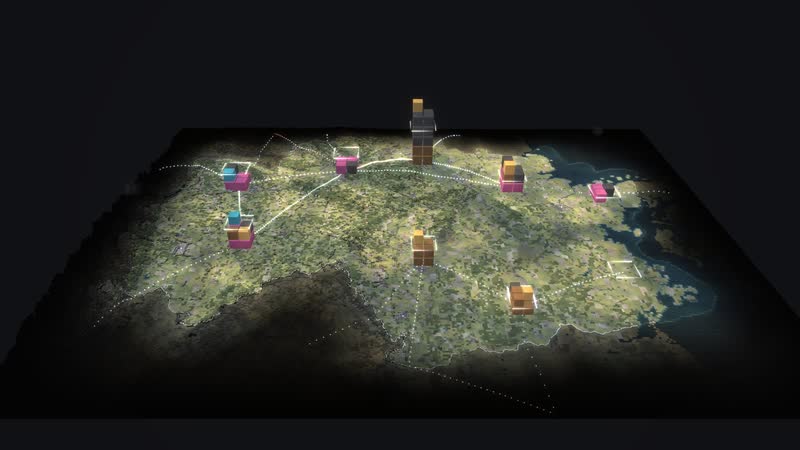
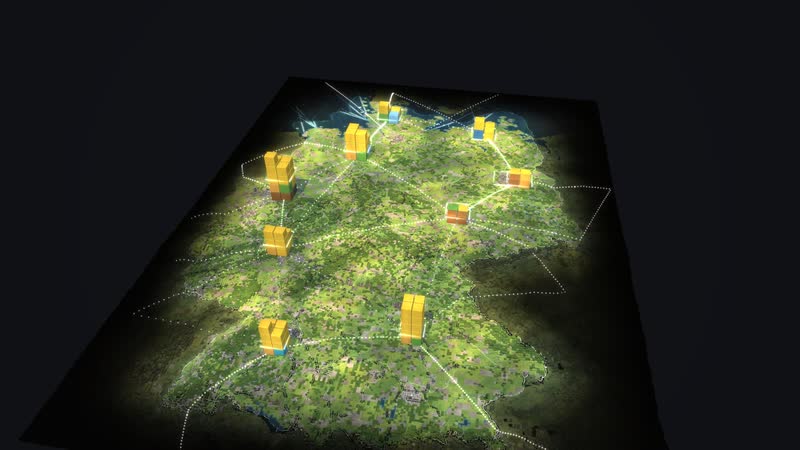
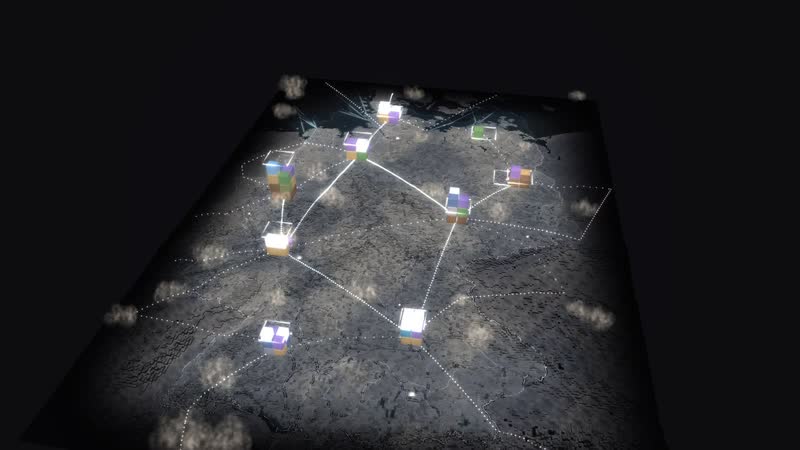
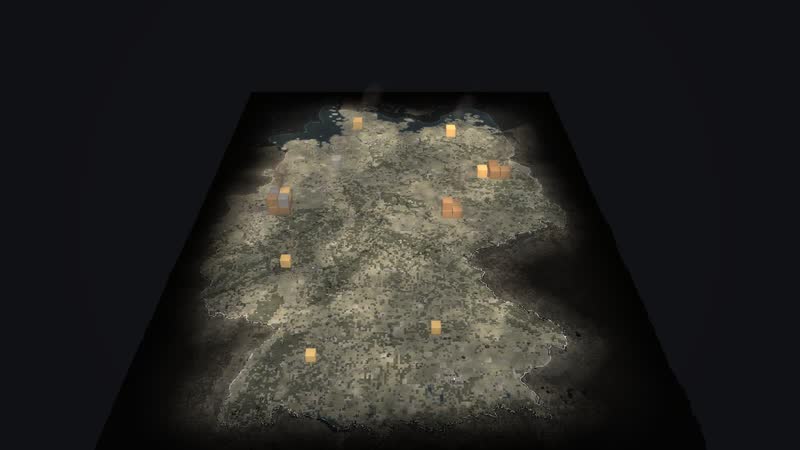
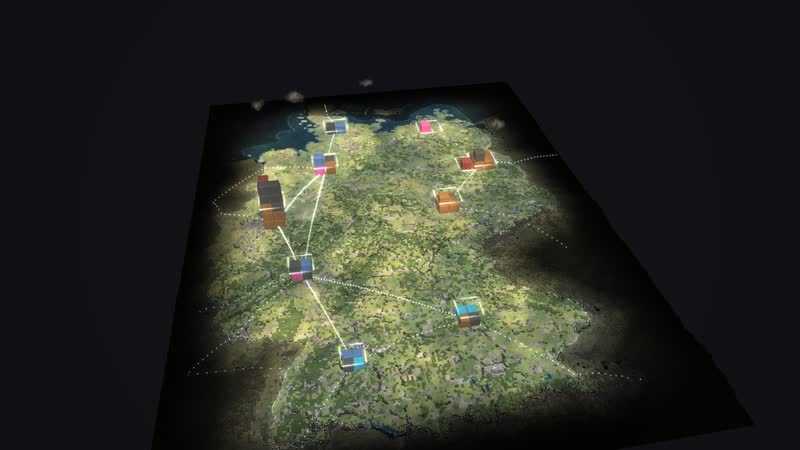
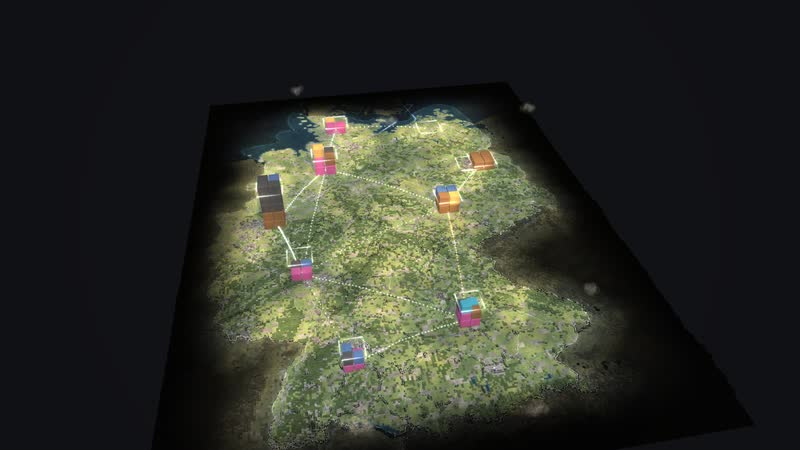
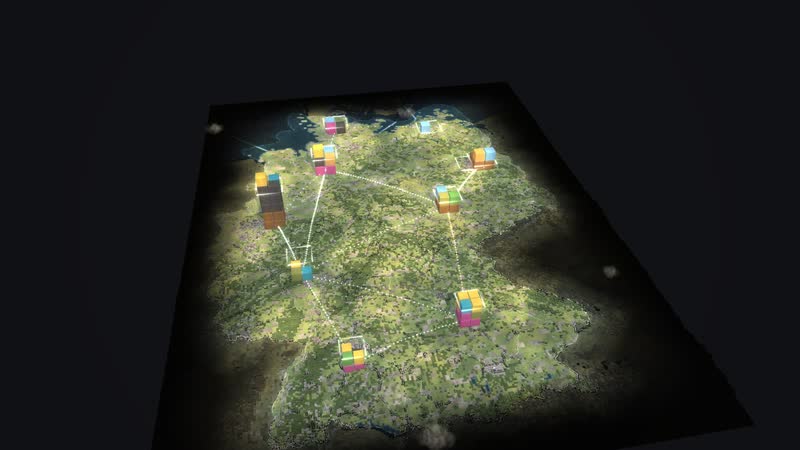
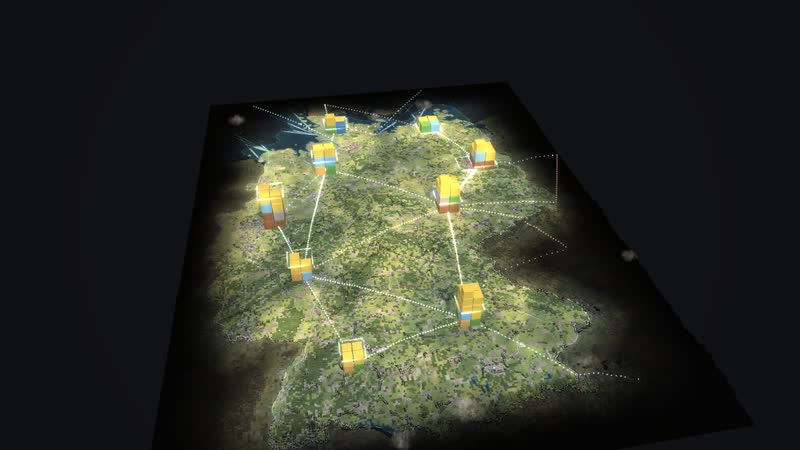
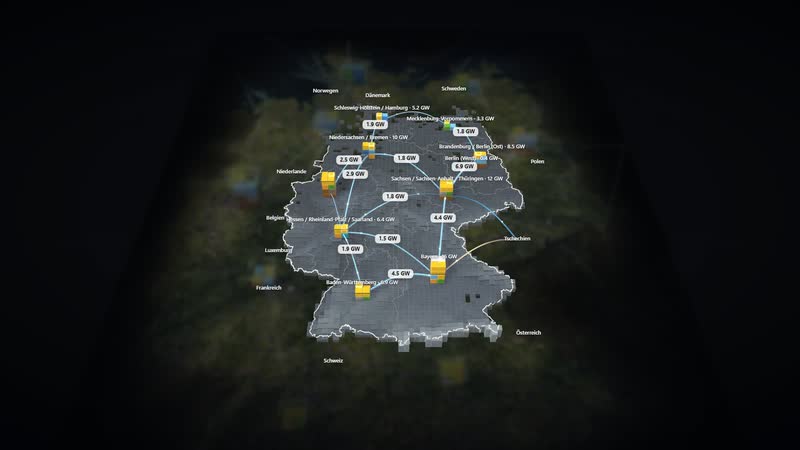
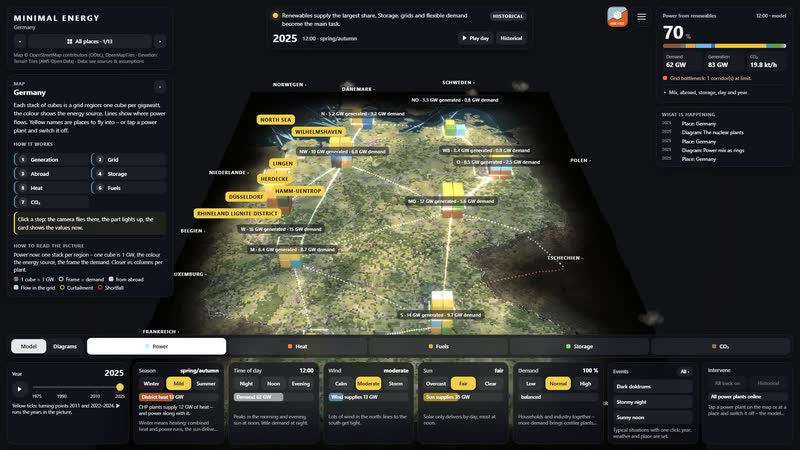
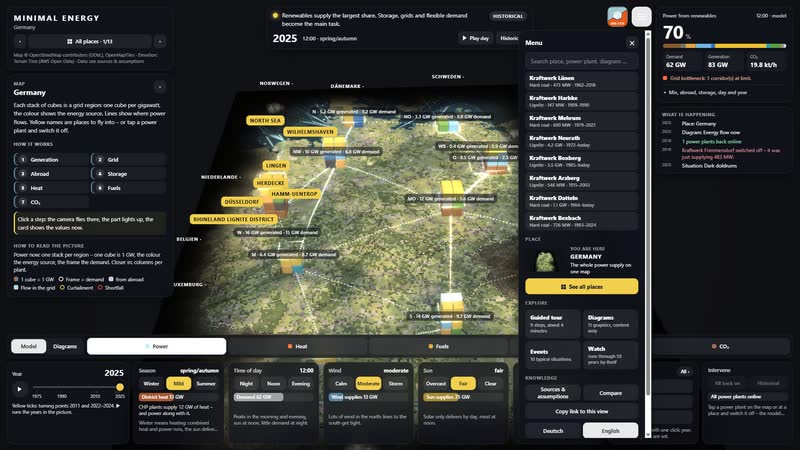
Germany’s power mix from 1975 to 2025 on one map: 365 sites with power plants, open-cast mines, wind farms, solar fields, storage, refineries and lines. Ten grid regions each carry a stack of cubes – one cube is one gigawatt of power in this hour, the colour the energy source, the frame the demand. Dots on the arcs show power flowing between the regions and across the borders; red means congestion.
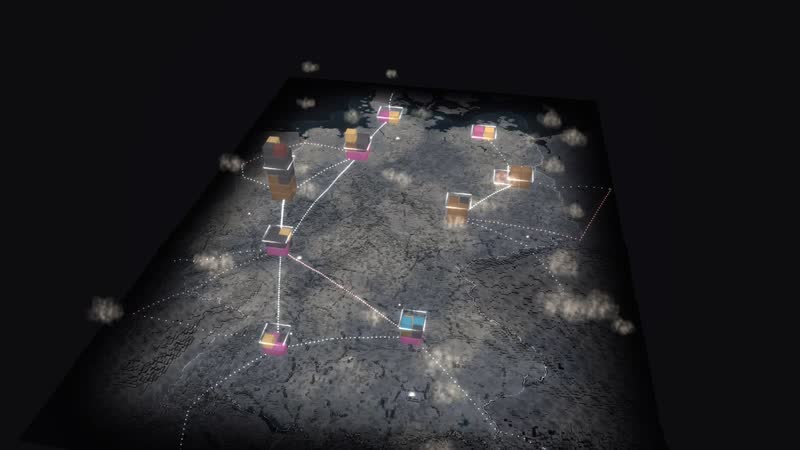
The year slider runs through fifty years: in 1975 West Germany, East Germany and West Berlin run separate grids, from 1990 they grow together, in 2011 eight nuclear plants go offline after Fukushima, on 15 April 2023 the last three, and by 2025 wind and sun deliver most of the power. Tiles for season, time of day, wind, sun and demand change the situation at once. Switch off a power plant and you see who steps in and how CO₂ and imports change.
Four situations are set with one click: dark doldrums, stormy night, sunny noon and a winter evening in 1985. Diagrams calculate live, from the power mix to the merit order and the nuclear plants, and twelve walkable places lead from the map into the detail. The page is for everyone who plans, decides or explains energy: operators and grid planners, municipalities, chambers and associations, schools, universities and museums.
Power now
- 01
One cube stack per region (1 cube = 1 GW)
- 02
arcs between the regions (dots = power, red = congestion)
- 03
borders (imports, exports)
- 04
frame = demand
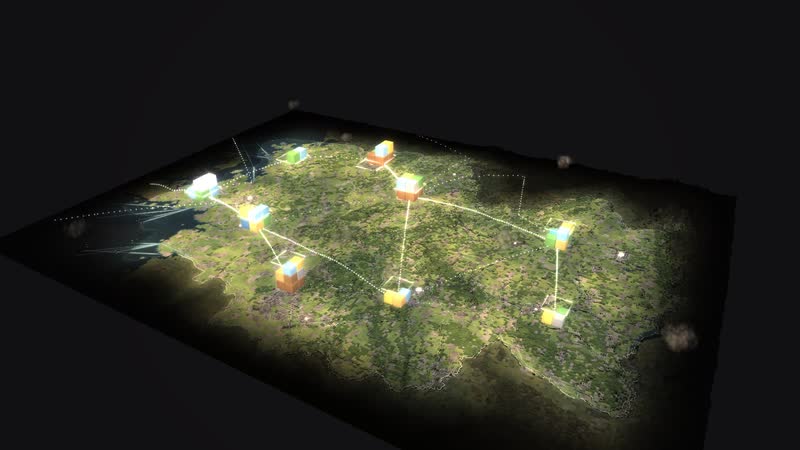
01
A country made of blocks
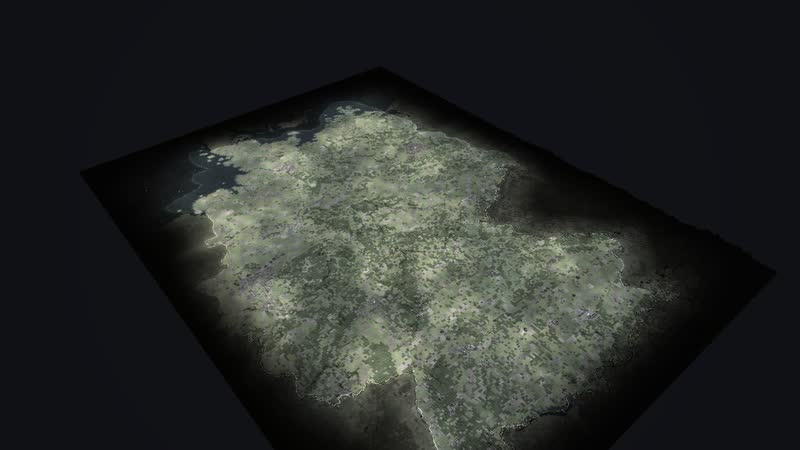
The map of Germany shows fifty years of energy supply from 1975 to 2025 with 365 sites: power plants, open-cast mines, wind farms, solar fields, storage, refineries and lines.
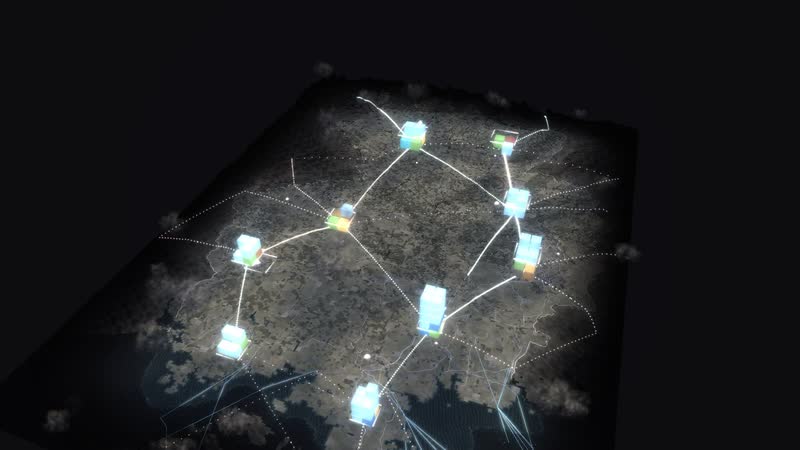
02
When wind delivers more than is needed
Stormy night – Winter gale at 3 am with low demand. Wind delivers more than is needed.
What is shown – why – for whom
| 展示内容 | 为什么 | 适用对象 |
|---|---|---|
| Cube stacks per grid region: one cube 1 GW, the frame the demand | 为什么shows at a glance where power is generated and where it is needed | 适用对象Grid planning, municipalities |
| Arcs between the regions and across the borders, red means congestion | 为什么shows flows, imports and exports and where the grid gets tight | 适用对象Grid operations, policymakers |
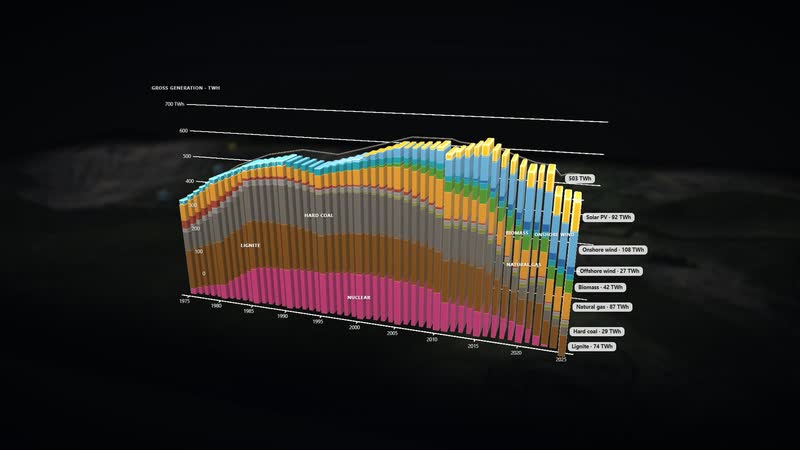
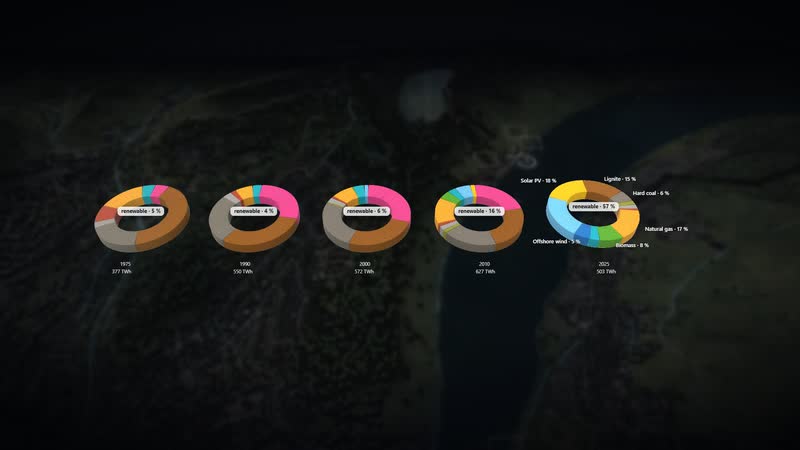
| Diagram ‘Power mix 1975–2025’ | 为什么shows how generation by source shifts over fifty years | 适用对象Schools, universities, the public |
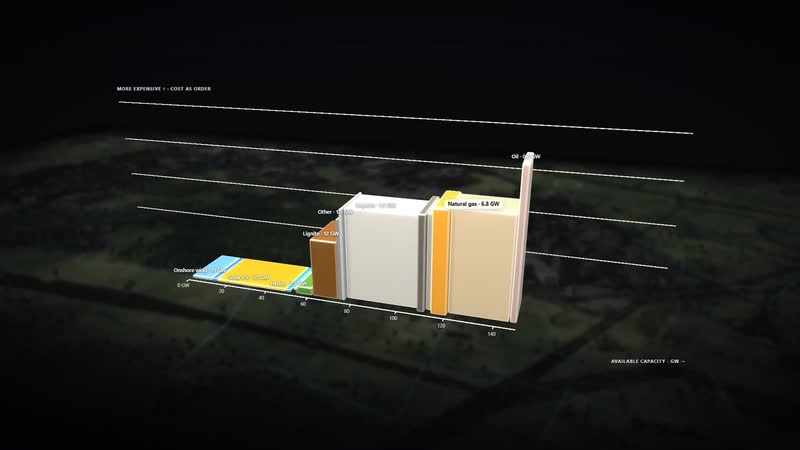
| Diagram ‘Who supplies first’ | 为什么explains the merit order in which the plants step in by cost | 适用对象Students, energy industry, associations |
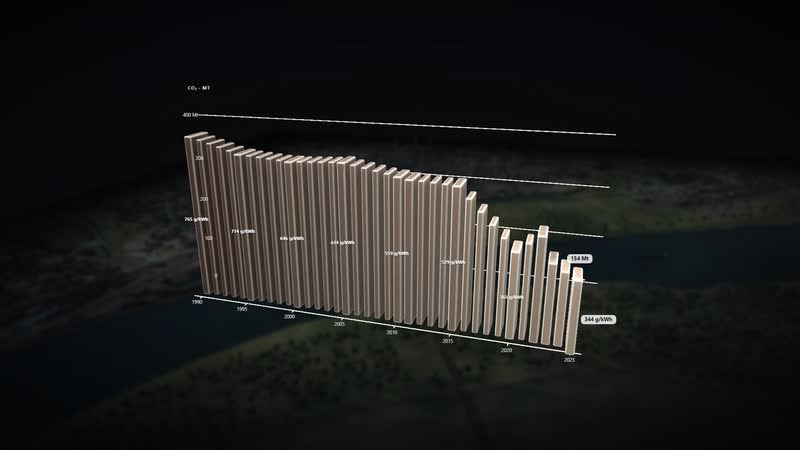
| Diagram ‘CO₂ since 1990’ and the CO₂ view per region | 为什么shows emissions per year, per hour and per kilowatt hour | 适用对象Climate protection, municipalities, public relations |
| Event ‘Dark doldrums’ | 为什么shows who steps in when wind and sun are missing | 适用对象Teaching, system planning |
| Diagram ‘The nuclear plants’ | 为什么shows every nuclear plant from start-up to shutdown | 适用对象Museums, exhibitions, teaching |
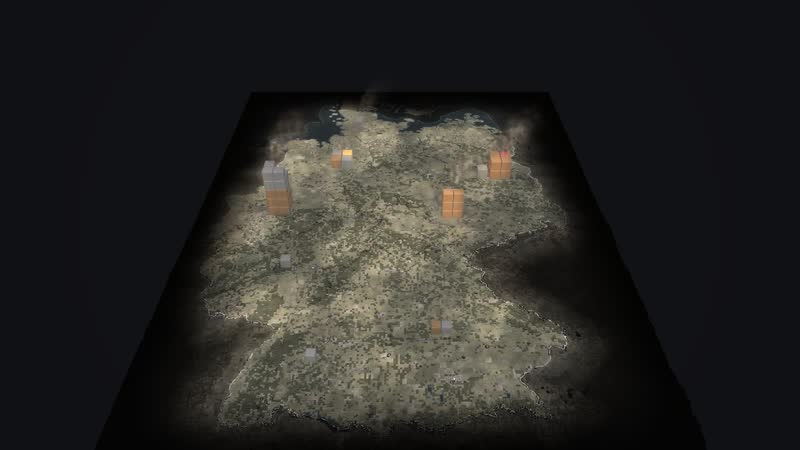
03
Making CO₂ visible
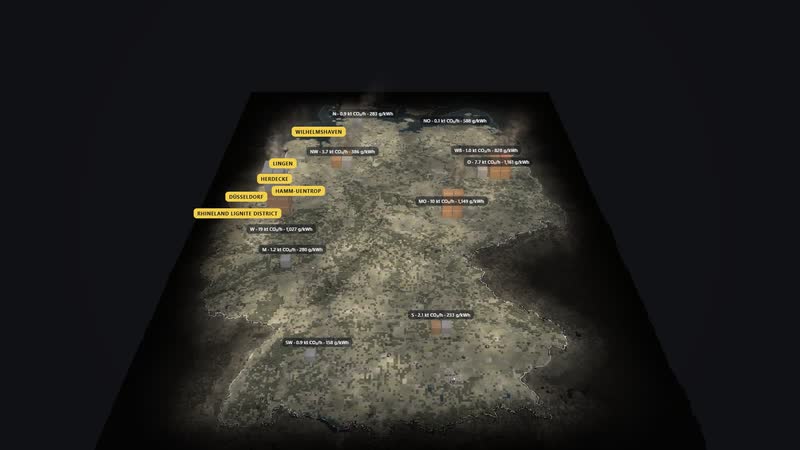
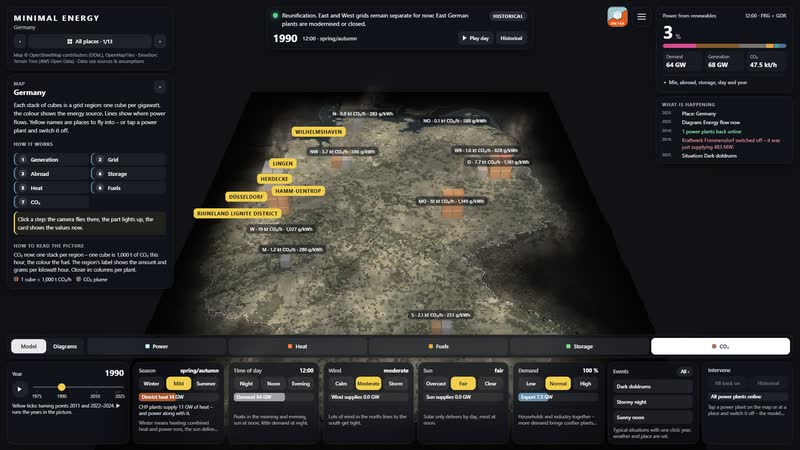
One stack per region: one cube is 1,000 t of CO₂ in this hour, the label carries the amount and grams per kilowatt hour – 1990 and 2025 compared.
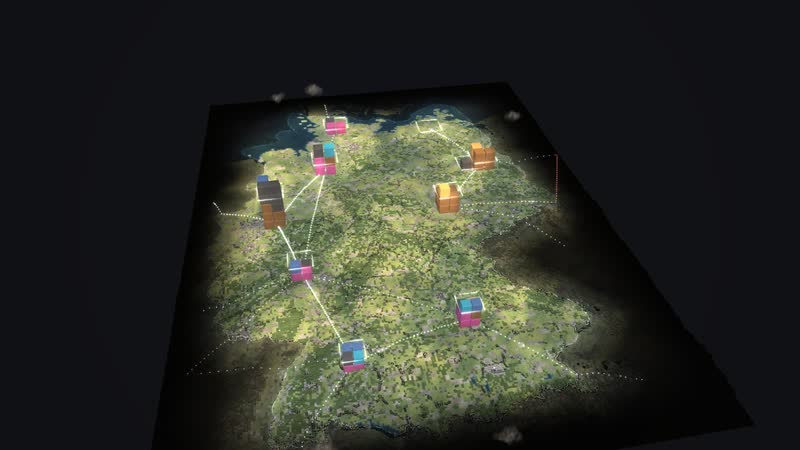
04
Two grids become one
Before 1990 West Germany, East Germany and West Berlin run as separate systems; afterwards the grids grow together.
Films from the model
-
A day in time-lapse
From morning to midnight: the sun moves, the stacks grow and shrink with wind, sun and demand, at night windows and plants light up.
-
Fifty years in thirty seconds
From 1975 to 2025: coal and nuclear go, wind and sun arrive, the grids of East and West grow together.
-
Five views
Power, heat, fuels, storage and CO₂ – the same world read five different ways, with values right at the plants.
-
Dark doldrums, storm, sun
Three typical situations in a row: a winter evening without wind or sun, a stormy night with surplus, a sunny midday with photovoltaics.
-
Six diagrams
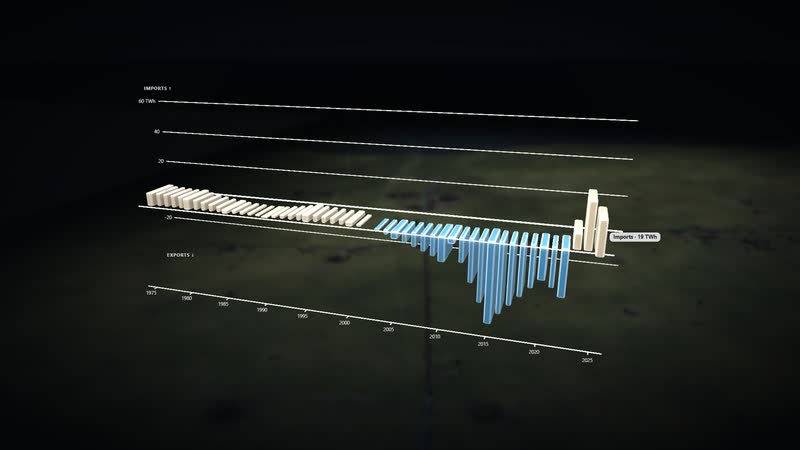
Calculated live from the model and lit like a film: ‘Power mix 1975–2025’, ‘Energy flow now’, ‘Who supplies first’, ‘CO₂ since 1990’, ‘Germany as a plaster model’, ‘Imports and exports’.
-
Using the software
With the full interface: year, tiles, an event, switching off a power plant, CO₂ view, diagram with panel, search.
Facilities and areas in the model
-
Power plants (162)
Nuclear, lignite and hard coal, gas, oil, hydro, biomass, waste, pumped storage – each with units, capacity and years of operation.
-
Wind farms and turbines
Onshore by capacity per federal state, offshore every turbine with its year.
-
Photovoltaics
Fields by capacity per federal state.
-
Open-cast mines and collieries (96)
Mining of lignite and hard coal.
-
Refineries, gas storage, LNG terminals
Oil and gas with their pipelines.
-
Grid
Ten grid regions, corridors between them, couplings to the neighbours, extra-high-voltage lines.
-
Twelve walkable places
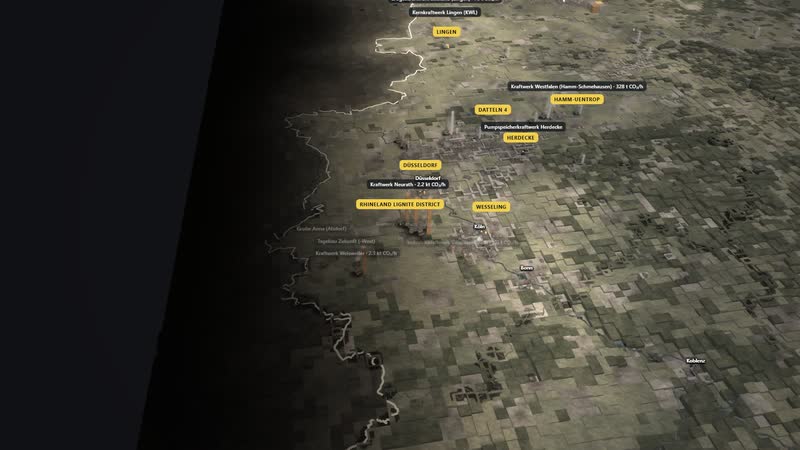
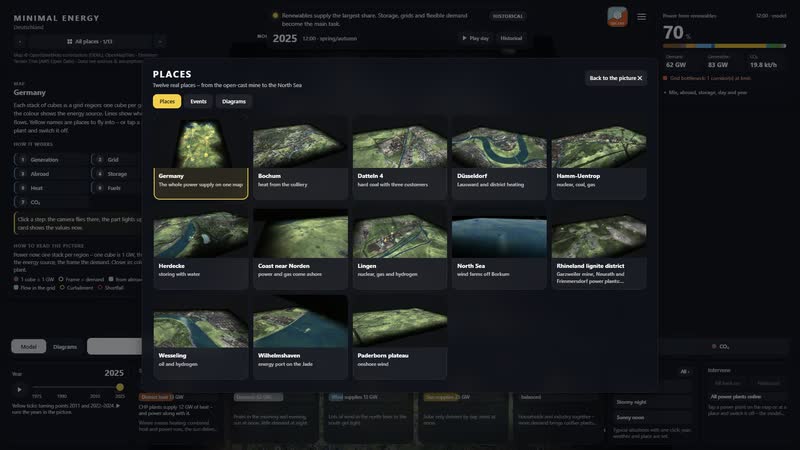
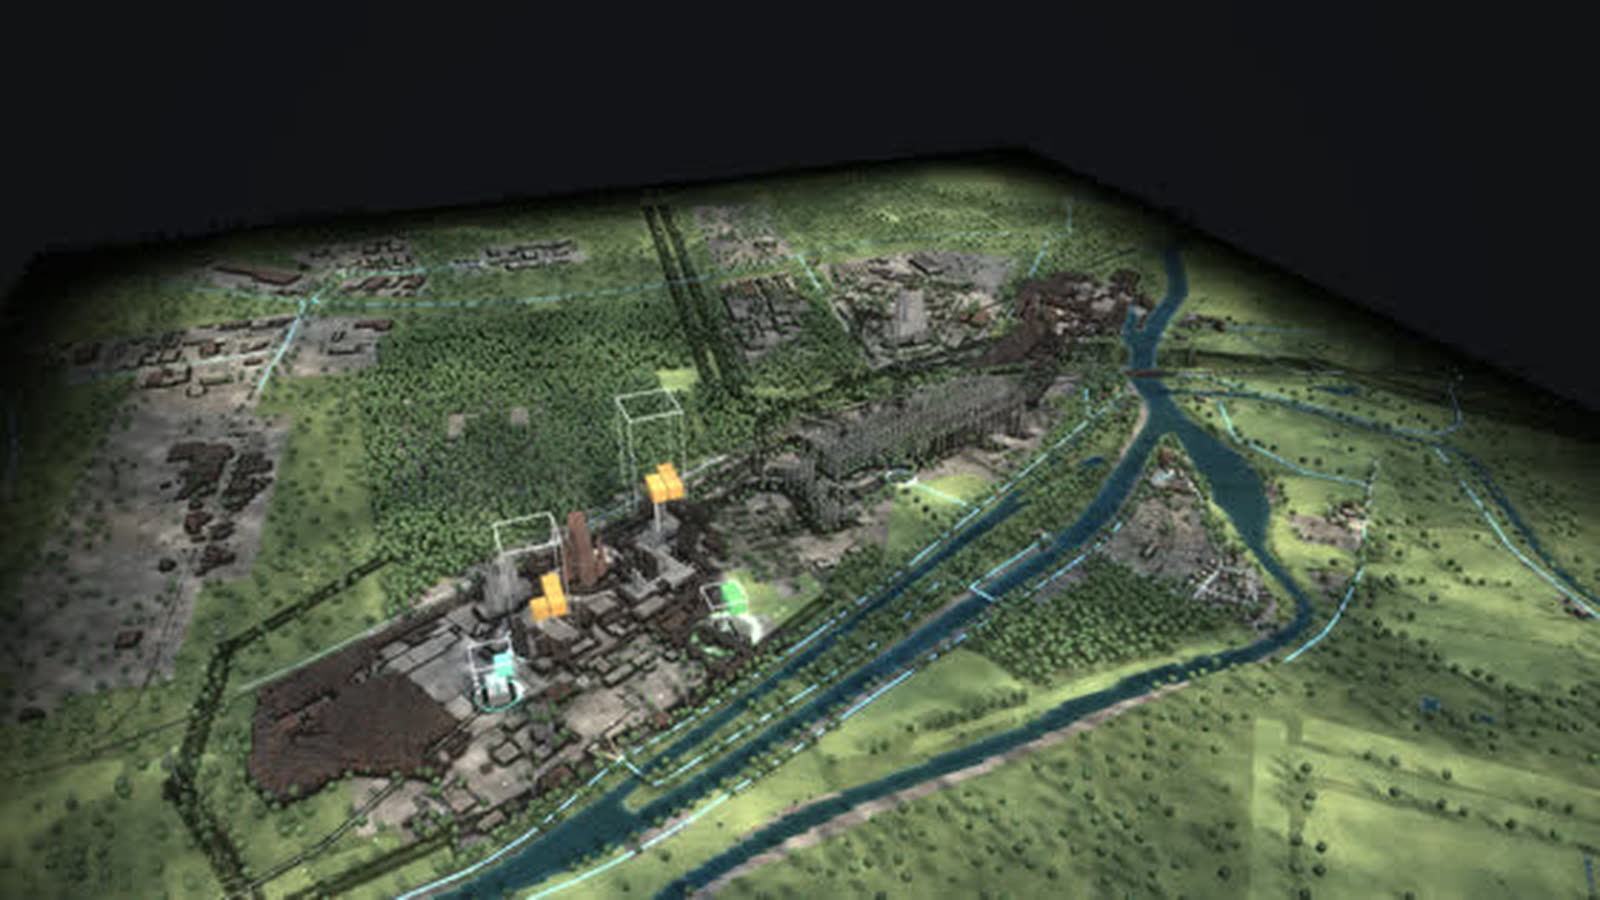
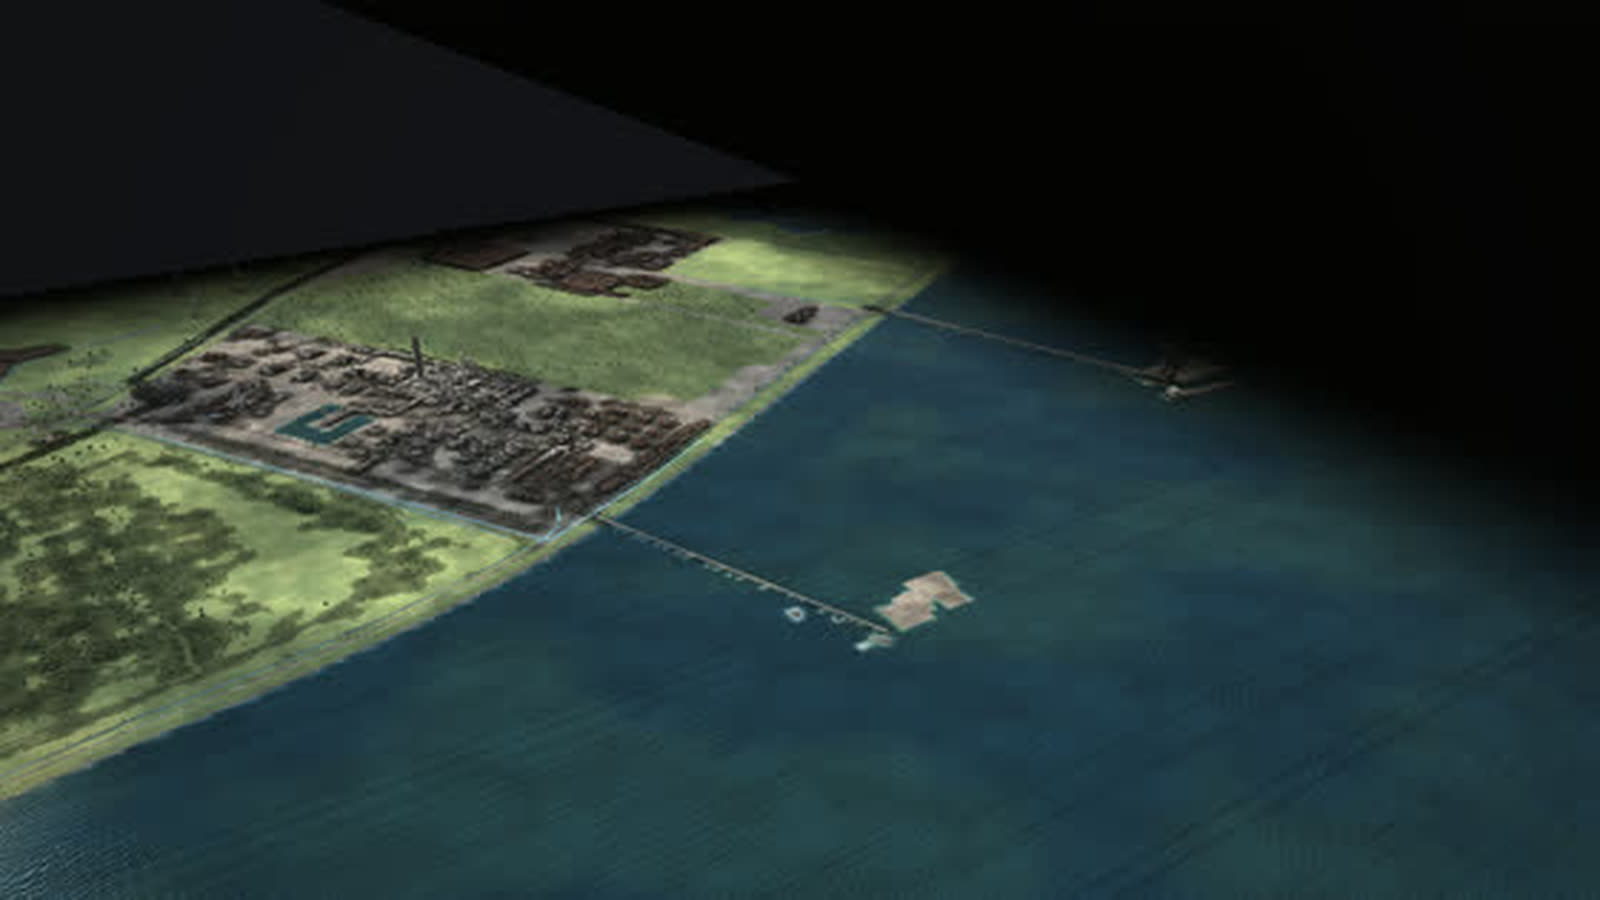
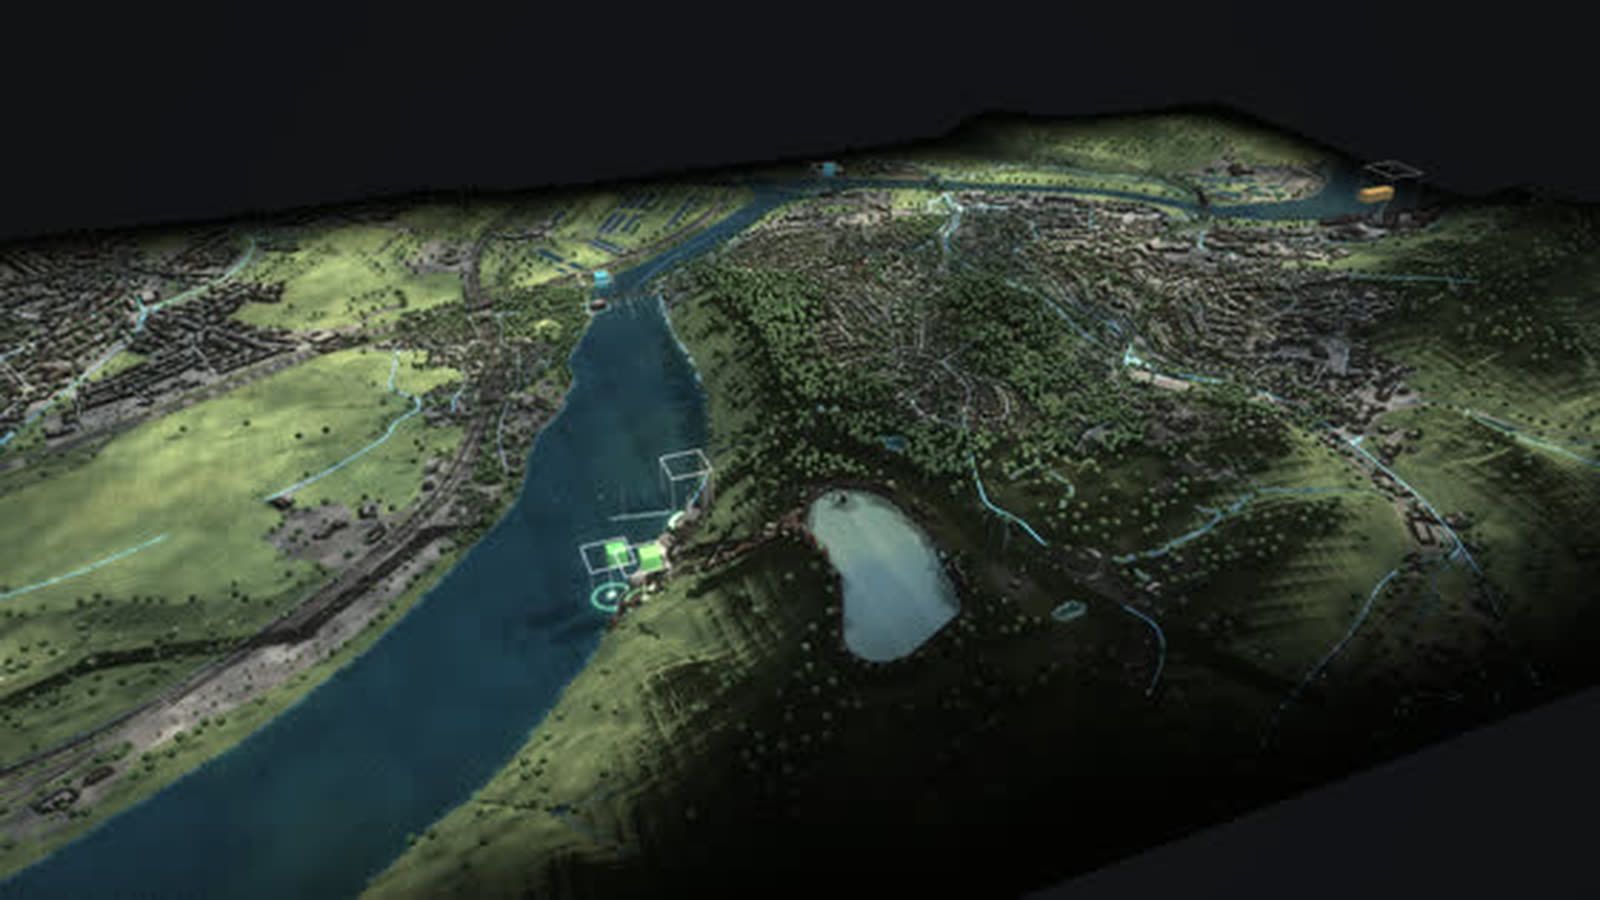
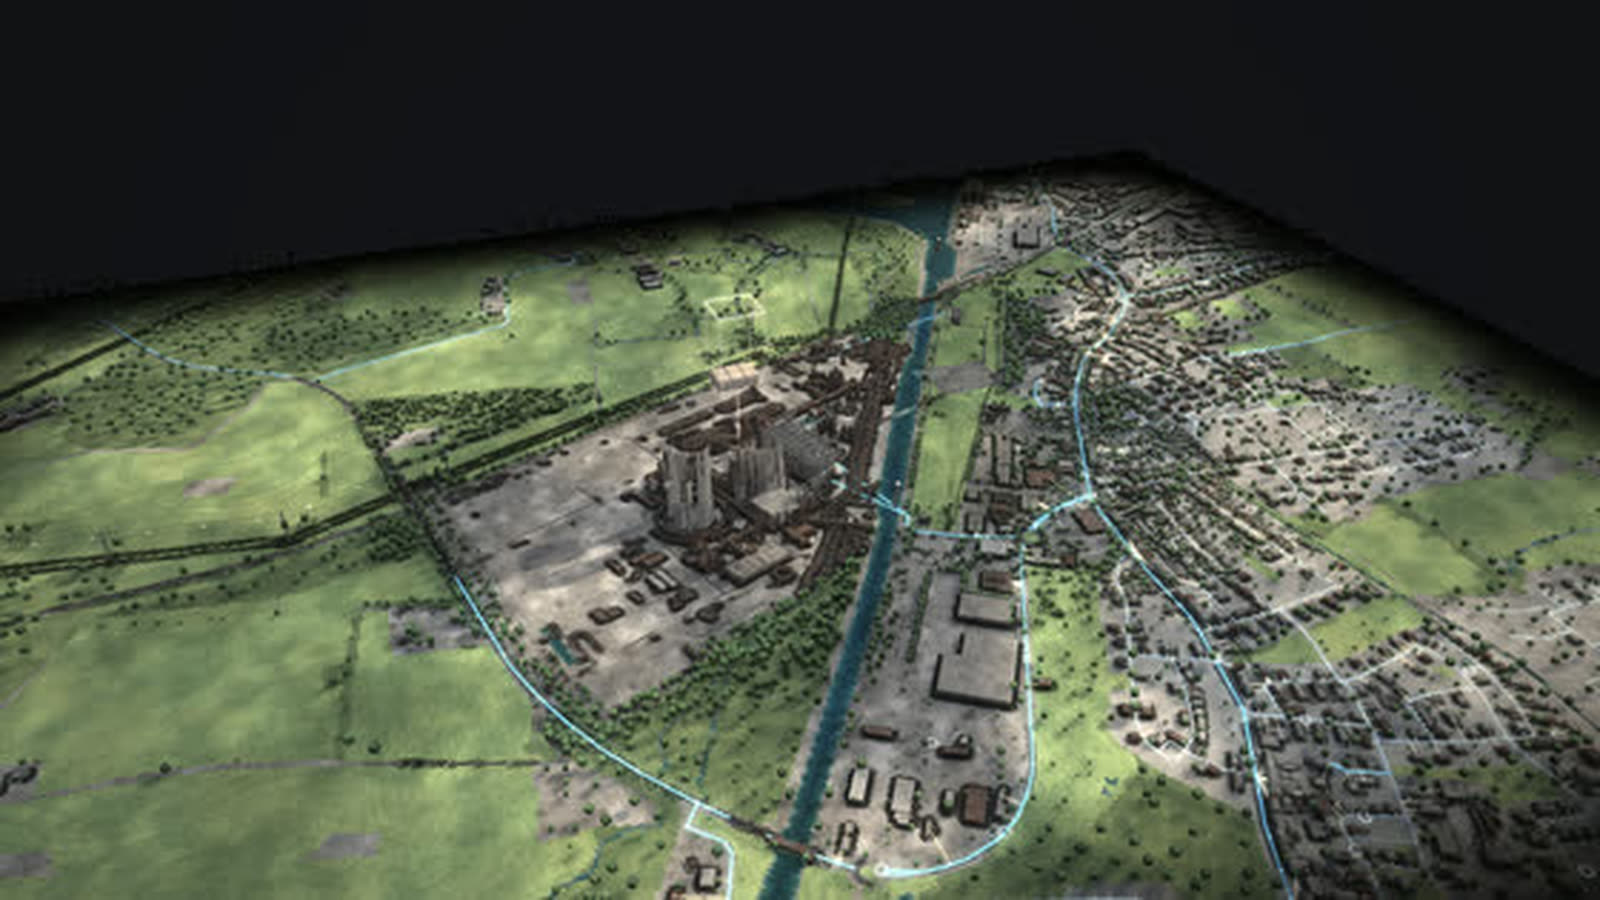
Rhineland lignite district, Düsseldorf Lausward, Herdecke, Datteln 4, Lingen, Paderborn plateau, North Sea off Borkum, Wesseling, Wilhelmshaven, Coast near Norden, Bochum · MARK 51°7, Hamm-Uentrop.
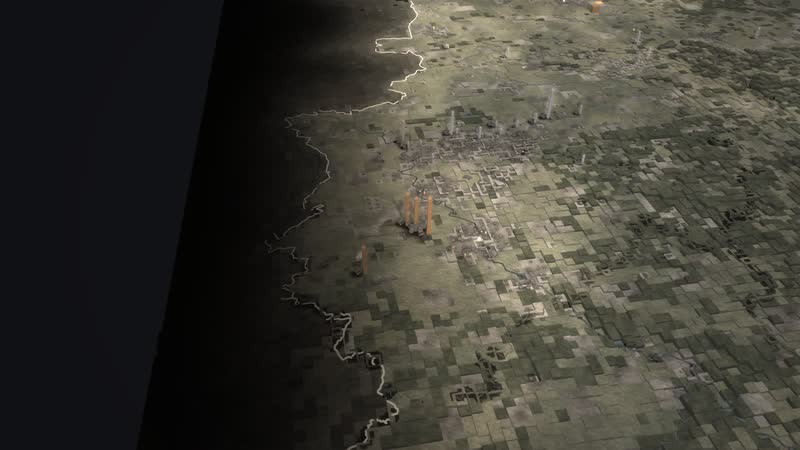
05
Every power plant with its value
Closer in, columns stand next to every plant – by output or emissions in this hour.
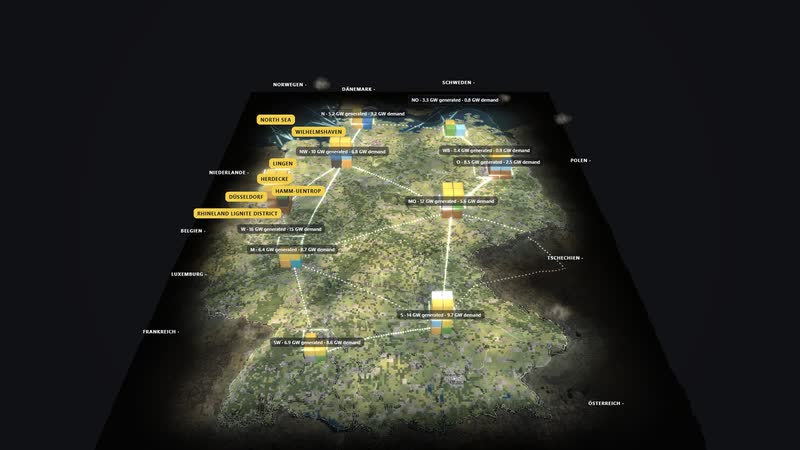
06
Numbers right on the map
Regions with their values – generation and demand in gigawatts, power exchanged with the neighbours at the borders.
Processes in the model
Power now
- 01One cube stack per region (1 cube = 1 GW)
- 02arcs between the regions (dots = power, red = congestion)
- 03borders (imports, exports)
- 04frame = demand
Changing a situation
- 01tile for season, time of day, wind, sun or demand
- 02the model recalculates
- 03stacks, arcs and key figures follow at once
- 04“What is happening” reports the effect
Switching off a power plant
- 01tap a power plant
- 02“Switch off”
- 03other plants, storage or imports step in
- 04CO₂ and imports change
Fifty years
- 011975
- 021990: the grids grow together
- 032011: nuclear plants go
- 042023: end of nuclear power
- 052025: wind and sun ahead
How the map of Germany can be used
-
Operations and grid planning
Ten grid regions, corridors and couplings to the neighbours in one picture: where the arcs turn red, there is congestion. The diagram ‘Who supplies first’ shows in which order the plants step in by cost.
适用对象Operators, grid and system planning
-
Municipalities and regions
What does your own region contribute? The regional values give generation and demand in gigawatts, the CO₂ view kilotonnes per hour and grams per kilowatt hour – a basis for talks about expansion and structural change.
适用对象Municipalities, economic development, chambers and associations
-
Schools and universities
What happens on the grid during dark doldrums? One click sets the winter evening without wind or sun: gas and coal plants, storage and imports carry almost all of the demand. The tour leads through fifty years in nine steps.
适用对象Teachers, pupils, energy engineering students
-
Museums and exhibitions
Fifty years in thirty seconds: coal and nuclear go, wind and sun come, the grids of East and West grow together. At the welcome, visitors choose: explore themselves, take the tour or watch.
适用对象Museums, exhibitions, visitor centres
-
Public communication and structural change
Coal exit, nuclear exit, energy transition: the diagram ‘CO₂ since 1990’ shows emissions per year and per kilowatt hour, the CO₂ view the same hour in 1990 and 2025 – wind and sun shrink the stacks.
适用对象Public relations, associations, policymakers and administration
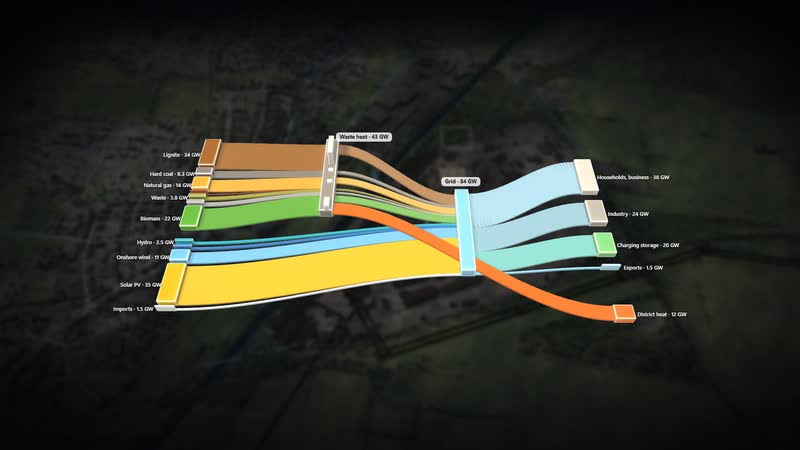
07
Diagrams from the model
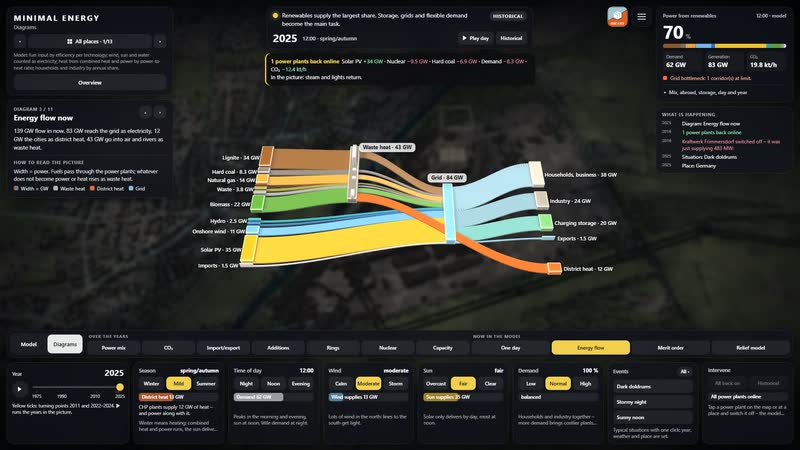
Eleven diagrams are calculated live from the same data and lit like a film – here the energy flow of this hour.
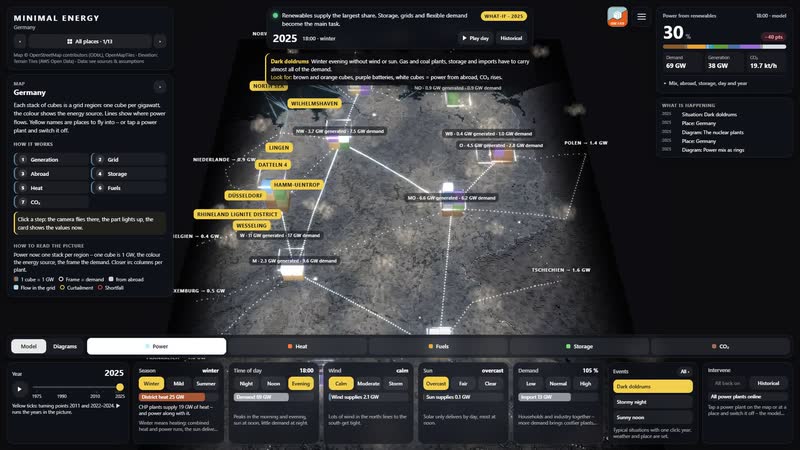
08
The whole software
Year, tiles, views, events, switching off, search and tour – everything acts on the picture at once.
What you can change
Controls
- Year 1975–2025: plants appear and disappear, mix and grid change; ▶ lets the years run.
- Season: snow, foliage, meadows, chimney smoke; more heat and power demand in winter, more sun in summer.
- Time of day: sun position, dusk, night with windows and street lights; demand follows the daily profile.
- Wind: rotors turn faster, sea state, smoke plumes lie flat; wind power rises, curtailment in a storm.
- Sun: clouds and soft shadows; photovoltaics deliver more or less.
- Demand (households, industry): more lit windows, plant lighting, chimney smoke; more expensive plants step in.
- Views: power, heat, fuels, storage, CO₂ – each with its own columns, stacks and values.
Events
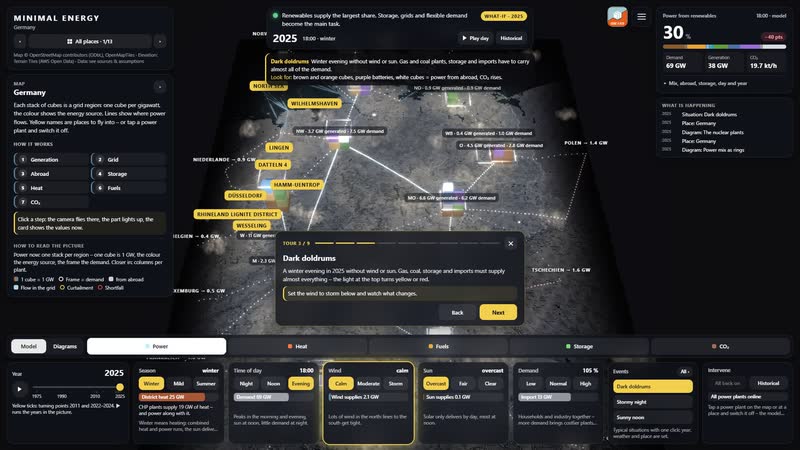
- Dark doldrums: Winter evening without wind or sun. Gas and coal plants, storage and imports have to carry almost all of the demand. Look for: brown and orange cubes, purple batteries, white cubes = power from abroad, CO₂ rises.
- Stormy night: Winter gale at 3 am with low demand. Wind delivers more than is needed. Look for: blue cubes above the frame, power flows south and abroad, yellow rings show curtailment, storage charges.
- Sunny noon: Sunday in June, 1 pm, cloudless. Solar covers more than half of the demand. Look for: yellow cubes mainly in the south, coal throttles, batteries charge, power goes abroad.
- Winter evening 1985: Two separate grids: nuclear and hard coal in the West, lignite in the GDR. Wind and solar play no role yet. Look for: pink and brown cubes, no power between East and West.
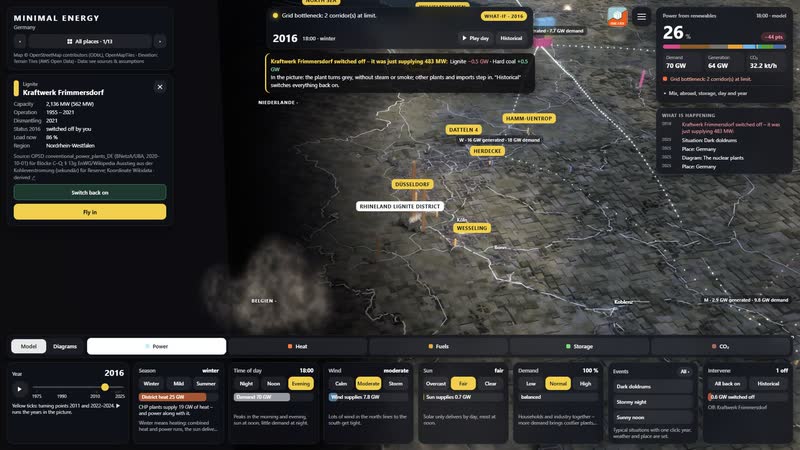
- Switch off: Kraftwerk Frimmersdorf: The model calculates without this plant; the top shows who steps in, CO₂ and imports change.
What the map offers
-
01
Fifty years on one map
The year slider shows 1975, 1990, 2000, 2011 and 2025 on the same map. Plants appear and disappear, mix and grid change; ▶ lets the years run.
-
02
Calculated every hour
Wind, sun, season, time of day and demand act at once: stacks, arcs and key figures follow, and ‘What is happening’ reports the effect.
-
03
Intervene instead of watching
Tap a power plant, ‘Switch off’: the model shows at once whether other plants, storage or imports step in and how CO₂ and imports change.
-
04
Five views, one world
Power, heat, fuels, storage and CO₂ – each view with its own columns, stacks and values right on the map. The search in the menu finds places, power plants with capacity and years, diagrams and events.
-
05
Twelve places to walk through
From the map you enter twelve walkable places, from the Rhineland lignite district to Hamm-Uentrop, each with its own picture. Designed by an artist and developer.
-
06
In the browser and on the big screen
A browser is enough, and for talks, lessons and exhibitions the map also holds up on large projections. The tour leads through fifty years of energy in nine steps.
-
Germany 2025 at noon – one stack per grid region, one cube is 1 GW of power in this hour. -
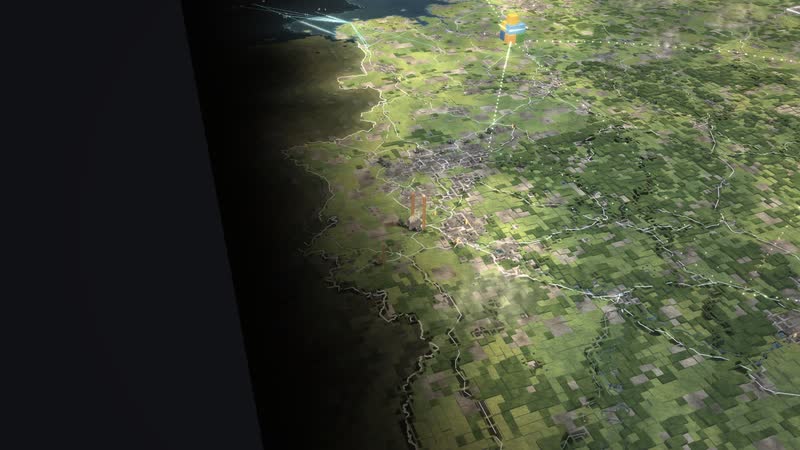
The map from the north – coast and wind farms in front, the Alps on the horizon. -
Evening over Germany – the cities glow, power flows on the arcs between the regions. -
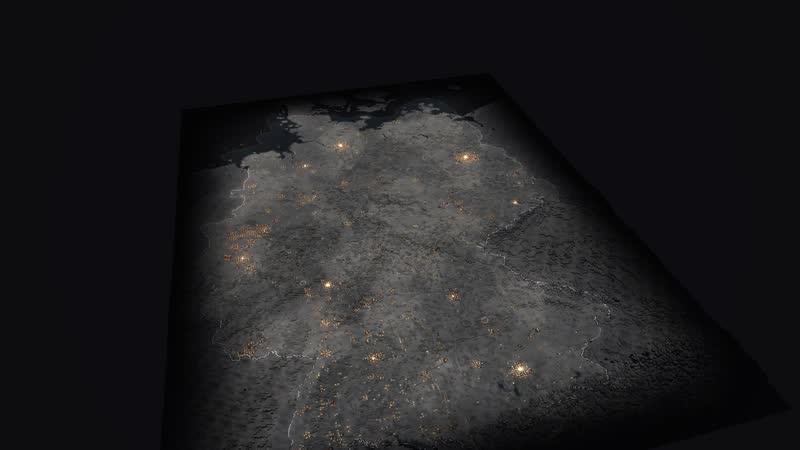
Night – cities as points of light, the stacks show who delivers now. -
Winter – snow on the land, demand is high. -
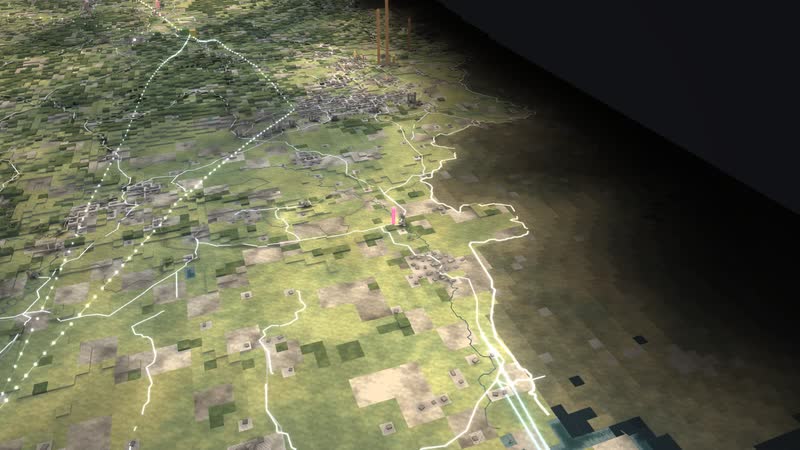
The Rhineland close up – open-cast mines, power plants and the yellow names of the walkable places. -
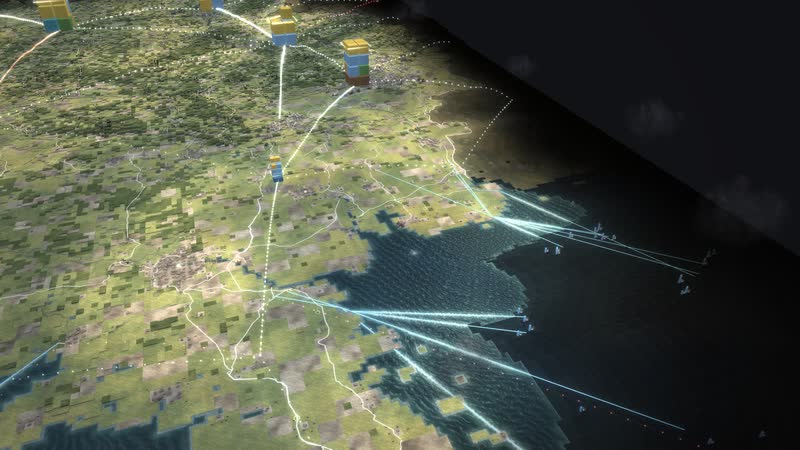
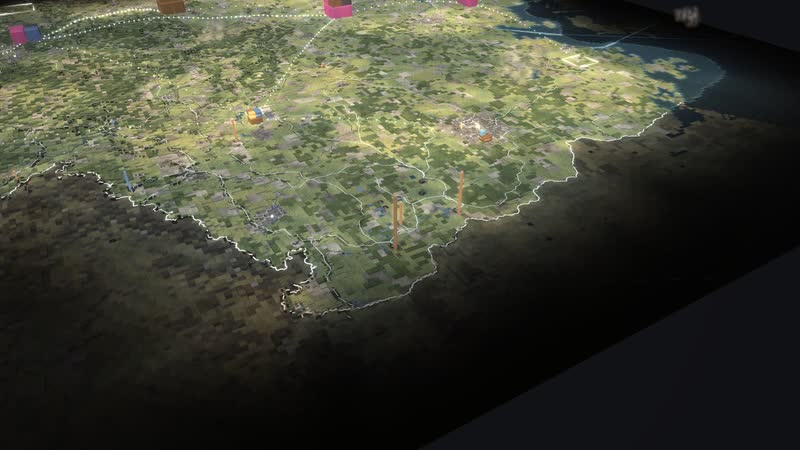
The coast – wind turbines on land and at sea, cables bring the power inland. -
1990 from the east – two power systems that are only starting to grow together. -
Sunny noon – Sunday in June, 1 pm, cloudless. Solar covers more than half of the demand. -
Dark doldrums – Winter evening without wind or sun. Gas and coal plants, storage and imports have to carry almost all of the demand. -
Stormy night – Winter gale at 3 am with low demand. Wind delivers more than is needed. -
Winter evening 1985 – Two separate grids: nuclear and hard coal in the West, lignite in the GDR. Wind and solar play no role yet. -
Heat view – rings show the heat demand of the regions and combined heat and power. -
Fuels view – gas, oil and hydrogen pipelines with their flow, coal from the mine to the plant. -
Storage view – pumped storage and batteries, green charges, orange discharges. -
CO₂ view 1990 – one stack per region, one cube is 1,000 t of CO₂ in this hour. -
The same hour in 2025 – wind and sun shrink the CO₂ stacks. -
1975 – coal, oil and the first nuclear plants, East and West with separate grids. -
1990 – the year of reunification, the grids are still separate. -
2000 – the first large wind farms, the grid has grown together. -
2011 – after Fukushima eight nuclear plants go off the grid. -
2025 – wind and sun deliver most of it, storage and grids become the main task. -
The Rhineland in 1990 in the CO₂ view – columns by the emissions of each plant. -
The Emsland in 2015 – nuclear and gas side by side, the columns show the output now. -
The east close up – lignite in Lusatia and around Leipzig. -
Regions with their values – generation and demand in gigawatts, power exchanged with the neighbours at the borders. -
CO₂ per region – kilotonnes per hour and grams per kilowatt hour. -
Closer in, every power plant names its emissions now. -
Diagram ‘Power mix 1975–2025’ – how generation by source shifts over fifty years. -
Diagram ‘Energy flow now’ – how fuels, power, heat and losses flow in this hour. -
Diagram ‘Who supplies first’ – in which order the plants step in by cost. -
Diagram ‘CO₂ since 1990’ – the CO₂ emissions of power generation per year and per kilowatt hour. -
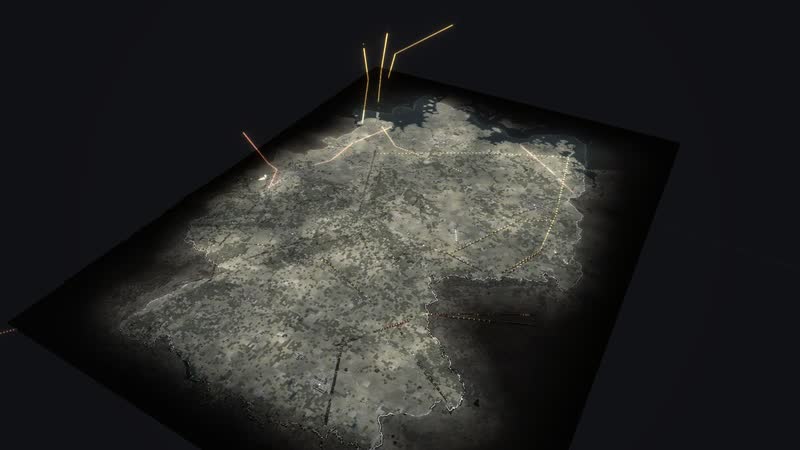
Diagram ‘Germany as a plaster model’ – the country as a relief with the sites. -
Diagram ‘Imports and exports’ – power across the borders to the neighbours. -
Diagram ‘Power mix as rings’ – the power mix of a year as rings. -
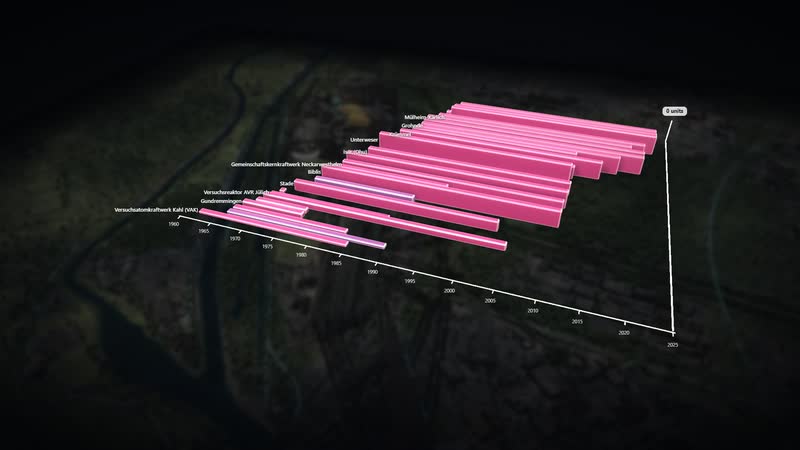
Diagram ‘The nuclear plants’ – every nuclear plant from start-up to shutdown. -
The whole software – place selection, situation, power from renewables, views, year and tiles. -
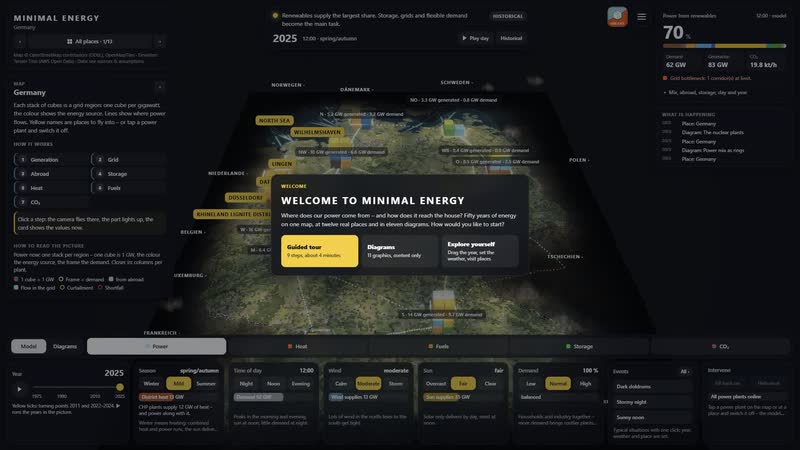
Welcome – three ways in: explore yourself, guided tour or watch. -
The tour leads through fifty years of energy in nine steps. -
Event dark doldrums – one click sets year, weather and demand, the panel says what to look for. -
Intervene yourself – a power plant switched off, the model shows at once who steps in. -
Diagram ‘Energy flow now’ with its panel – the finding in one sentence. -
CO₂ view with legend and regional values. -
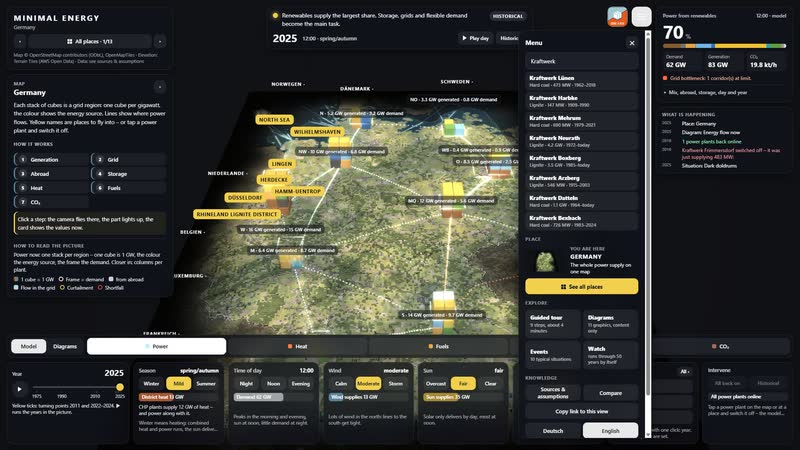
Search in the menu – about 500 power plants with capacity and years, places, diagrams and events. -
The menu – tour, diagrams, events, watch, comparison, link and language. -
Twelve walkable places and the map of Germany, each with its own picture.
Your region as a model
Would you like to show your grid region, your supply area or your plants this way, with your own figures? Write to us or give us a call, and we will discuss which data the model needs. We will send you the password to the simulation on request.
cube4tec.de/spiele/minimal-energy/
就此咨询
Minimal Energy: Deutschland 1975–2025
Basis and limits
Real are the location, capacity and operating years of the 365 sites (AG Energiebilanzen, German Environment Agency, Federal Network Agency, BASE) as well as grid and terrain (OpenStreetMap, open elevation data). What happens each hour – dispatch, flows between the ten regions, storage, CO₂ – is calculated by a deliberately simple model; corridors and couplings are model assumptions.
Public sources the model is based on:
- Geobasis NRW (dl-de/zero-2.0)
- LGLN Niedersachsen (CC BY 4.0)
- OpenStreetMap-Mitwirkende (ODbL)
- Marktstammdatenregister der Bundesnetzagentur (dl-de/by-2-0)
- Wikipedia: Liste der deutschen Offshore-Windparks (sekundaer)
- Wikipedia: Liste der Erdölraffinerien (sekundär)
- Wikipedia: Liste von Pumpspeicherkraftwerken (sekundaer)
- BASE Stilllegungsliste (07/2026); Netto: Wikipedia (sekundär); Koordinate: Wikidata
- BVEG Jahresbericht 2025 (Daten LBEG)
- Wikipedia: Liste deutscher Braunkohletagebaue (sekundär); Koordinate Wikidata
- OPSD; Wikipedia: Ausstieg Kohleverstromung / Liste fossil-thermischer Kraftwerke (sekundär)
- OPSD; Wikipedia: Liste fossil-thermischer Kraftwerke (sekundär)
- Wikipedia: Liste von Solarkraftwerken in Deutschland (sekundaer)
- OPSD; Wikipedia: Liste fossil-thermischer Kraftwerke (sekundär)
- Wikipedia: Liste von Wasserkraftwerken in Deutschland (sekundaer)
More places in the model
-
Rhineland lignite district
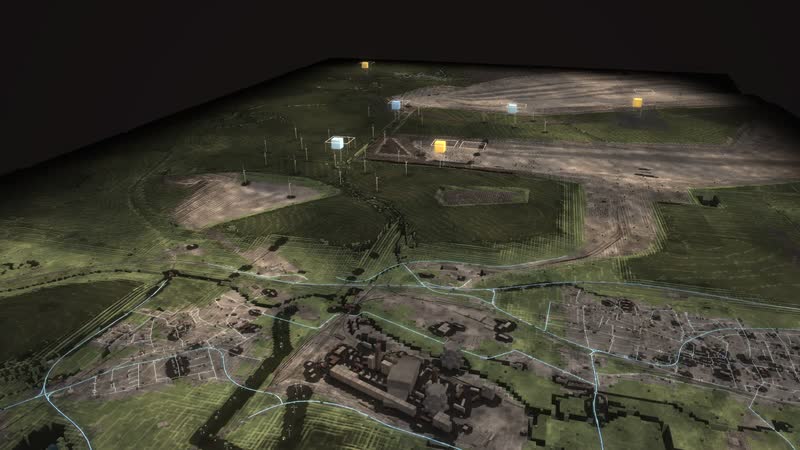
The Rhineland lignite district as a walkable model: from the Garzweiler mine via conveyors, boilers and cooling towers into the 380 kV grid – while wind, sun and batteries grow on the reclaimed land.
-
North Sea off Borkum
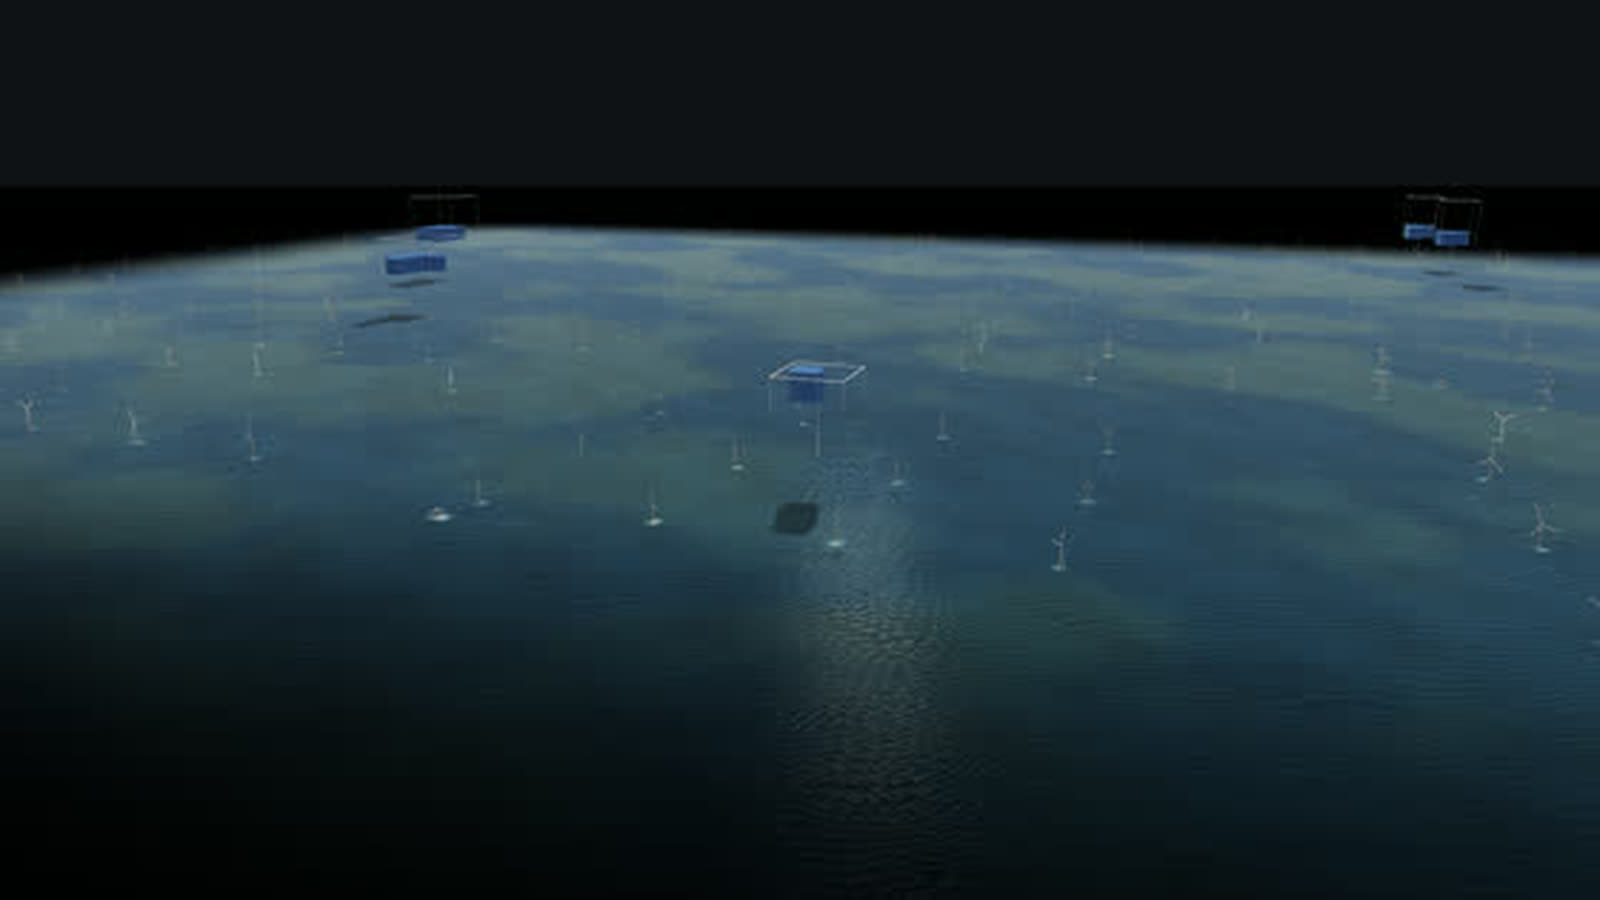
The beginning of German offshore wind as a walkable model: twelve test turbines from 2009, a cluster of 284 turbines and about 1,660 MW, substation and converter platforms and the way ashore.
-
Lingen
The whole nuclear era in one place as a walkable model: the Lingen nuclear plant of 1968, the Emsland nuclear plant until April 2023, interim storage and dismantling – next to them gas, a battery and hydrogen.
-
Wilhelmshaven
Germany’s only deep-water port as a walkable model: crude oil for the pipeline to the Rhineland, coal for two power plants and, since December 2022, liquefied natural gas from Germany’s first LNG terminal.
-
Herdecke
Three generations of storage at Lake Hengstey as a walkable model: the Koepchenwerk of 1930, the pumped-storage plant of 1989 and batteries since 2017 – the level in the reservoir follows sun, wind and demand.
-
Datteln 4
Germany’s newest hard-coal plant as a walkable model: coal by ship on the Dortmund-Ems Canal, power for the grid and the railway, district heat as far as Recklinghausen.
-
Düsseldorf Lausward
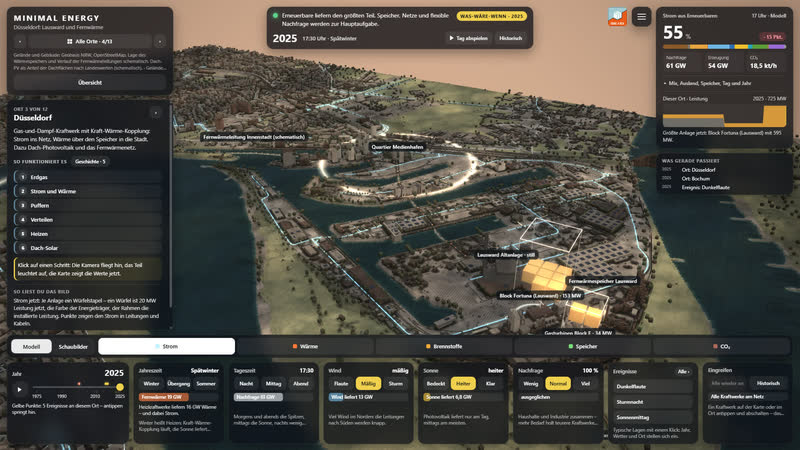
A combined-cycle gas plant on the Rhine as a walkable model: power to the grid, heat via a 58 m storage tank and the district heating line into the media harbour and the city centre.
-
Paderborn plateau
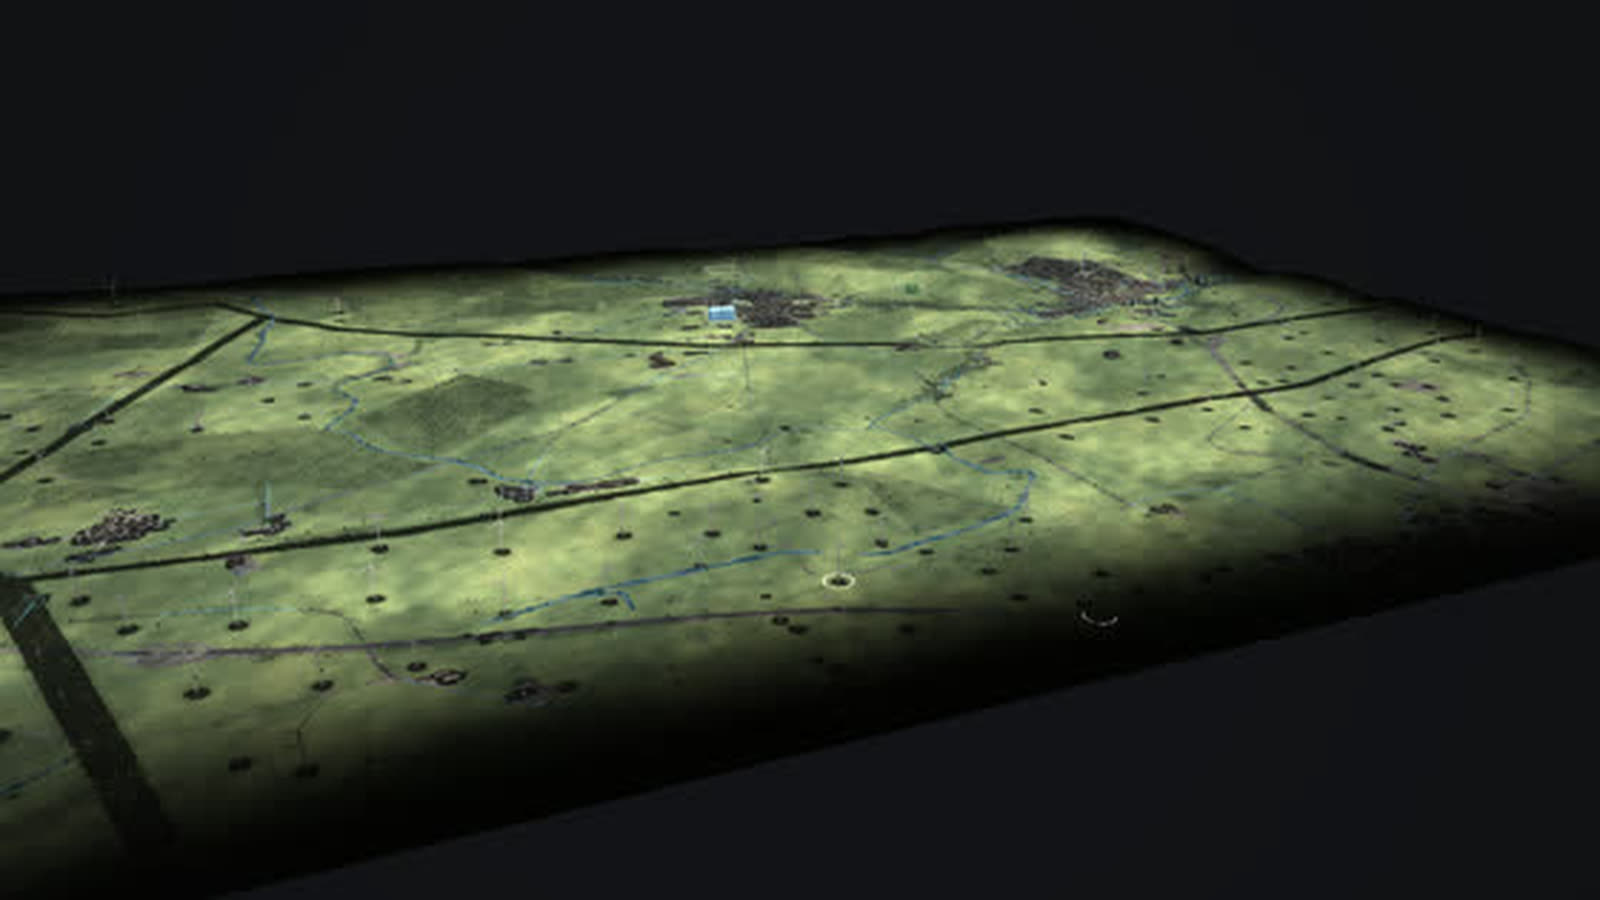
One of the densest wind landscapes in North Rhine-Westphalia as a walkable model: every turbine with its year, from the 500 kW turbine of 1995 to the 6.2 MW turbine with a 169 m hub.
Real are the location, capacity and operating years of the 365 sites from public sources (AG Energiebilanzen, German Environment Agency, Federal Network Agency, BASE) as well as grid and terrain (OpenStreetMap, open elevation data). What happens each hour – dispatch, flows between the ten regions,…