
シミュレーション · Minimal Energy · Gas, oil and hydrogen
Wilhelmshaven
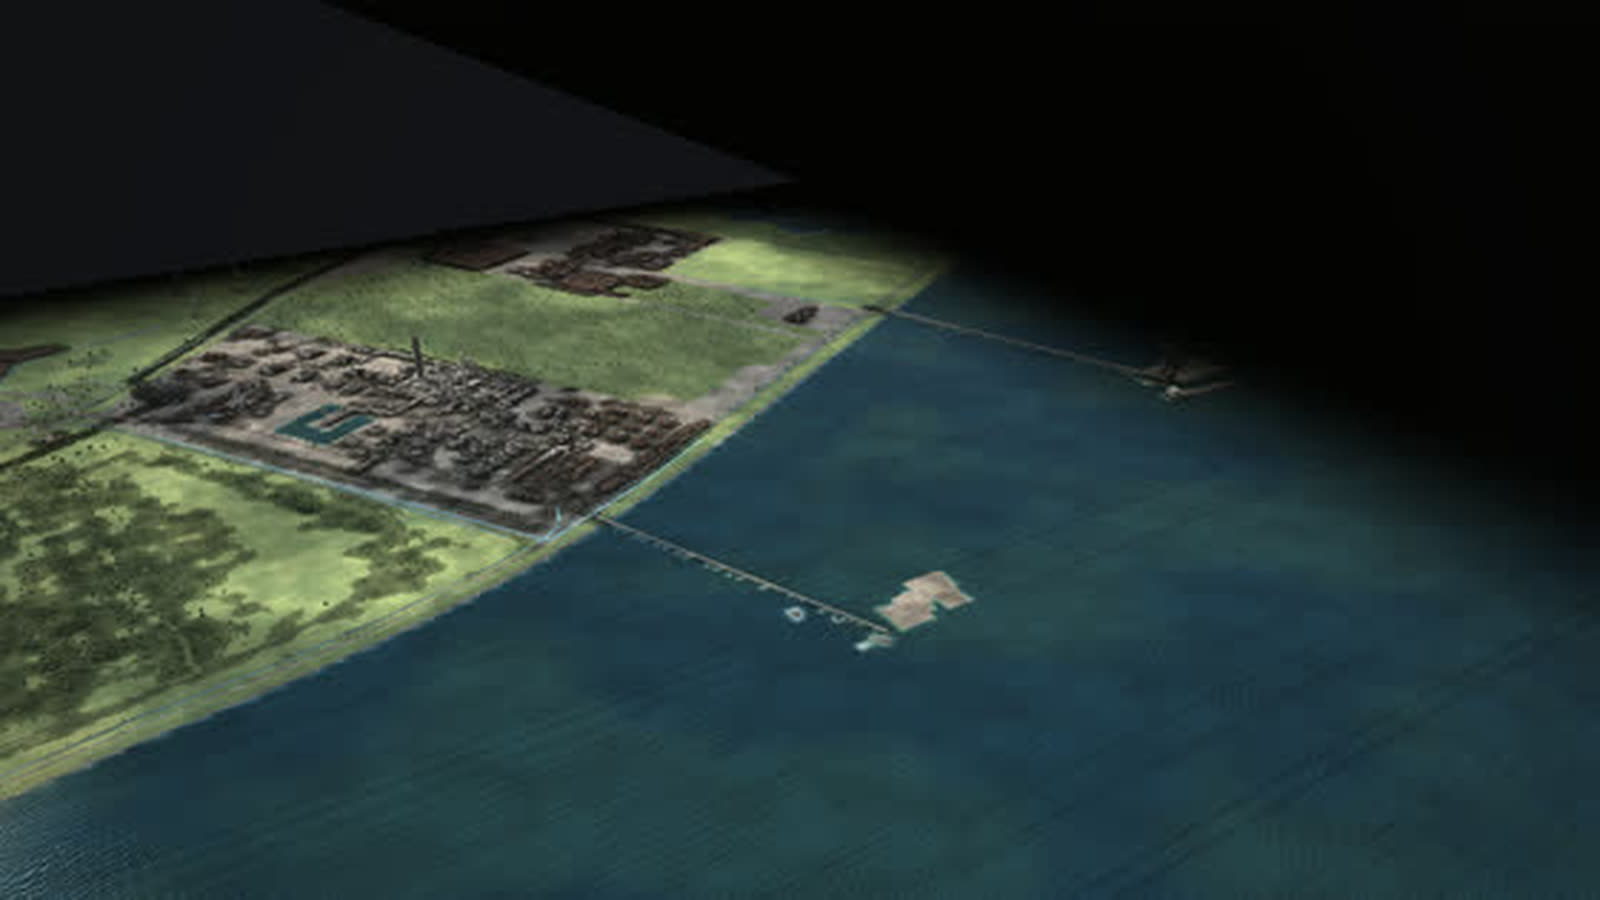
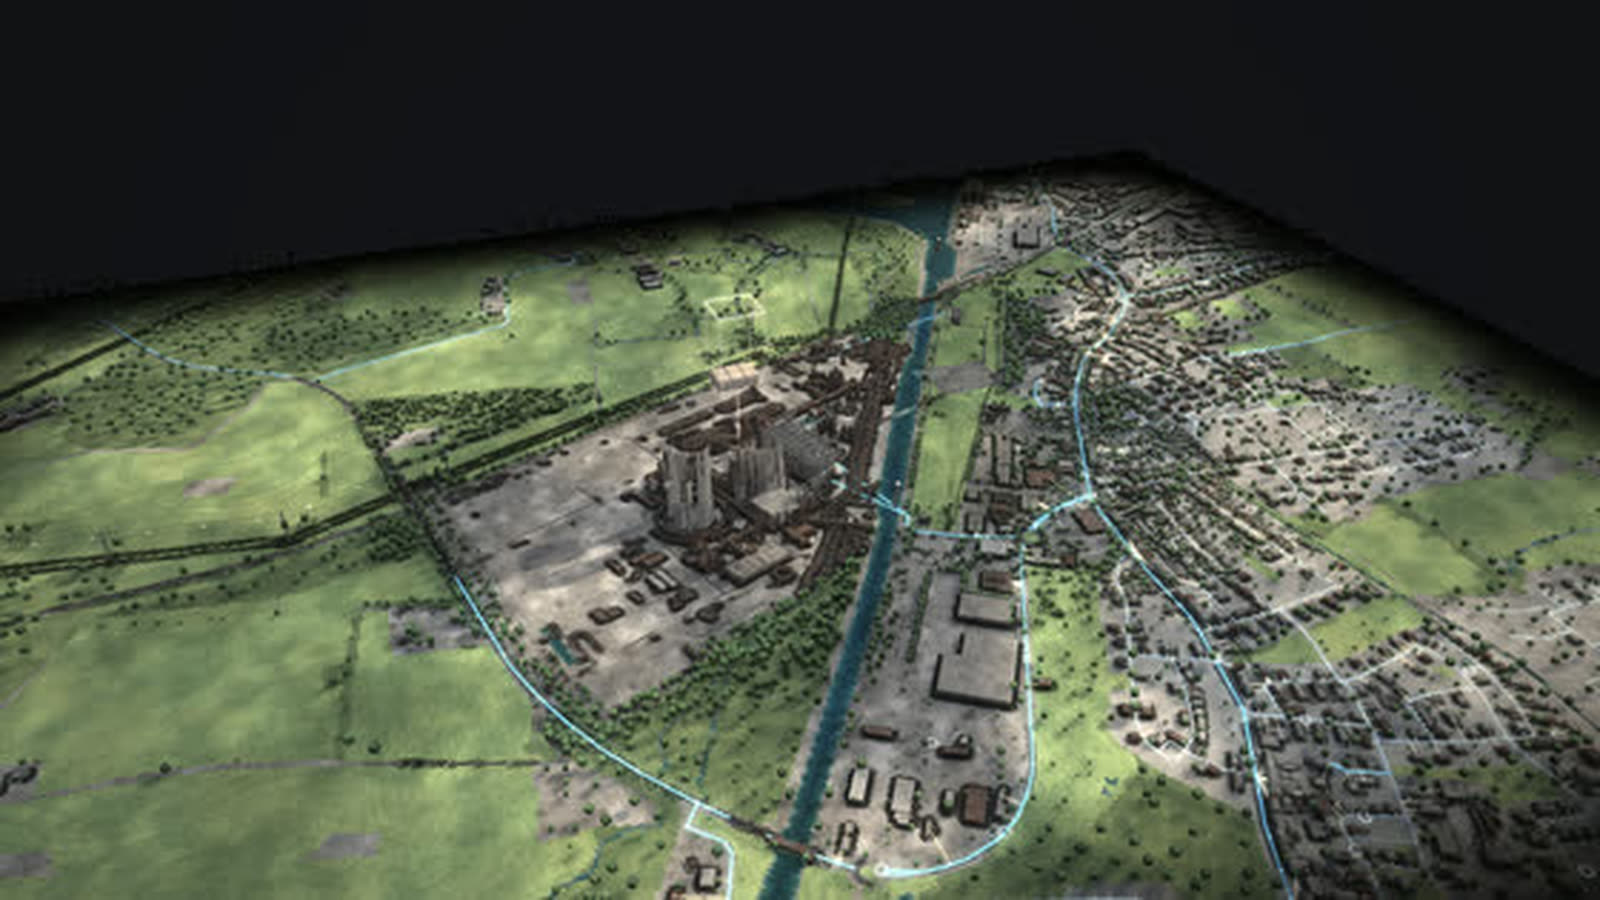
Germany’s only deep-water port as a walkable model: crude oil for the pipeline to the Rhineland, coal for two power plants and, since December 2022, liquefied natural gas from Germany’s first LNG terminal.
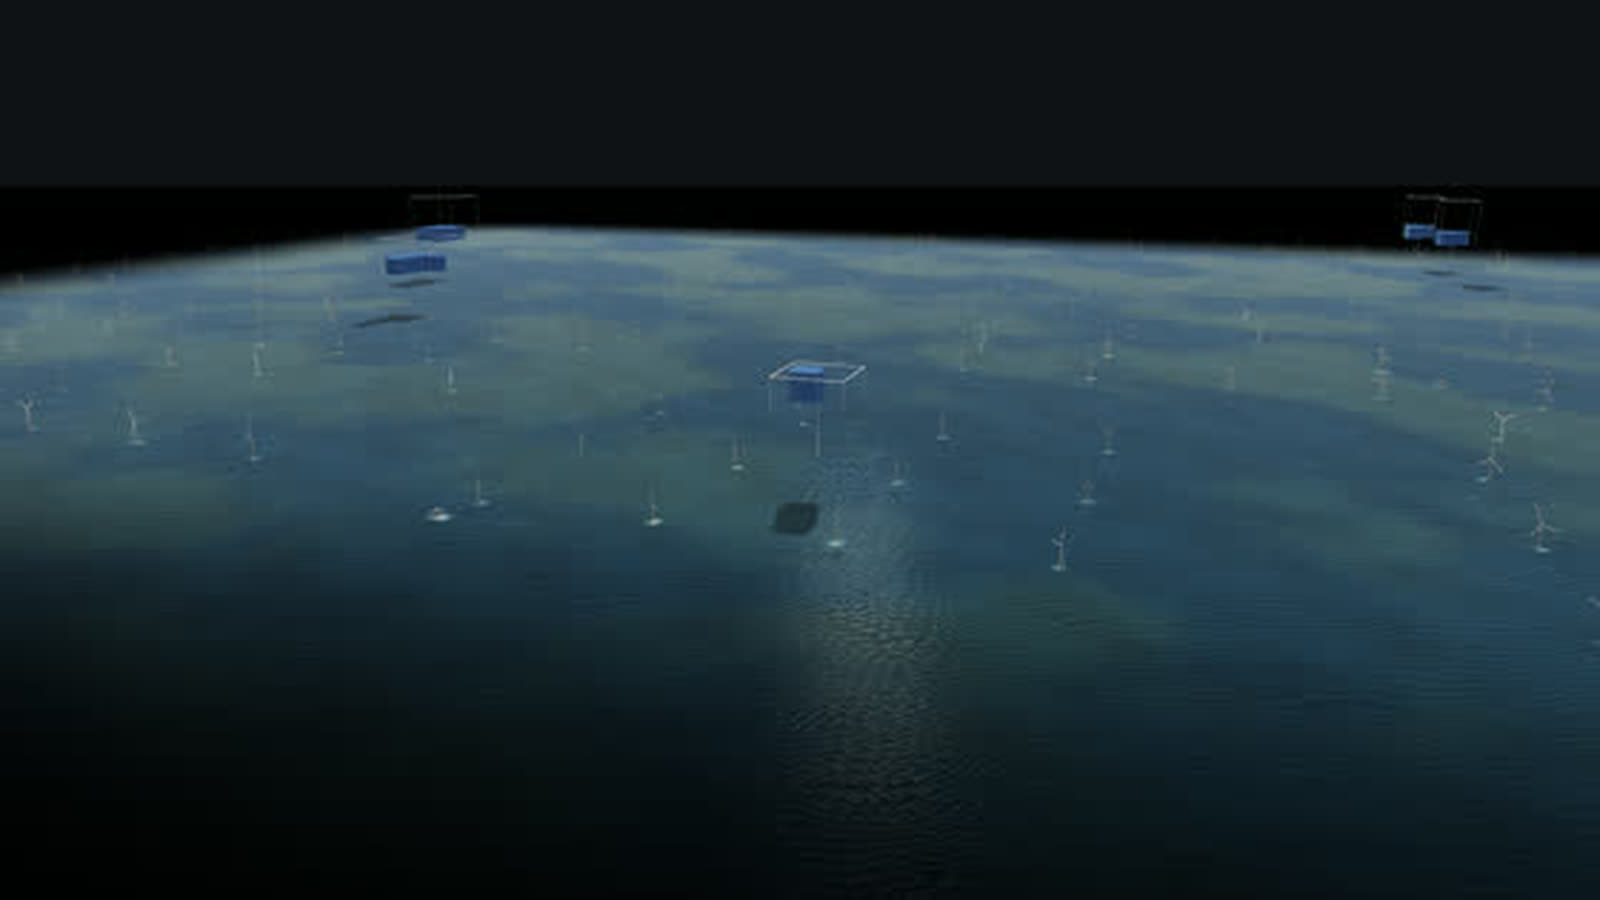
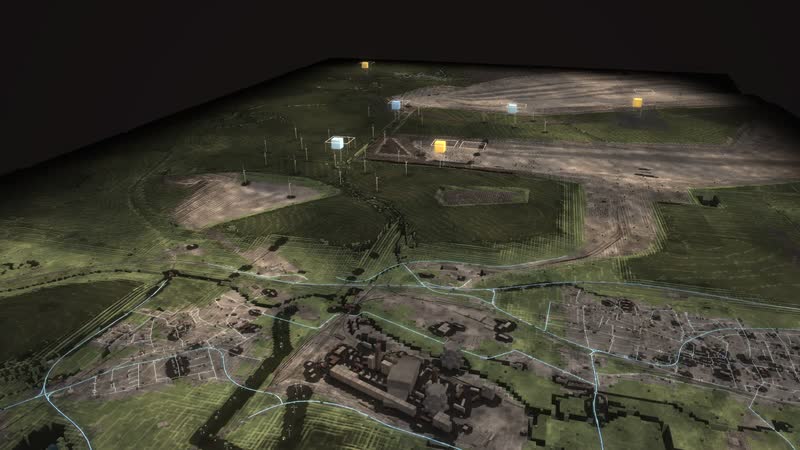
Real are terrain and buildings (LGLN Lower Saxony, OpenStreetMap), the Jade and the mudflats by elevation, and the power plants, terminals and tank farms with their years. The berth of the second LNG terminal is derived from the connecting pipeline; coal conveyors and ship traffic are schematic. With your data the model shows more, such as real ship arrivals, volumes per terminal or tank farm levels.
The Wilhelmshaven LNG terminal was Germany’s first: opened on 17 December 2022, built in less than a year when Russian pipeline gas stopped. Carriers bring deep-cooled liquefied natural gas at −162 °C, and a terminal ship warms it until it is a gas again – about 5 billion m³ a year. The connecting pipeline carries the gas to the Etzel storage and into the transmission grid; since 29 August 2025 a second floating terminal has been operating.
At Germany’s only deep-water port on the Jade, energy arrives by sea. Crude tankers unload at the jetties in the middle of the Jade, and a pipeline carries the oil about 391 km to the Rhineland. The refinery was built in 1973–1976, shut down in 1985, restarted at the end of 1991 and finally mothballed around 2010; today it is a tank farm, and every tank stands with its outline from OpenStreetMap and its height from the surface model.
Coal ships supply the 731 MW plant of 2015, while the older 757 MW plant went offline in December 2021 after winning the closure tender. At the Fedderwarden substation, power from the coast and the power plants enters the extra-high-voltage grid. For port and plant operators, municipalities and economic development, chambers, schools, universities and museums.
The chain of the place
- 01
LNG: Carriers bring deep-cooled liquefied natural gas (−162 °C) across the sea.
- 02
Gas again: The terminal ship warms it until it is a gas again.
- 03
Into the grid: The connecting pipeline carries the gas to the Etzel storage and into the transmission grid.
- 04
Crude oil: Crude tankers unload at the jetties in the middle of the Jade.
- 05
To the Rhineland: The North-West oil pipeline carries the oil about 391 km to the Rhineland.
- 06
Coal: Coal ships supply the new plant; the older one has been idle since the end of 2021.
What is shown – why – for whom
| 表示内容 | なぜ | 対象 |
|---|---|---|
| The chain LNG – Gas again – Into the grid – Crude oil – To the Rhineland – Coal | なぜshows three energy sources that arrive by sea | 対象Schools, visitors |
| Event ‘LNG from 2022’ | なぜshows the new gas supply by ship | 対象The public, museums |
| Fuels view | なぜmakes the terminal, the pipelines and the fuels glow in their colours | 対象Planning, exhibitions |
| Diagram ‘Energy flow now’ | なぜshows how fuels, power, heat and losses flow in this hour | 対象Universities, energy industry |
| Diagram ‘CO₂ since 1990’ | なぜshows the CO₂ emissions of power generation per year and per kilowatt hour | 対象Climate protection, policymakers |
| Diagram ‘Imports and exports’ | なぜshows power across the borders to the neighbours | 対象Grid planning, associations |
| Switch off: Kraftwerk Wilhelmshaven (seit 2015) | なぜshows who steps in and how CO₂ and imports change | 対象Planning, teaching |
Facilities and areas in the model
-
Kraftwerk Wilhelmshaven (1976–2021)
Hard coal, 757 MW, on the grid since 1976, finally shut down in December 2021 after winning the closure tender. The chimney is 275 m tall.
-
Kraftwerk Wilhelmshaven (seit 2015)
One of Germany's youngest coal plants: 731 MW net, in operation since 2015. Under the coal exit law, coal ends here by 2038 at the latest; biomass is being considered.
-
Wilhelmshaven refinery (tank terminal today)
The refinery was built in 1973–1976. It was shut down in 1985, restarted at the end of 1991 and finally mothballed around 2010.
-
Tank farms at the oil harbour
Every tank with its outline from OpenStreetMap and its height from the surface model. The North-West oil pipeline company alone has tanks for about 1.6 million m³ here.
-
LNG terminal Wilhelmshaven 1
Germany's first LNG terminal, opened on 17 December 2022: a special ship turns liquefied natural gas back into gas, about 5 billion m³ a year. Built in less than a year when Russian pipeline gas stopped.
-
LNG terminal Wilhelmshaven 2
Second floating terminal, the Excelsior, in commercial operation since 29 August 2025. Berth derived from the route of the second connecting pipeline.
-
Umspannwerk Fedderwarden
380/220 kV: power from the coast and the power plants enters the extra-high-voltage grid here. The 380 kV line to Conneforde has underground cable sections (position OpenStreetMap).
-
Umspannwerk Maade
220 kV, grid connection of the power plants at the port (position OpenStreetMap).
-
Wind turbines near Sengwarden
Wind turbines in the area, each individually from the market master data register.
Processes in the model
The chain of the place
- 01LNG: Carriers bring deep-cooled liquefied natural gas (−162 °C) across the sea.
- 02Gas again: The terminal ship warms it until it is a gas again.
- 03Into the grid: The connecting pipeline carries the gas to the Etzel storage and into the transmission grid.
- 04Crude oil: Crude tankers unload at the jetties in the middle of the Jade.
- 05To the Rhineland: The North-West oil pipeline carries the oil about 391 km to the Rhineland.
- 06Coal: Coal ships supply the new plant; the older one has been idle since the end of 2021.
One day
- 01“Play the day”
- 02the sun moves, wind and demand change every hour
- 03the stacks above the plants grow and shrink
- 04storage charges and discharges
Fifty years
- 01▶ at the year (time travel)
- 021975
- 031995
- 042015
- 052025
- 06plants appear, run, are shut down and dismantled; the history of the place jumps to every year
Intervene
- 01tap Kraftwerk Wilhelmshaven (seit 2015)
- 02“Switch off”
- 03the top shows who steps in
- 04back with “All on again”
How a port can use the model
-
Port and operations
Terminals, jetties, tank farm, power plants and substations on one shore: the model shows how gas, oil, coal and power pass through the port and where they go next.
対象Port and plant operators, site planning
-
Municipality and economy
What came, what went, what is coming? Time travel shows 1975, 1995, 2015 and 2025: refinery, two coal plants, the wind turbines near Sengwarden and finally the two LNG terminals.
対象Municipalities, economic development, chambers and associations
-
Schools and universities
How does an LNG terminal work? The steps LNG, gas again, into the grid, crude oil, to the Rhineland and coal fly to each part, and it lights up.
対象Teachers, energy and process engineering students
-
Museums and exhibitions
The event ‘LNG from 2022’ tells the story of gas supply after deliveries from Russia ended: in the fuels view the terminal and the pipelines into the gas grid light up, and carriers berth.
対象Museums, exhibitions, contemporary history
-
Public communication
One port, many questions: where does the gas come from, where does the oil go, what happens without coal? With ‘Switch off’ the model shows who steps in when the 2015 plant is missing.
対象Public relations, policymakers, neighbours
What you can change
Controls
- Year 1975–2025: plants appear and disappear, mix and grid change; ▶ lets the years run.
- Season: snow, foliage, meadows, chimney smoke; more heat and power demand in winter, more sun in summer.
- Time of day: sun position, dusk, night with windows and street lights; demand follows the daily profile.
- Wind: rotors turn faster, sea state, smoke plumes lie flat; wind power rises, curtailment in a storm.
- Sun: clouds and soft shadows; photovoltaics deliver more or less.
- Demand (households, industry): more lit windows, plant lighting, chimney smoke; more expensive plants step in.
- Views: power, heat, fuels, storage, CO₂ – each with its own columns, stacks and values.
Events
- LNG from 2022: After deliveries from Russia ended, gas arrives by ship. In December 2022 the floating terminal in Wilhelmshaven starts operating. Look for: Fuels view: the terminal and the pipelines into the gas grid light up, carriers berth.
- Winter evening without wind or sun (tiles): Season winter, evening, calm, overcast: demand peaks, the stacks above wind and solar shrink, fossil plants, storage and imports carry the load.
- Stormy night (tiles): Night, gale, low demand: wind delivers more than is needed, storage charges, surplus is curtailed or exported.
- Switch off: Kraftwerk Wilhelmshaven (seit 2015): The model calculates without this plant; the top shows who steps in, CO₂ and imports change.
What the model gives a port
-
01
A port as an energy hub
Gas, oil, coal and power on one coast: the model shows the Jade and the mudflats by elevation, jetties, terminals and pipelines together.
-
02
Contemporary history to walk through
Refinery from 1973, power plant from 1976 to 2021, new power plant from 2015, LNG from 2022: the history of the place jumps to every year.
-
03
Play through situations
Winter evening without wind or sun, stormy night with surplus, LNG from 2022: each situation is set with one click, and the stacks show who delivers.
-
04
Five views
Power, heat, fuels, storage and CO₂ – the same world read five ways, with values right at the plants.
-
05
In the browser and on the big screen
A browser is enough, and large projections work too. Eleven more places and the map of Germany are part of the same model, designed by an artist and developer.
Your port as a model
Would you like to show your port, your terminal or your pipelines this way, with real ship arrivals and volumes? Write to us or give us a call, and we will discuss which data the model needs. We will send you the password to the simulation on request.
cube4tec.de/spiele/minimal-energy/
この件について問い合わせる
Minimal Energy: Wilhelmshaven
Basis and limits
Real are terrain and buildings (LGLN Lower Saxony, OpenStreetMap), the Jade and the mudflats by elevation, and the power plants, terminals and tank farms with their years. The berth of the second LNG terminal is derived from the connecting pipeline; coal conveyors and ship traffic are schematic.
Public sources the model is based on:
- LGLN Niedersachsen (CC BY 4.0)
- OpenStreetMap-Mitwirkende (ODbL)
- Marktstammdatenregister der Bundesnetzagentur (dl-de/by-2-0)
- OPSD; Wikipedia: Ausstieg Kohleverstromung (sekundär)
- Wikipedia: Liste der Erdölraffinerien (sekundär)
- Deutsche Energy Terminal (DET), Fachpresse
- lngindustry.com 29.08.2025 (DET commences commercial operation of LNG terminal WHV02)
More places in the model
-
Wesseling
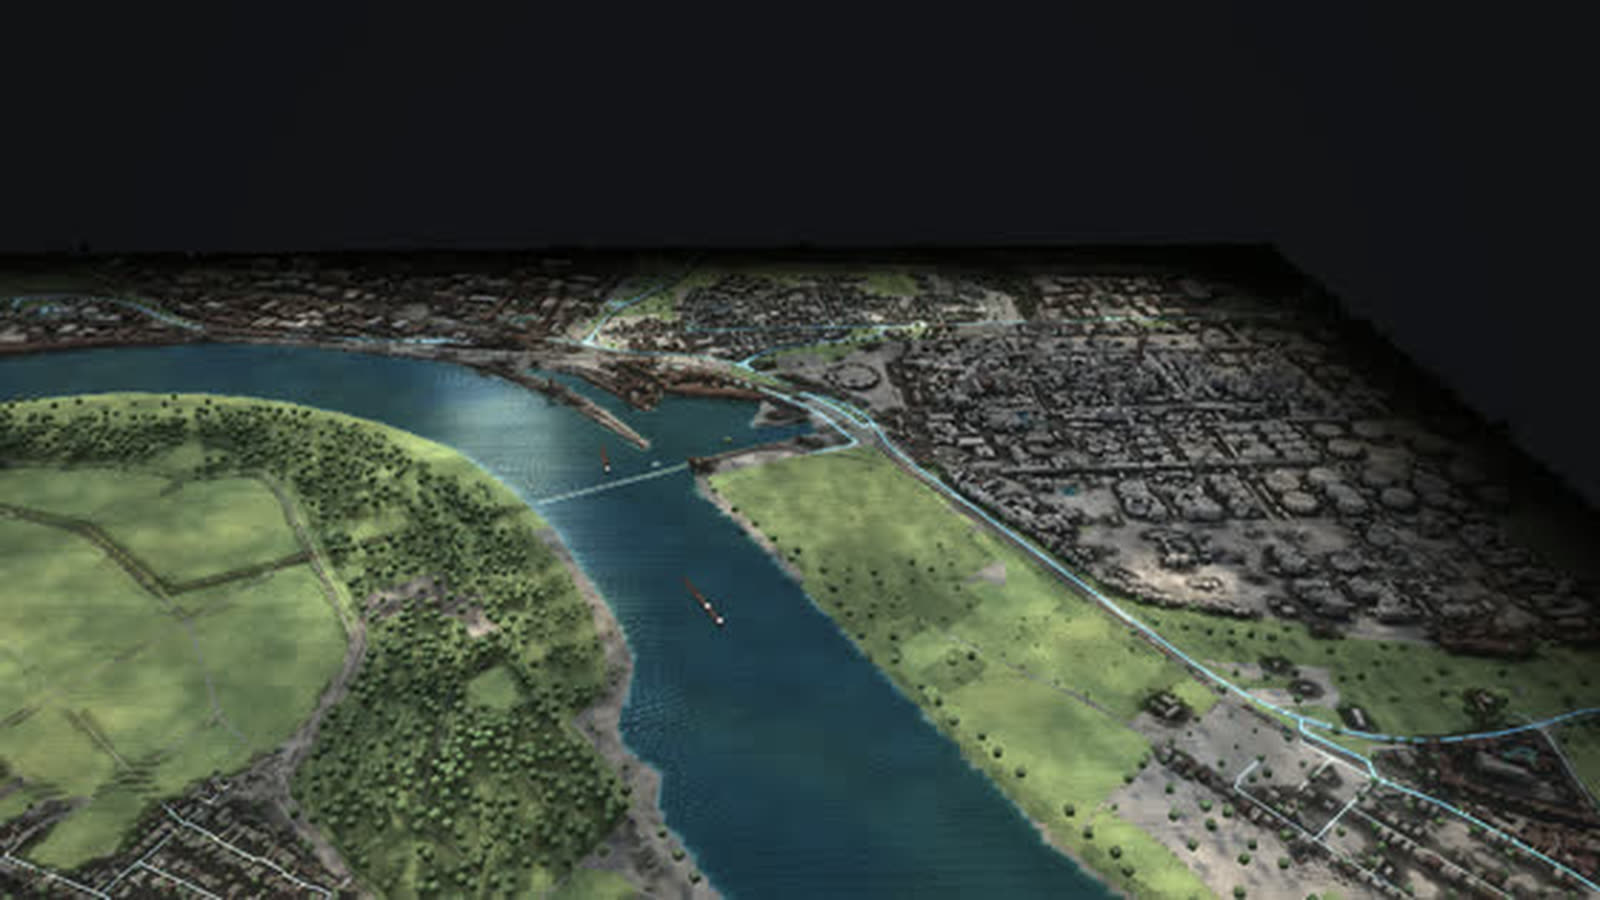
Germany’s largest refinery site as a walkable model: crude oil from Rotterdam and Wilhelmshaven, distillation column, tank farm and Rhine ships – and since 2021 hydrogen made from power.
-
Hamm-Uentrop
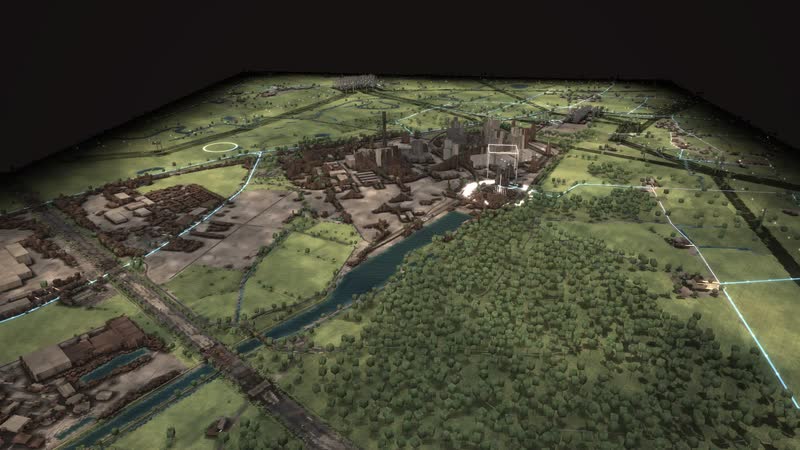
Five decades of energy on the Lippe and the canal as a walkable model: the THTR-300 thorium reactor, the Westfalen hard-coal plant, a gas plant, a large battery – and soon direct current from Wilhelmshaven.
-
Coast near Norden
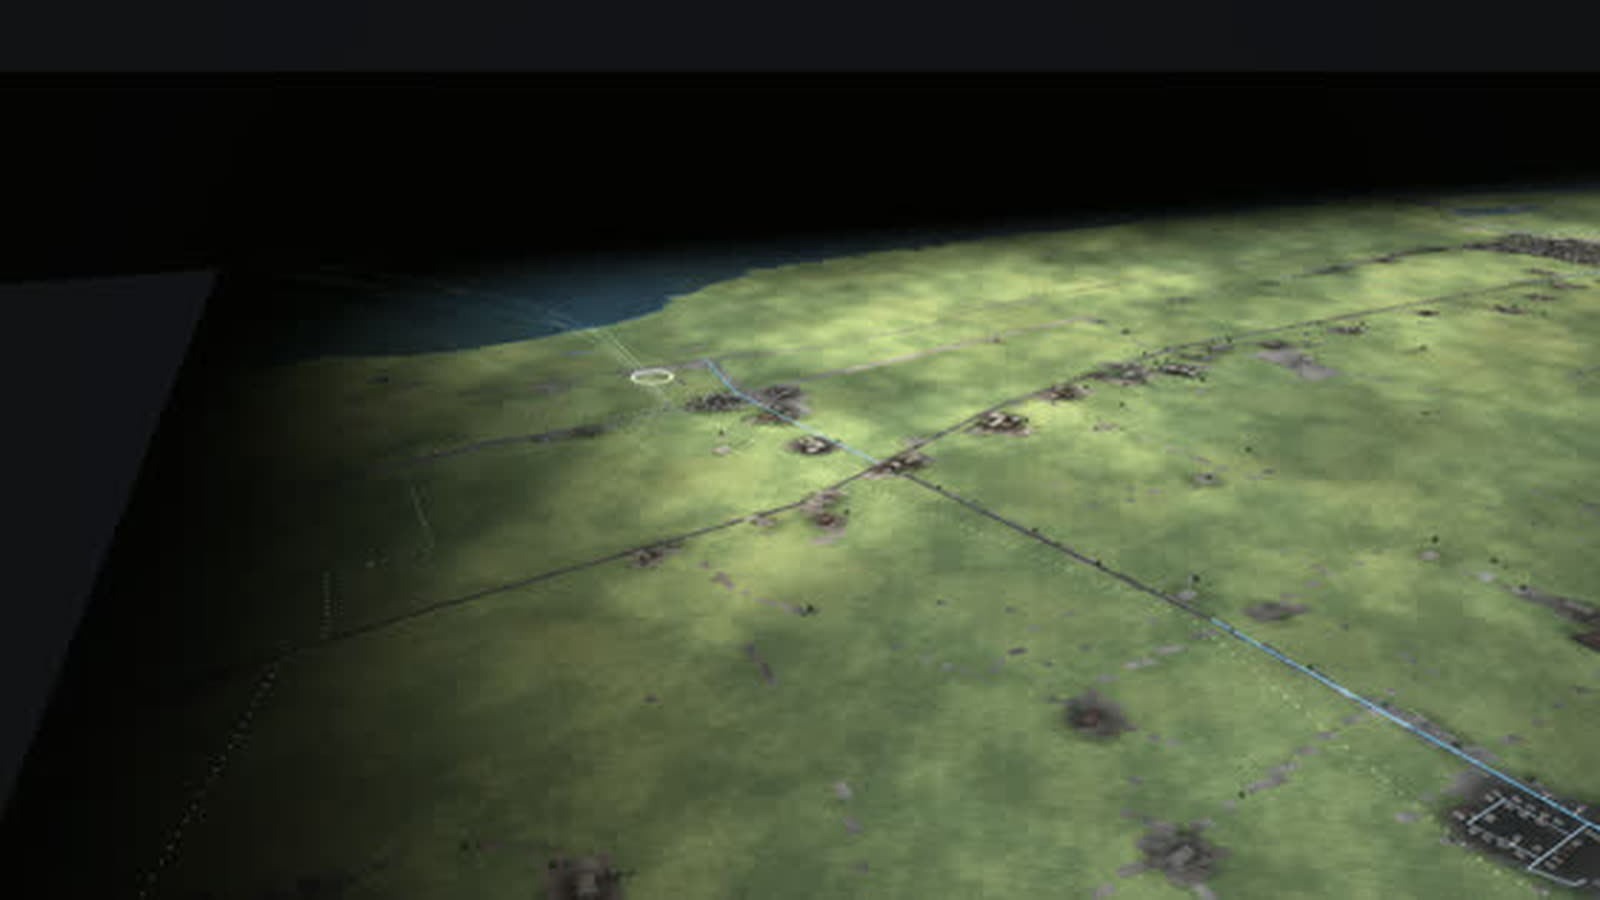
Where energy from the North Sea comes ashore, as a walkable model: six direct-current cables under the dike, natural gas from Norway since 1995 and more than 200 wind turbines behind the dike.
-
Datteln 4
Germany’s newest hard-coal plant as a walkable model: coal by ship on the Dortmund-Ems Canal, power for the grid and the railway, district heat as far as Recklinghausen.
-
North Sea off Borkum
The beginning of German offshore wind as a walkable model: twelve test turbines from 2009, a cluster of 284 turbines and about 1,660 MW, substation and converter platforms and the way ashore.
-
Germany 1975–2025
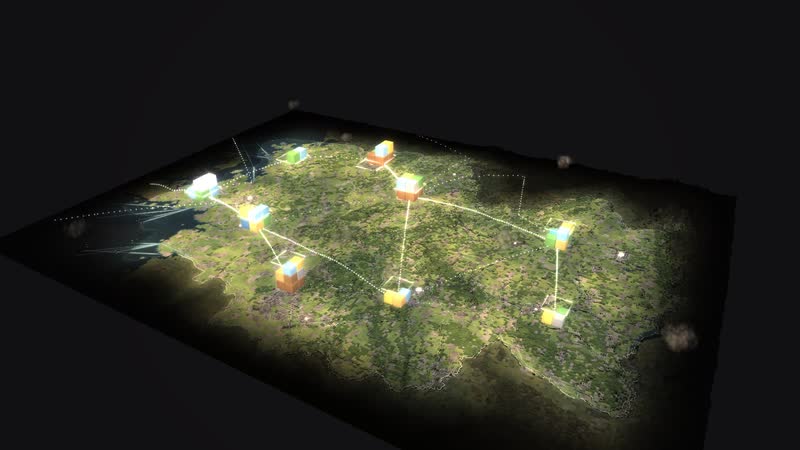
Fifty years of energy supply on one map: 365 sites, ten grid regions and the power of every hour – from two separate grids in 1975 to wind and sun in 2025.
-
Rhineland lignite district
The Rhineland lignite district as a walkable model: from the Garzweiler mine via conveyors, boilers and cooling towers into the 380 kV grid – while wind, sun and batteries grow on the reclaimed land.
-
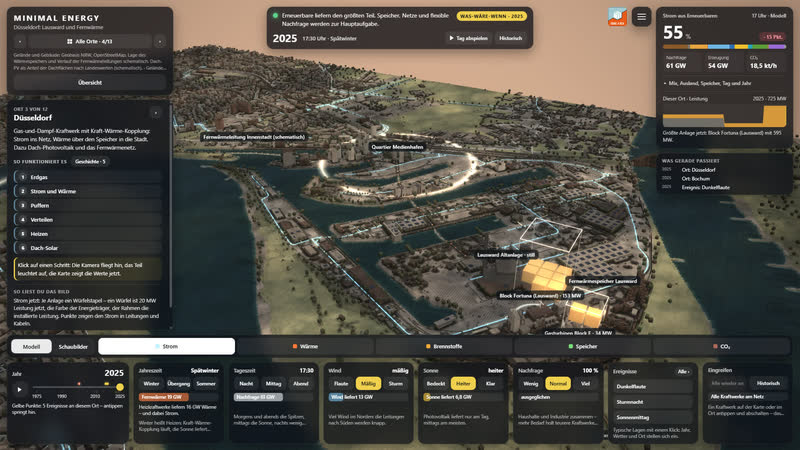
Düsseldorf Lausward
A combined-cycle gas plant on the Rhine as a walkable model: power to the grid, heat via a 58 m storage tank and the district heating line into the media harbour and the city centre.
Real are terrain and buildings (LGLN Lower Saxony, OpenStreetMap), the Jade and the mudflats by elevation, and the power plants, terminals and tank farms with their years. The berth of the second LNG terminal is derived from the connecting pipeline; coal conveyors and ship traffic are schematic. Wi…