
Simulazione · Minimal Organization · Industry
Semiconductor manufacturer
A chip fab as a walkable model: see where a wafer lot spends its weeks and why lithography sets the pace for the whole fab.
Trailer
All data for LITHENA HALBLEITER are fictional. The model can be fitted to your fab's real data and filled with information that is not visible anywhere today – for example actual lot moves from your MES or maintenance windows for each lithography tool.
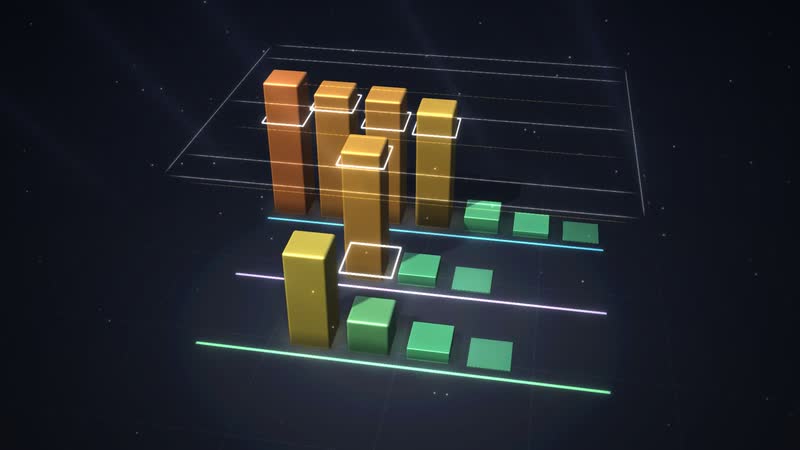
This page shows a semiconductor fab process simulation, using the fictional chipmaker LITHENA HALBLEITER. A lot of 25 wafers passes five times through the same loop of exposure, etch, deposition and polishing. The diagram ‘Where the time goes’ makes it plain: most of the time, the lot is waiting between tools.
The main process in one sentence: fab planning releases a lot, wafer test measures every chip after the fifth loop, then the wafers fly to an overseas assembler for packaging and final test before the chips ship to the customer. The model's target: in wafer test within nine weeks.
Lithography is the bottleneck. More wafer starts make the queue in front of it grow for weeks, and an extra tool is the most expensive lever in the fab. The page is written for fab managers, production control and capital planning, and for anyone who has to explain how a fab works to new hires, customers or policymakers.
A lot of wafers runs through the fab
- 01
Release lot (25 wafers): Fab planning releases a lot of 25 wafers.
- 02
Exposure: Layers 1–12: transistors: exposure.
- 03
Etch and clean: Layers 1–12: transistors: etch and clean.
- 04
Deposit and implant: Layers 1–12: transistors: deposit and implant.
- 05
Polish and measure: Layers 1–12: transistors: polish and measure.
- 06
Waiting and transport between tools: The lot waits in wafer boxes for the next tools.
- 07
Again: Exposure: Layers 13–24: contacts: exposure.
- 08
Again: Etch and clean: Layers 13–24: contacts: etch and clean.
- 09
Again: Deposit and implant: Layers 13–24: contacts: deposit and implant.
- 10
Again: Polish and measure: Layers 13–24: contacts: polish and measure.
- 11
Again: Waiting and transport between tools: The lot waits in wafer boxes for the next tools.
- 12
Again: Exposure: Layers 25–36: lower metal: exposure.
- 13
Again: Etch and clean: Layers 25–36: lower metal: etch and clean.
- 14
Again: Deposit and implant: Layers 25–36: lower metal: deposit and implant.
- 15
Again: Polish and measure: Layers 25–36: lower metal: polish and measure.
- 16
Again: Waiting and transport between tools: The lot waits in wafer boxes for the next tools.
- 17
Again: Exposure: Layers 37–48: upper metal: exposure.
- 18
Again: Etch and clean: Layers 37–48: upper metal: etch and clean.
- 19
Again: Deposit and implant: Layers 37–48: upper metal: deposit and implant.
- 20
Again: Polish and measure: Layers 37–48: upper metal: polish and measure.
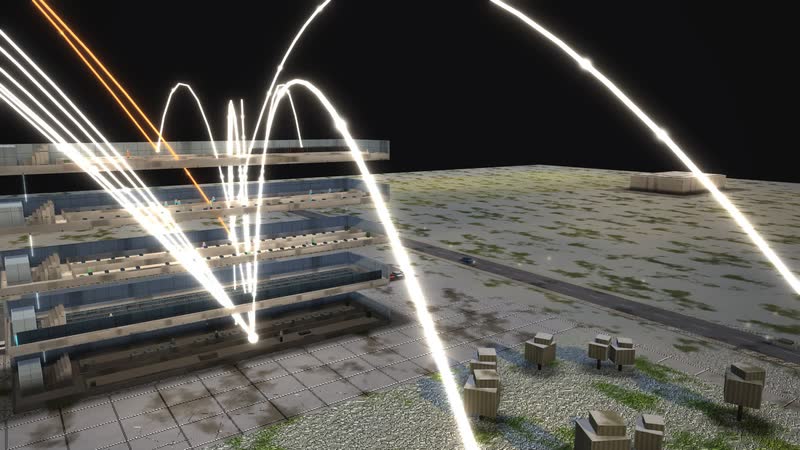
01
A site at work
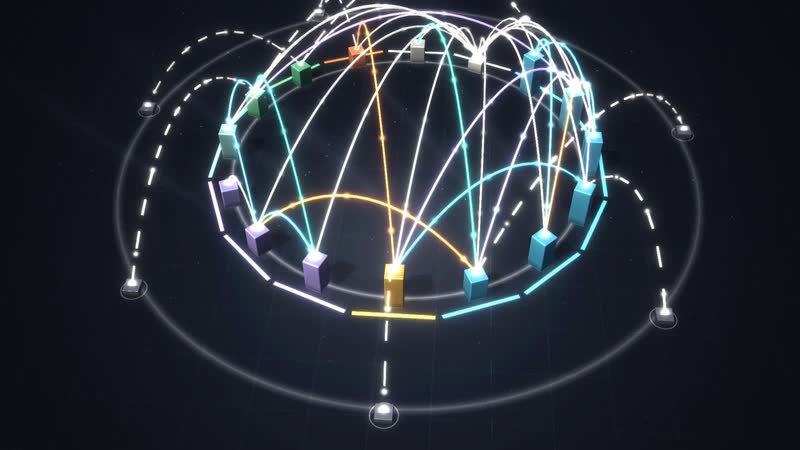
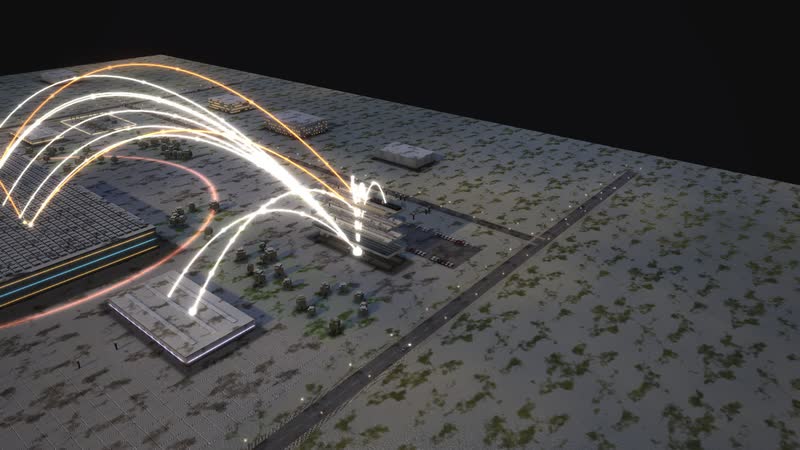
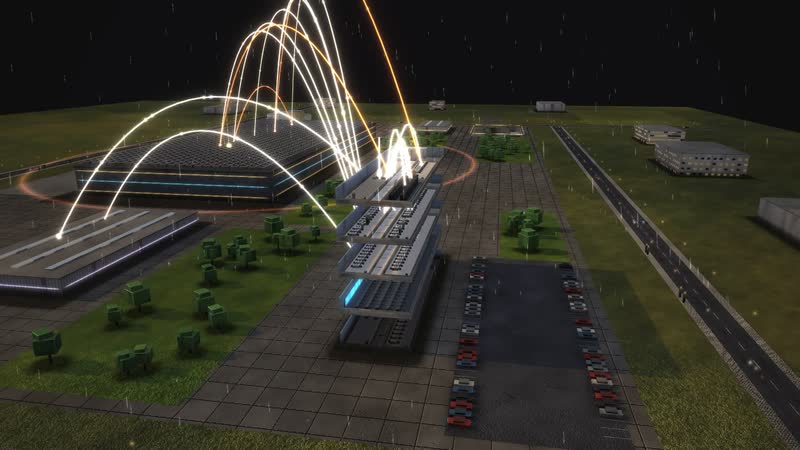
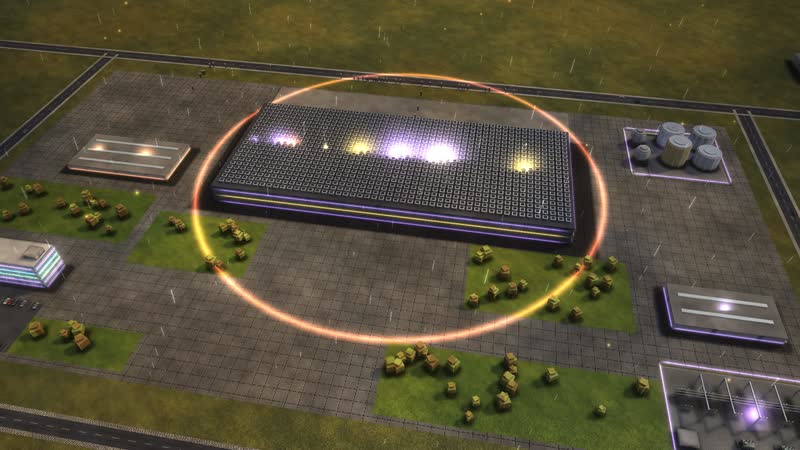
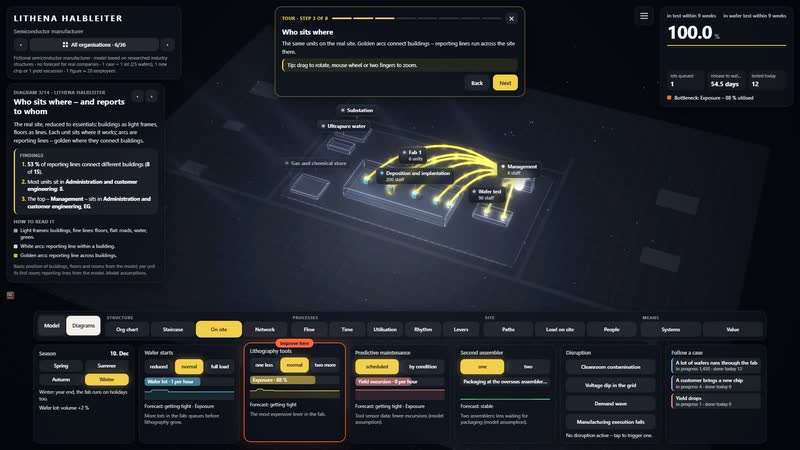
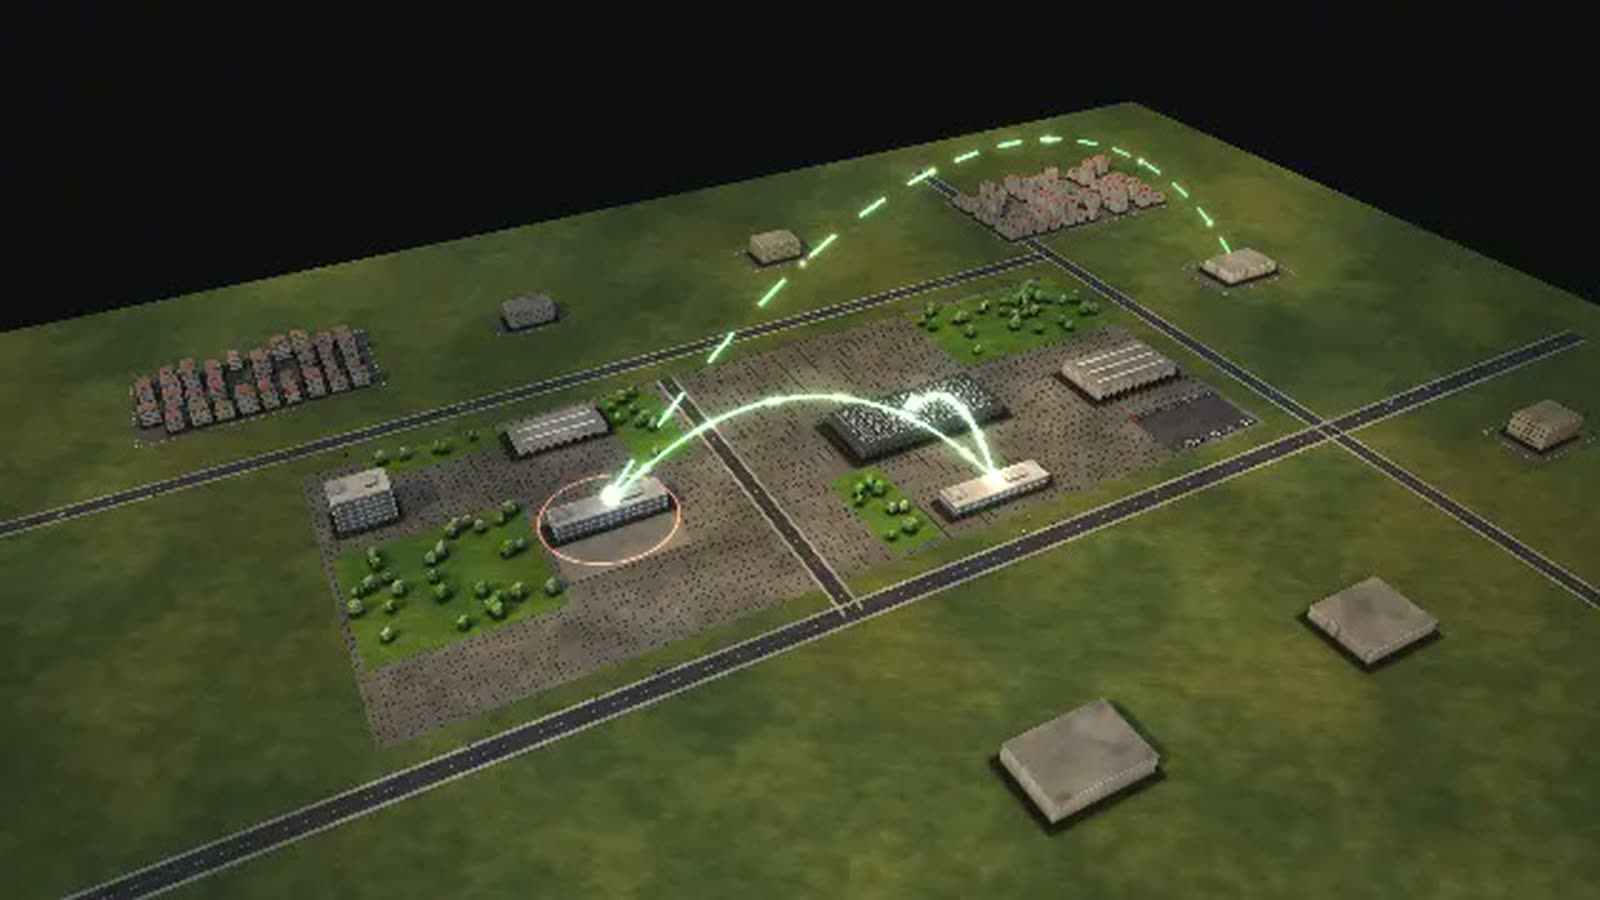
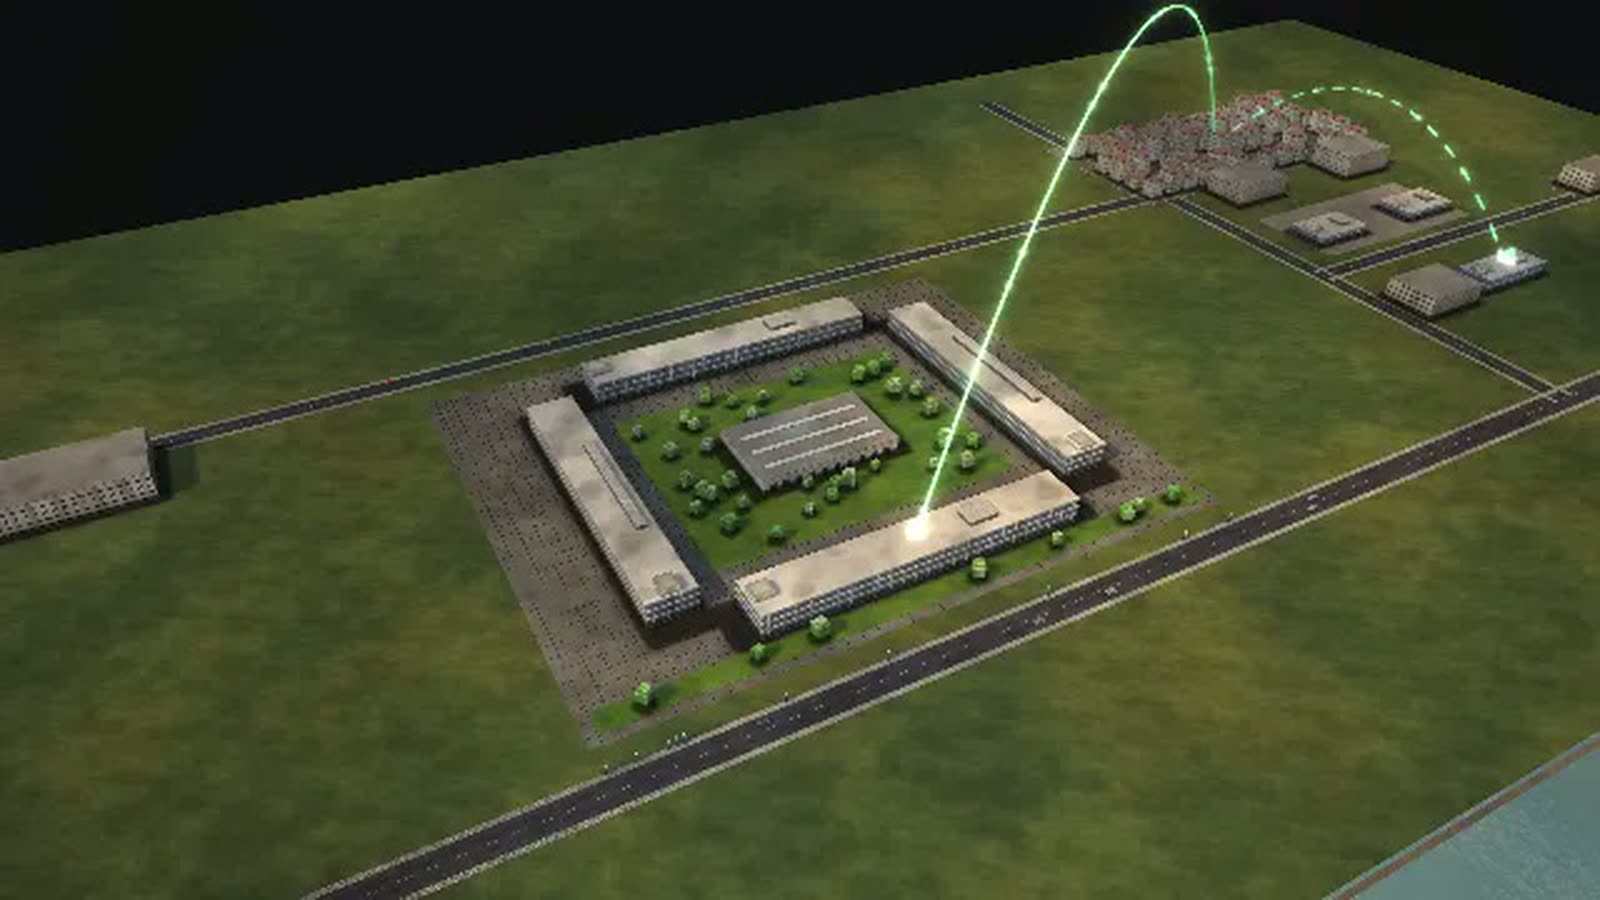
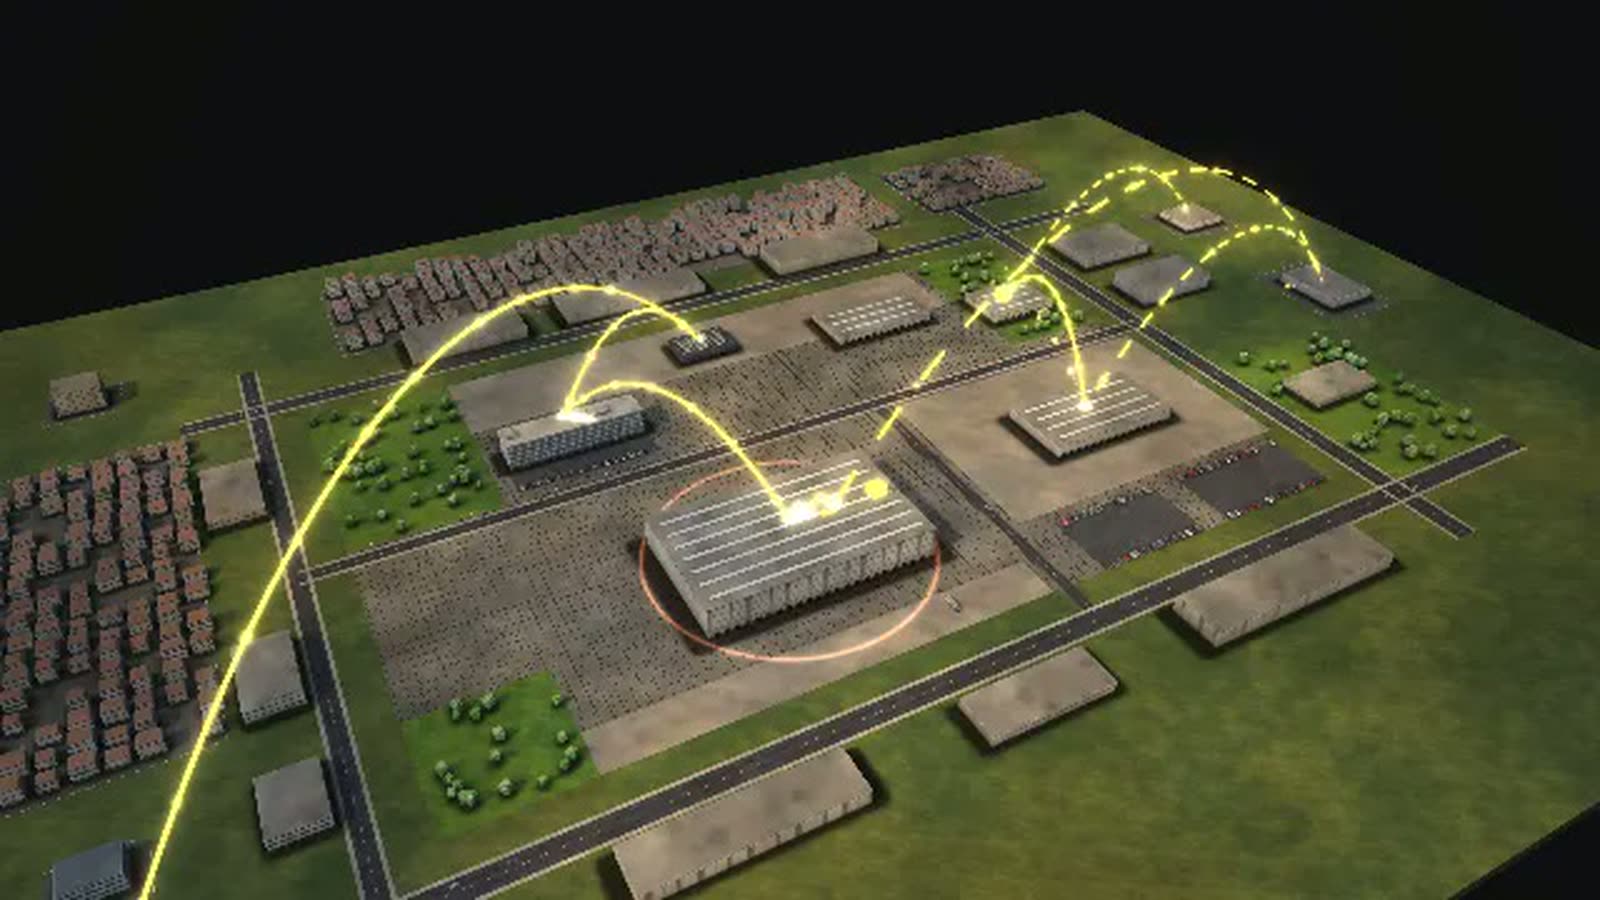
6 buildings, 16 departments, about 1,300 staff: in the evening light golden arcs show who reports to whom.
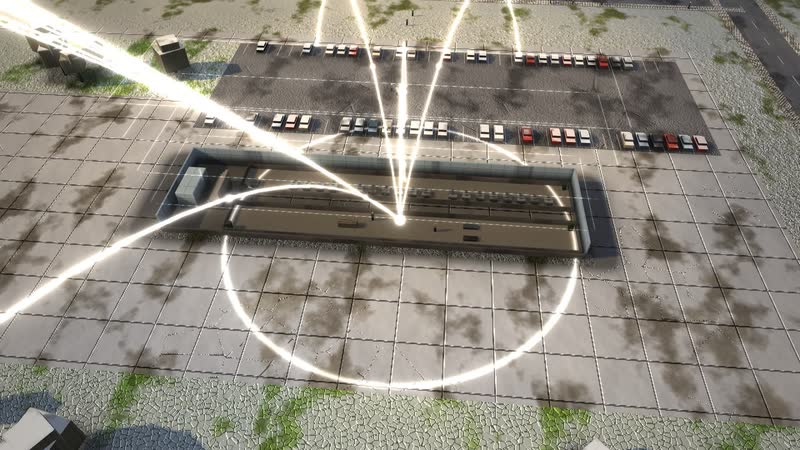
02
Every floor opened up
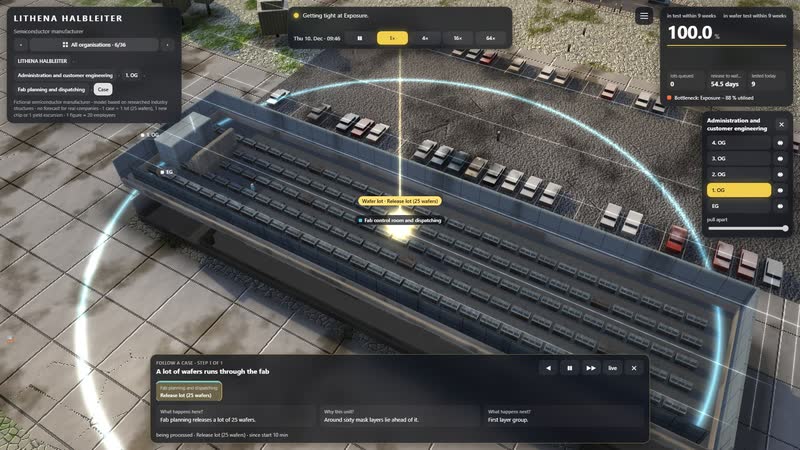
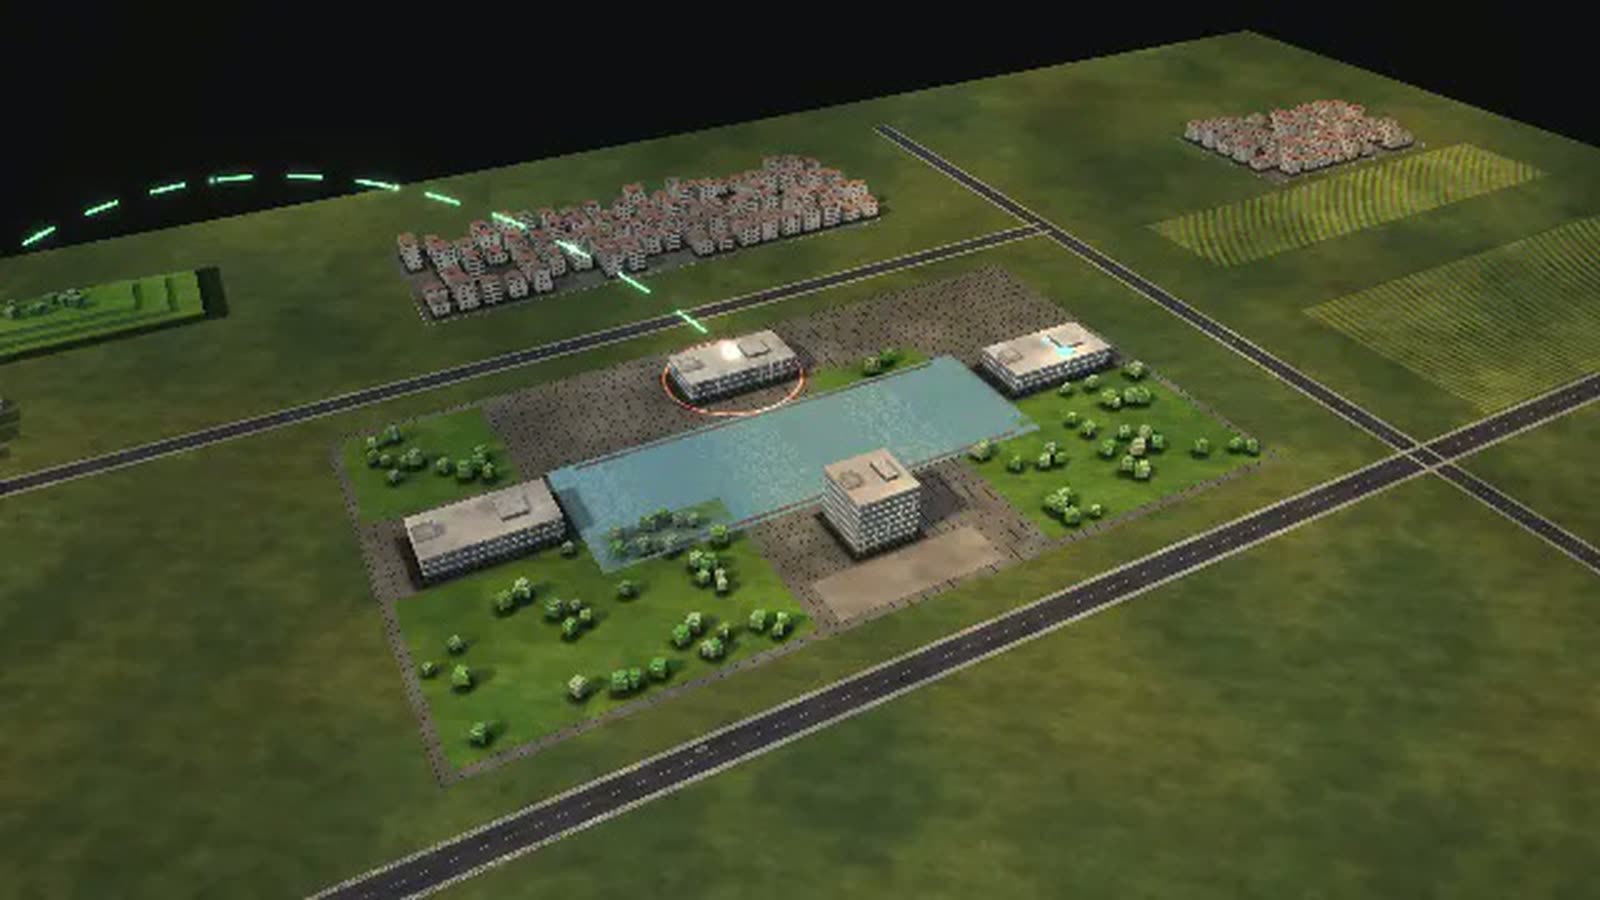
Every building can be opened, floor by floor – right into single rooms such as ‘Management’, with workplaces and people at work.
What is shown – why – for whom
| Cosa viene mostrato | Perché | Per chi |
|---|---|---|
| Diagram ‘Where the time goes’ for one lot | Perchéshows that a wafer spends most of its time waiting | Per chiProduction control, fab management |
| Queue in front of lithography in the resources view | Perchéshows the fab's most expensive bottleneck | Per chiFab management, capital planning |
| Diagram ‘What each control does’: wafer starts, lithography, maintenance, second assembler | Perchéranks the levers by their effect on cycle time | Per chiExecutive team, controlling |
| Diagram ‘What the work depends on’: ultrapure water, gases, substation | Perchéshows how the fab depends on its utilities | Per chiFacility management, risk management |
| Five passes through the same loop in the processes view | Perchéexplains why a lot keeps returning to the same tools | Per chiOnboarding, customers |
| Disruption ‘Voltage dip in the grid’ | Perchéshows twelve hours of restart after a brief dip | Per chiEnergy supply, site policy |
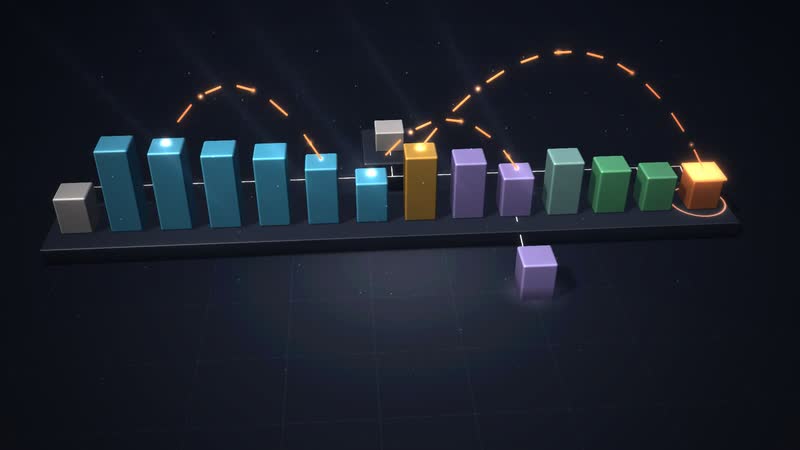
| Diagram ‘How a case flows’ to the overseas assembler | Perchémakes the path across continents visible | Per chiCustomers, supply chain |
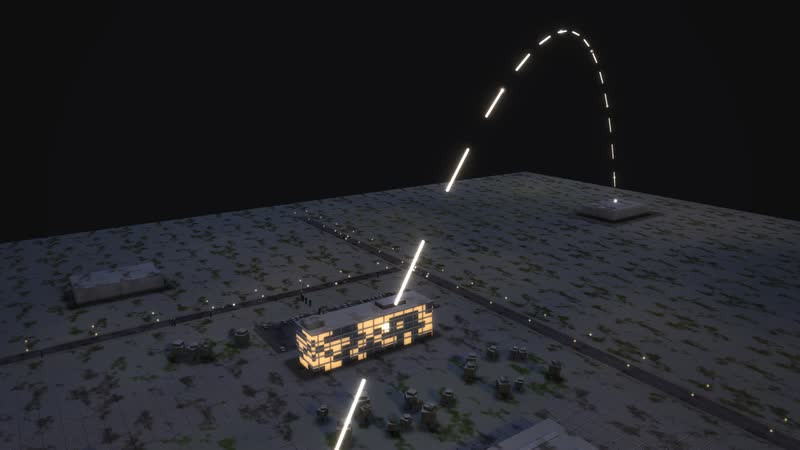
03
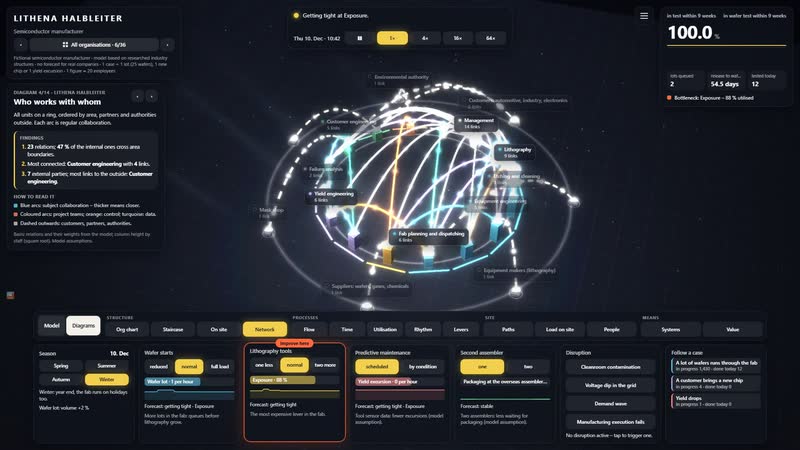
Who works with whom
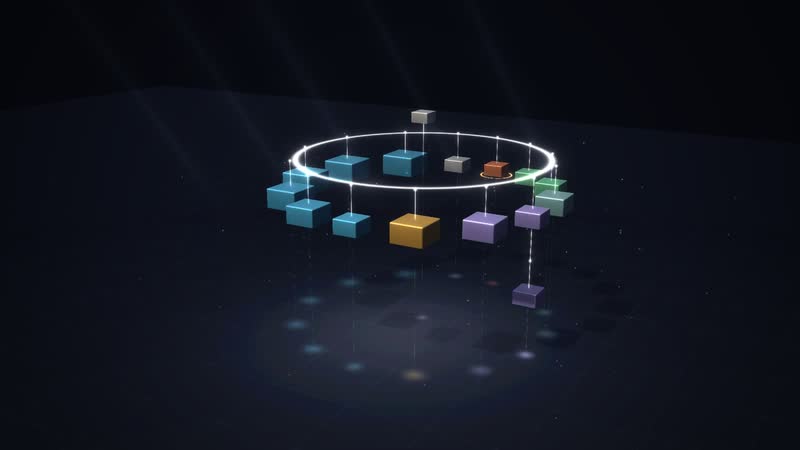
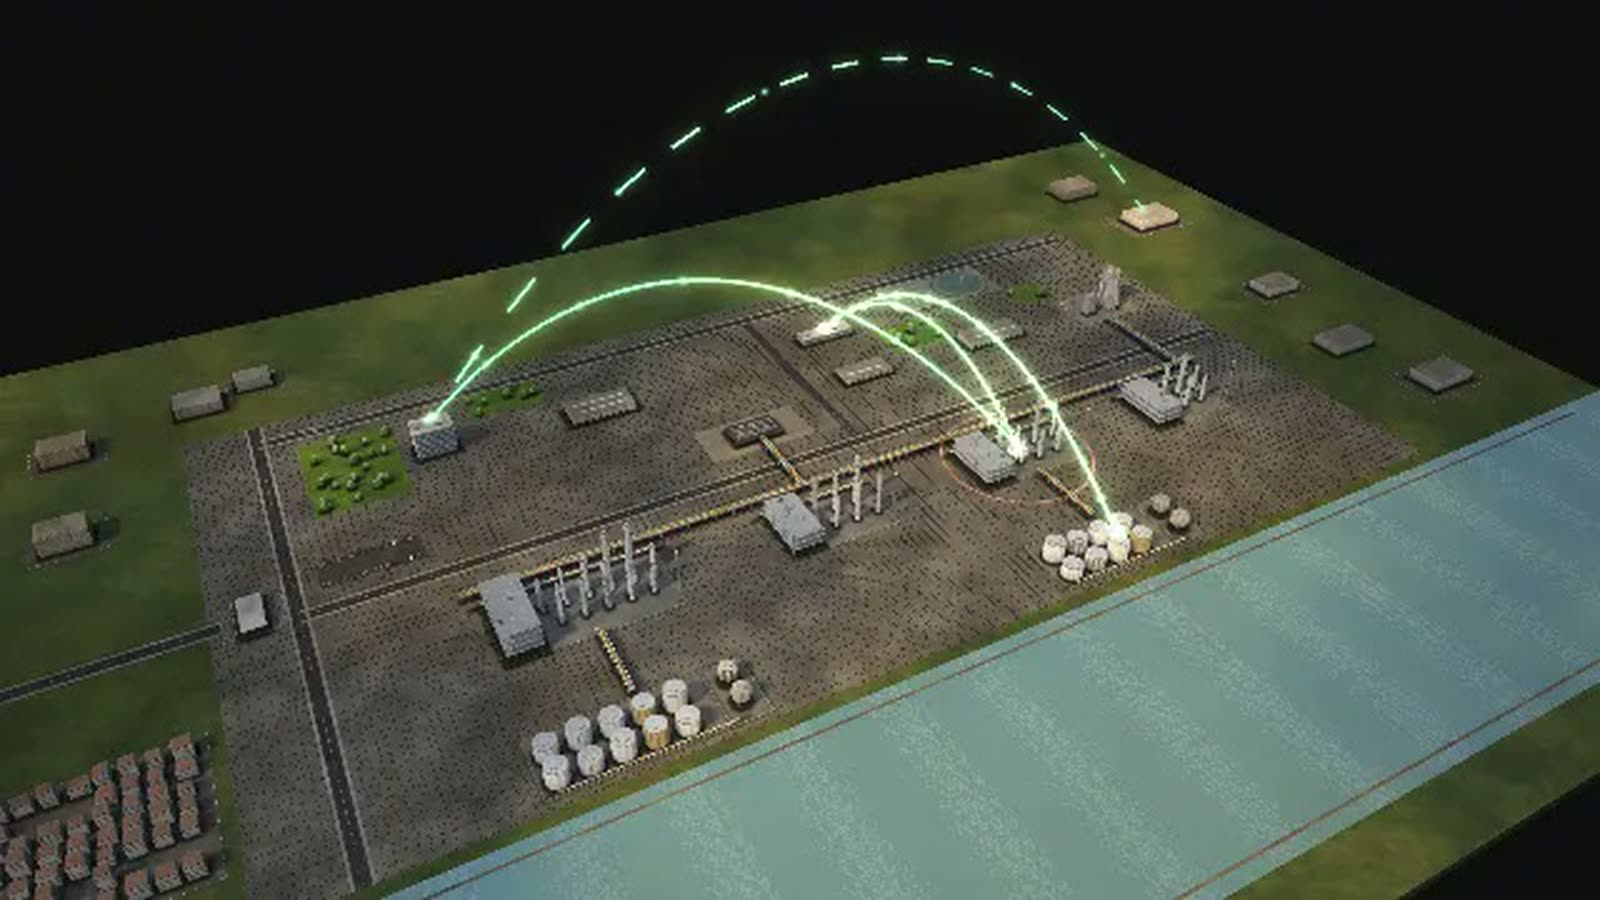
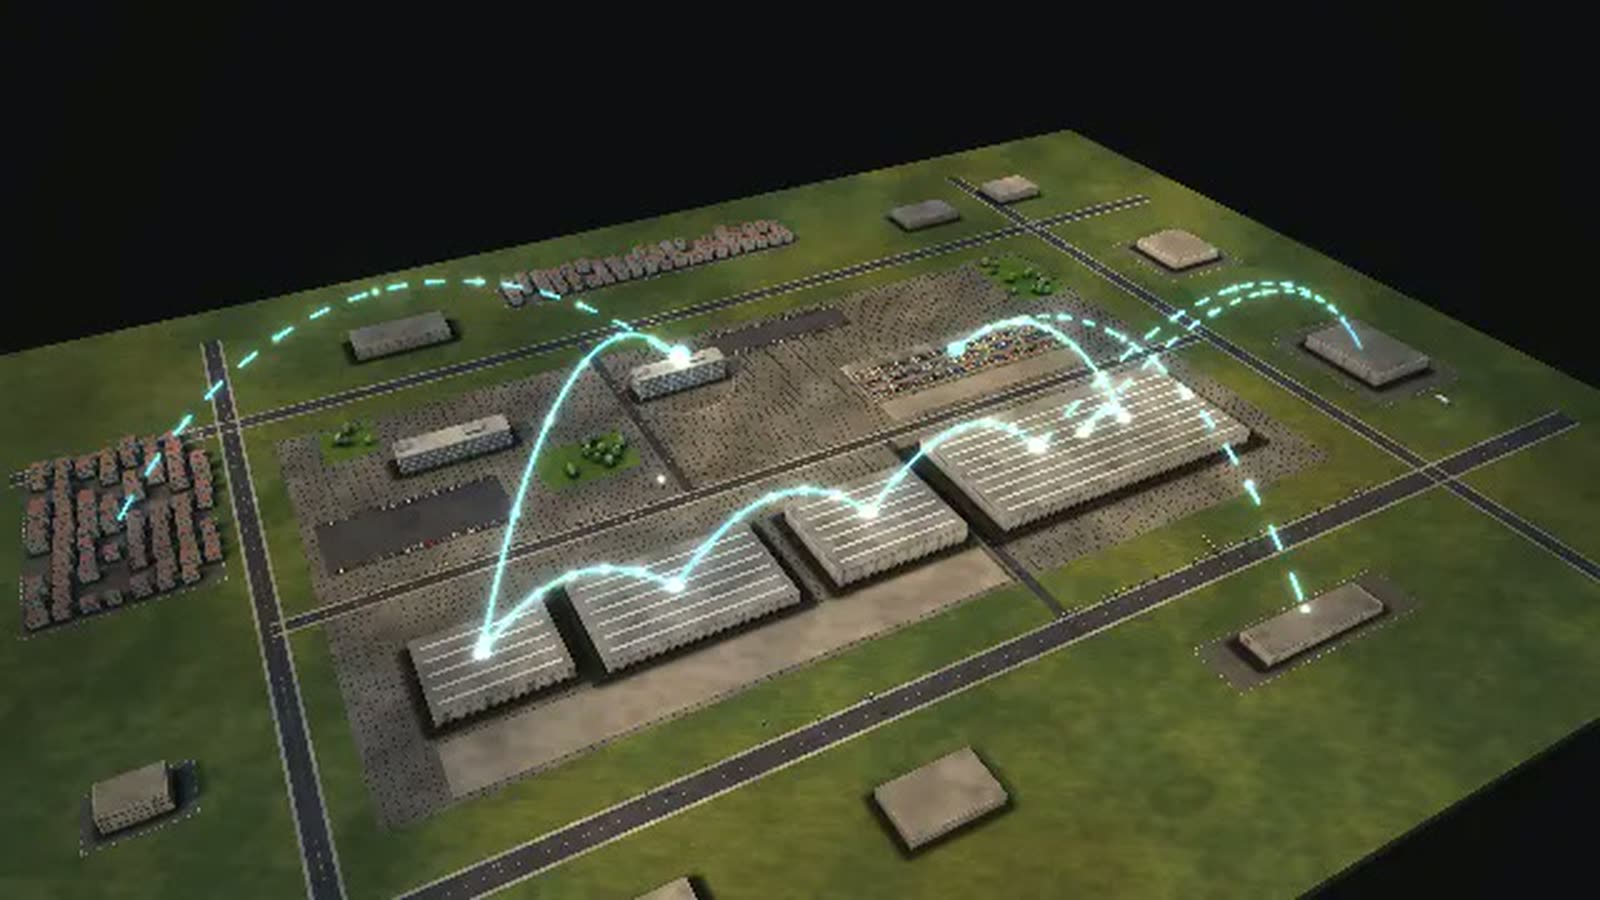
‘Fab planning and dispatching’ with all 4 relations: Lithography, Yield engineering and Manufacturing execution (MES) – and outside Assembly and test (overseas).
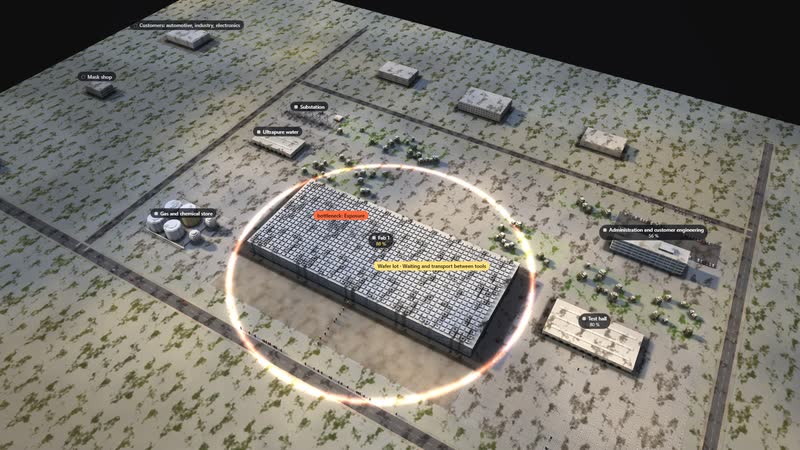
04
A lot of wafers runs through the fab
A single case can be followed – step by step, with the waiting time at every station. Target: in wafer test within 9 weeks.
Films from the model
-
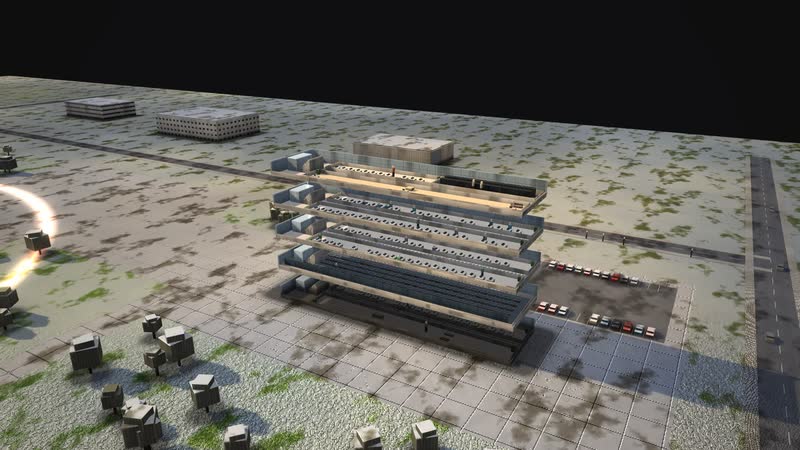
The building opens up
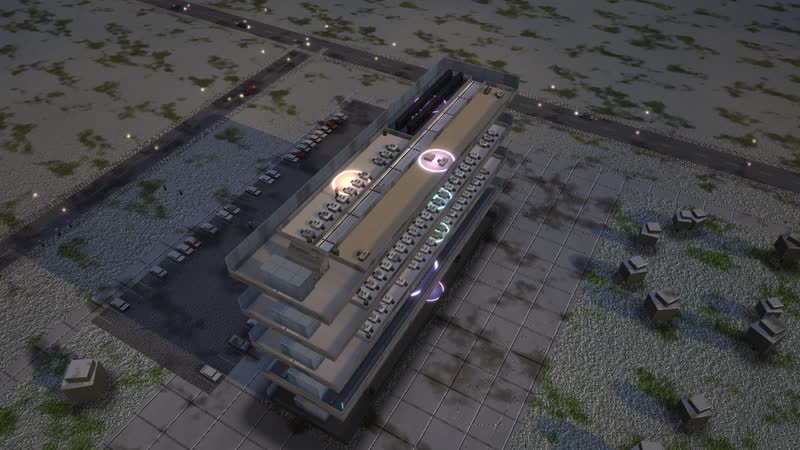
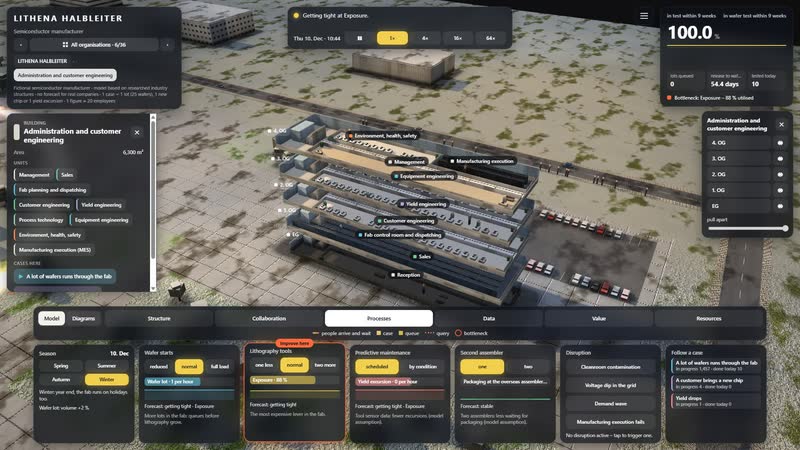
Just before sunset the floors drift apart – ‘Administration and customer engineering’ opens up as the camera rises and circles the building until night falls.
-
Who reports to whom, who works with whom
Blue hour above the site: first the golden arcs of the structure, then the collaboration of the most connected department, finally the whole building.
-
A day in time-lapse
From ten in the morning to midnight in 26 seconds: the sun moves, the windows light up, at night the data lines glow.
-
Surge and system outage
In time-lapse: ‘Demand wave’ brings more work, then ‘Manufacturing execution fails’ – the data arcs turn red. The control ‘Lithography tools’ set to ‘two more’ brings recovery.
-
Seven diagrams
Calculated live from the model: ‘Who works with whom’, ‘Year, week, day’, ‘Management levels as a staircase’, ‘How a case flows’, ‘What each control does’, ‘What the work depends on’, ‘Where it gets tight’.
-
Using the software
With the full interface: open a building, a department’s relations, ‘Demand wave’, a control, diagrams with their panel, one case.
Departments in the model
-
Management
Leads the fab and customer service.
-
Fab planning and dispatching
Releases lots and sets the sequence at the tools.
-
Lithography
Exposes every layer – the most expensive tools in the fab.
-
Etching and cleaning
Transfers the pattern into the layer.
-
Deposition and implantation
Deposits layers and dopes.
-
CMP and metrology
Polishes, measures, decides: continue or rework.
-
Equipment engineering
Keeps the tools running.
-
Utilities (ultrapure water, gases, power)
Without utilities the cleanroom stops.
-
Wafer test
Measures every chip on the wafer.
-
Yield engineering
Every point of yield is profit.
-
Failure analysis
Hunts defects under the microscope.
-
Process technology
Develops the layer recipes.
-
Customer engineering
Brings customer designs into the fab.
-
Sales
Sells capacity, commits dates.
-
Environment, health, safety
Gases, chemicals, wastewater.
-
Manufacturing execution (MES)
Knows every lot and every step.
05
Manufacturing execution fails
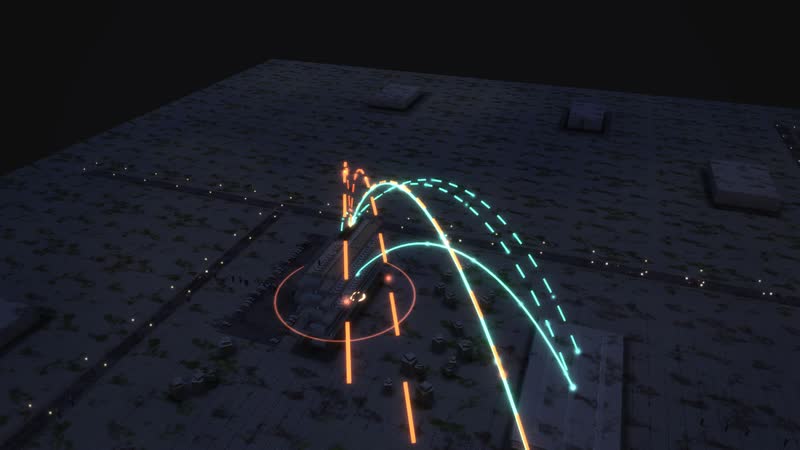
The data arcs turn red and work stalls – the simulation shows where cases pile up and how long recovery takes.
06
A day in 26 seconds
From ten in the morning to midnight in time-lapse: commuters, moving light, windows switching on – and at night the data lines.
All processes in the model
A lot of wafers runs through the fab
- 01Release lot (25 wafers): Fab planning releases a lot of 25 wafers.
- 02Exposure: Layers 1–12: transistors: exposure.
- 03Etch and clean: Layers 1–12: transistors: etch and clean.
- 04Deposit and implant: Layers 1–12: transistors: deposit and implant.
- 05Polish and measure: Layers 1–12: transistors: polish and measure.
- 06Waiting and transport between tools: The lot waits in wafer boxes for the next tools.
- 07Again: Exposure: Layers 13–24: contacts: exposure.
- 08Again: Etch and clean: Layers 13–24: contacts: etch and clean.
- 09Again: Deposit and implant: Layers 13–24: contacts: deposit and implant.
- 10Again: Polish and measure: Layers 13–24: contacts: polish and measure.
- 11Again: Waiting and transport between tools: The lot waits in wafer boxes for the next tools.
- 12Again: Exposure: Layers 25–36: lower metal: exposure.
- 13Again: Etch and clean: Layers 25–36: lower metal: etch and clean.
- 14Again: Deposit and implant: Layers 25–36: lower metal: deposit and implant.
- 15Again: Polish and measure: Layers 25–36: lower metal: polish and measure.
- 16Again: Waiting and transport between tools: The lot waits in wafer boxes for the next tools.
- 17Again: Exposure: Layers 37–48: upper metal: exposure.
- 18Again: Etch and clean: Layers 37–48: upper metal: etch and clean.
- 19Again: Deposit and implant: Layers 37–48: upper metal: deposit and implant.
- 20Again: Polish and measure: Layers 37–48: upper metal: polish and measure.
A customer brings a new chip
- 01Take over and check the design: Customer engineering takes over the finished design and checks it against the fab rules.
- 02Make photomasks: A photomask is made for every layer.
- 03First wafers as hot lot: The first wafers run through the fab as a hot lot.
- 04Customer checks the first chips: The customer brings up the first chips.
- 05Release to volume: Release to volume.
- 06In volume.
Yield drops
- 01Yield drops in test: In wafer test suddenly more chips fail.
- 02Failure analysis: defect map: Failure analysis overlays a defect map: it points to an etch tool.
- 03Hold the tool, stop lots: The tool is put on hold, affected lots are stopped.
- 04Fix the cause: Equipment engineering looks for the cause.
- 05Equipment maker service: The maker's service arrives.
- 06Release the tool again: Test wafers run, the tool is released.
- 07Inform customers: Customer engineering informs affected customers.
- 08Fixed.
How a semiconductor manufacturer can use the model
-
Internal communication
The whole fab in one picture: lithography, etch, deposition, metrology, wafer test and utilities across six buildings. The collaboration view draws arcs between the departments that work together, from the cleanroom to customer engineering.
Per chiManagement, communications, all departments
-
Onboarding
New hires follow a lot through all five loops to wafer test and see where their tool sits in the chain. An eight-step guided tour explains the controls on the first visit.
Per chiNew staff in the fab, equipment engineering and customer engineering
-
Training
Apprentices and students push wafer starts to full load, trigger cleanroom contamination and watch the queue in front of lithography grow – without touching a real tool.
Per chiApprentices, work-study students, process and equipment technicians
-
Explaining to customers
Customers see the path of their lot: release, five loops, wafer test, overseas packaging, final test. It shows why a chip takes weeks and what a second assembler would change.
Per chiAutomotive, industrial and electronics customers, sales, customer engineering
-
Strategic overview
‘What each control does’ ranks wafer starts, lithography tools, predictive maintenance and a second assembler by their effect on cycle time. A voltage dip shows how much the fab depends on the grid.
Per chiExecutive team, controlling, capital planning, risk management
07
Diagrams from the model
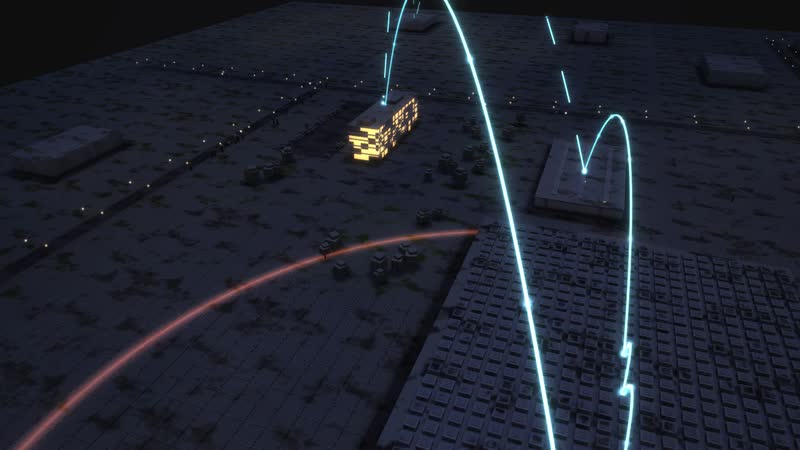
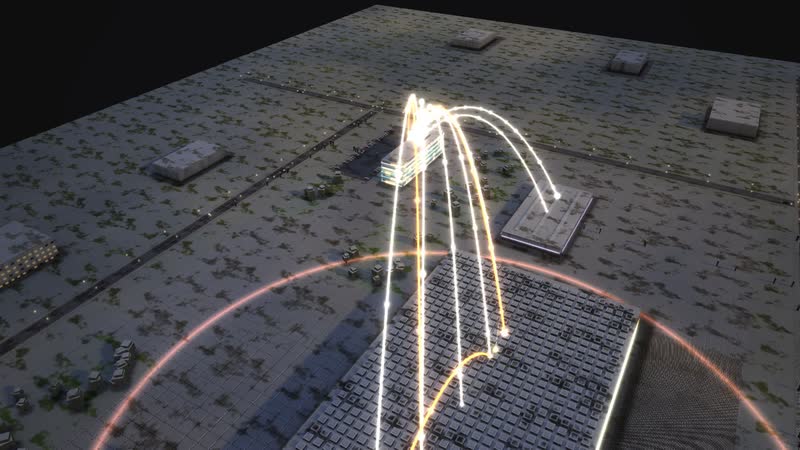
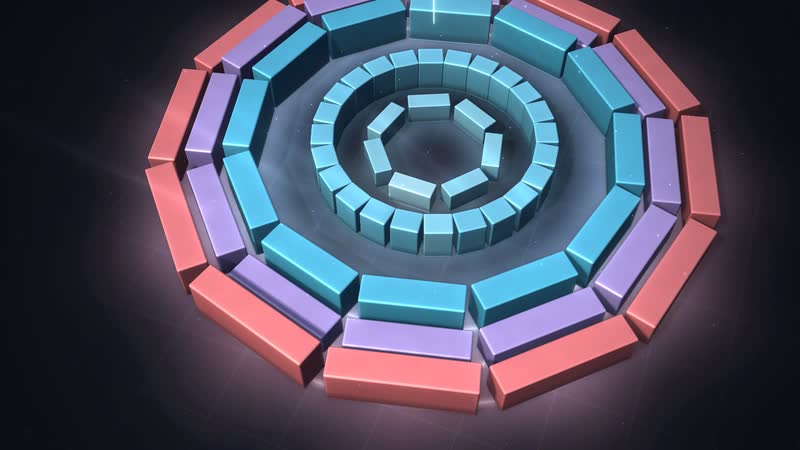
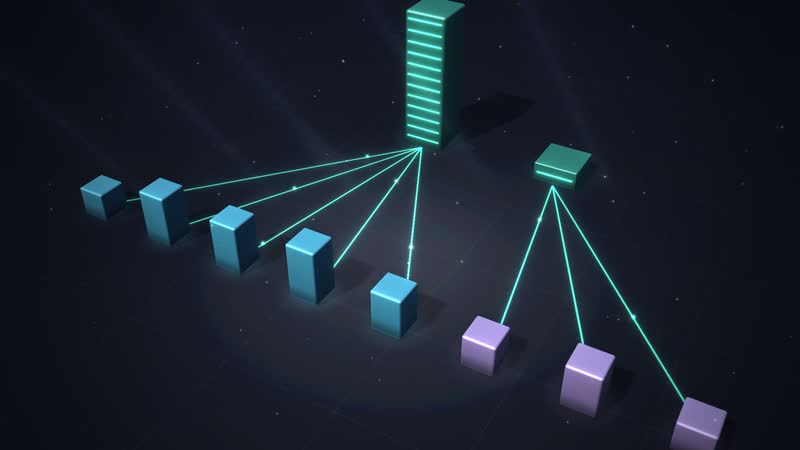
‘Who works with whom’ as a dome of arcs – one of 14 diagrams calculated live from the same data.
08
The whole software
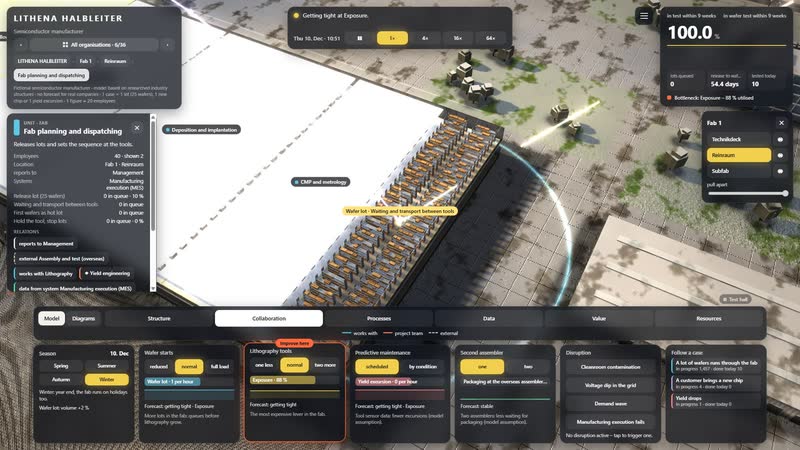
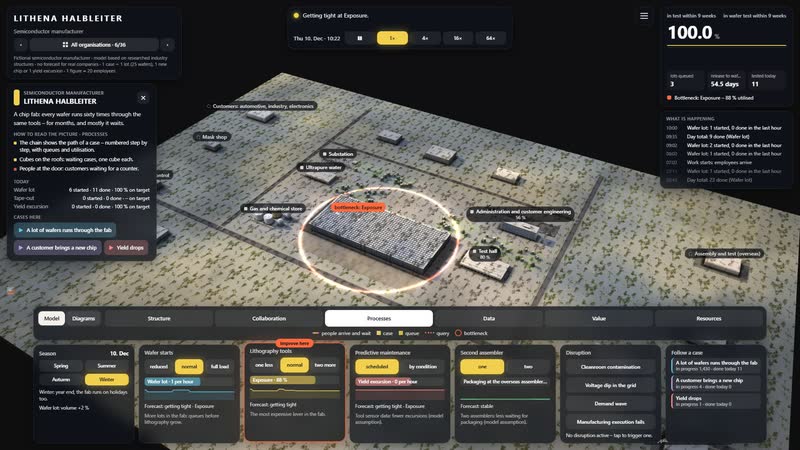
Situation, key figure, time-lapse, six views, controls and disruptions: one click on a department shows its task, location and all relations.
What you can change
Controls
- Wafer starts: More lots in the fab: queues before lithography grow.
- Lithography tools: The most expensive lever in the fab.
- Predictive maintenance: Tool sensor data: fewer excursions (model assumption).
- Second assembler: Two assemblers: less waiting for packaging (model assumption).
Disruptions
- Cleanroom contamination: For two days only half the tools work until cleaned.
- Voltage dip in the grid: For twelve hours the tools restart after a voltage dip.
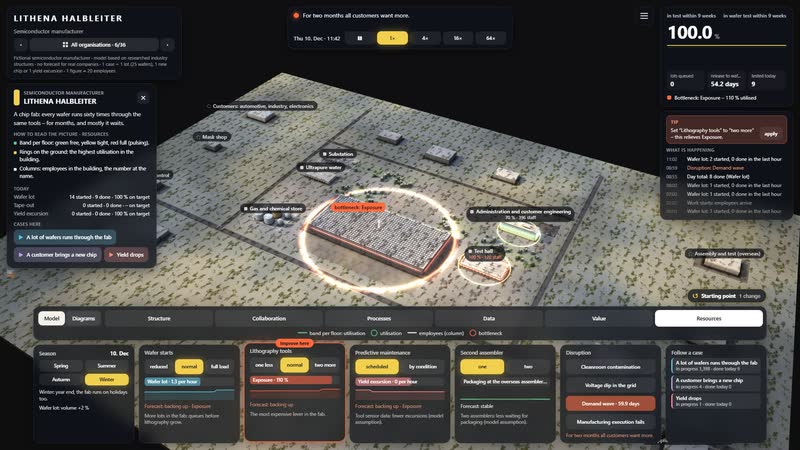
- Demand wave: For two months all customers want more.
- Manufacturing execution fails: For two hours no lot can be released or held.
What the model gives a chipmaker
-
01
Waiting made visible
In a fab, cycle time is mostly waiting time. The model calculates it live and shows it as the largest block in the diagram – clearer than any spreadsheet.
-
02
A bottleneck you can test
Raise wafer starts and the queue in front of lithography grows; add a tool and see what changes. The simulation keeps running while you move the controls.
-
03
The fab and its utilities
Ultrapure water, gas and chemical storage and the substation are buildings of their own. A grid disruption shows how long the tools take to come back.
-
04
Fourteen diagrams, one model
Cycle time, utilisation, supply chain and org chart are calculated live from the same simulation, in four groups. Nobody has to update a slide by hand.
-
05
Browser or big screen
The model runs in the browser and on large projections, for customer visits or a staff meeting. A demo mode plays everything on its own.
-
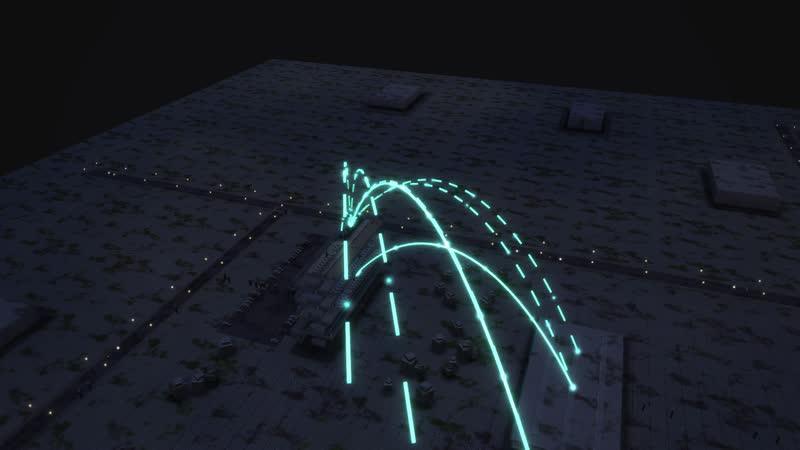
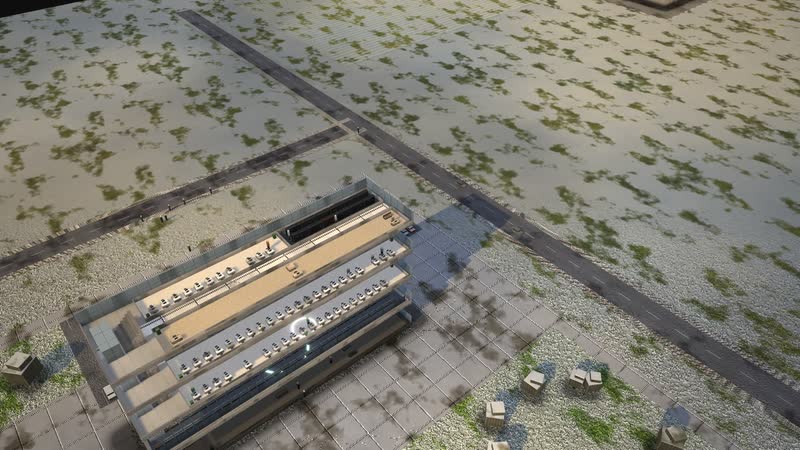
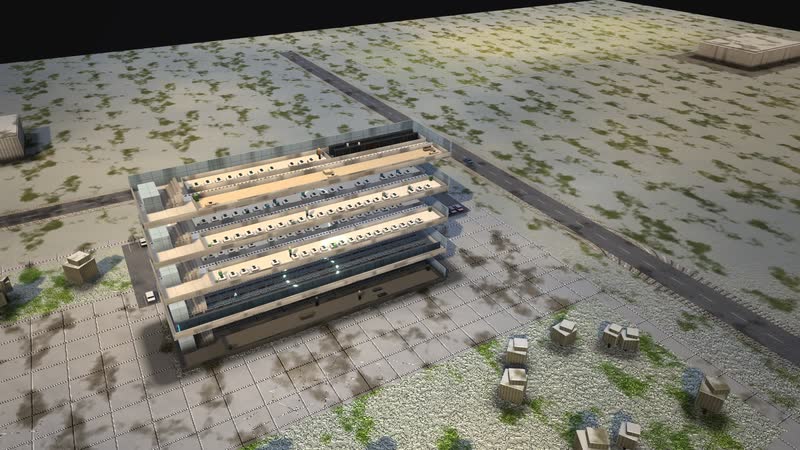
LITHENA HALBLEITER in the morning – low sun, long shadows, the first commuters on their way in. -
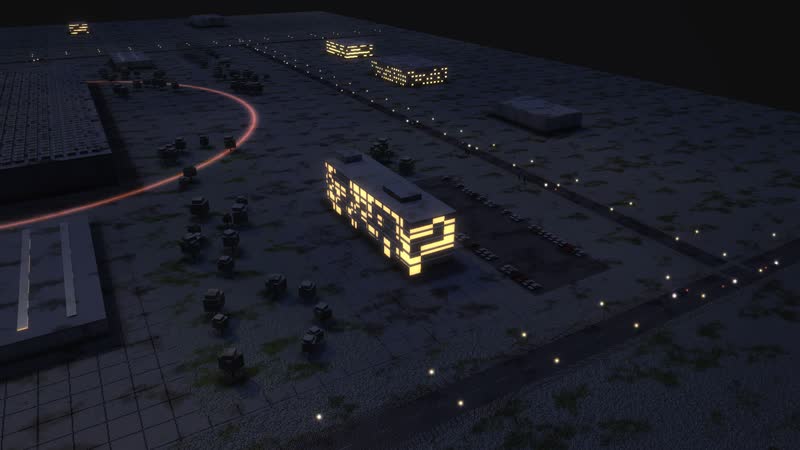
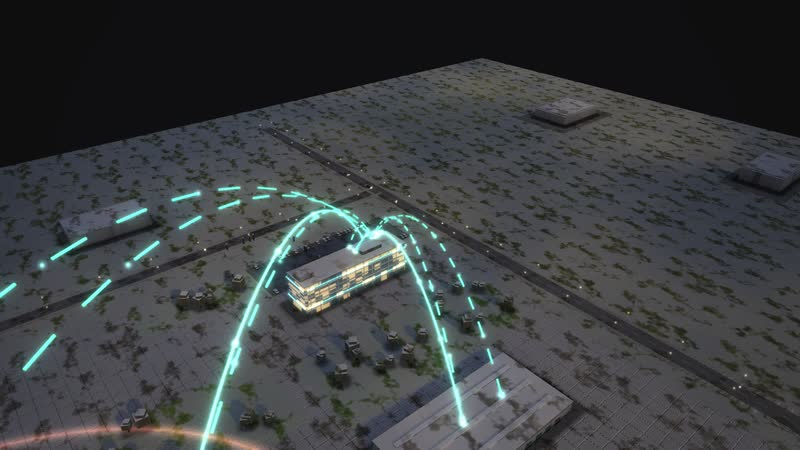
Administration and customer engineering in evening light – golden arcs show who reports to whom. -
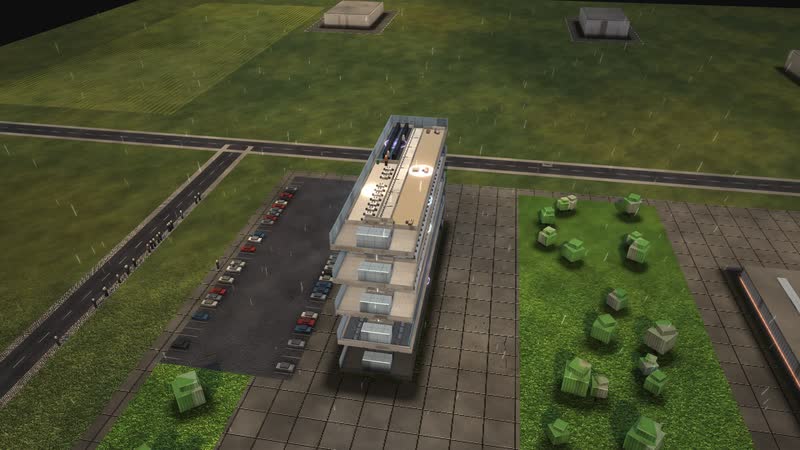
Just before eight – people stream from the car park and the street into the buildings. -
Blue hour – the windows of LITHENA HALBLEITER light up. -
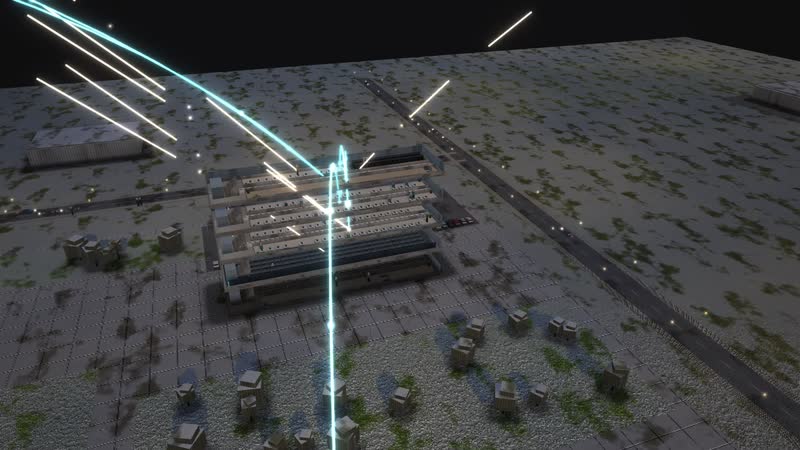
At night from above – Administration and customer engineering opened up, data lines glowing across the site. -
Administration and customer engineering opened up – every floor with workplaces and people. -
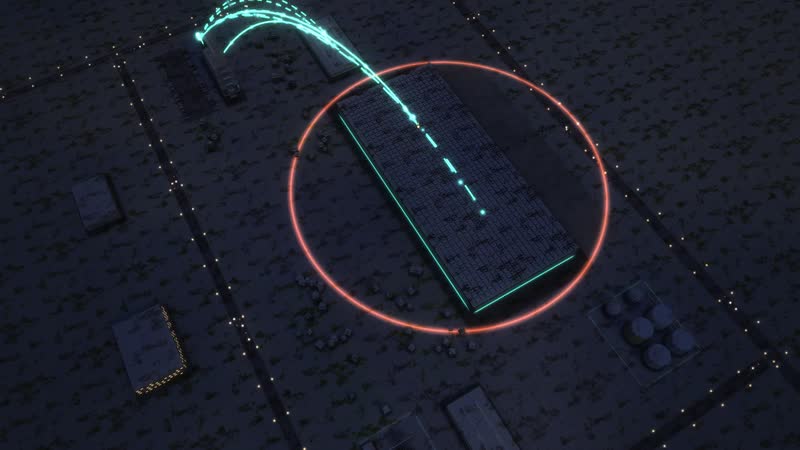
Dusk, performance view – rings of light show how busy each department is. -
A room of its own – Management. -
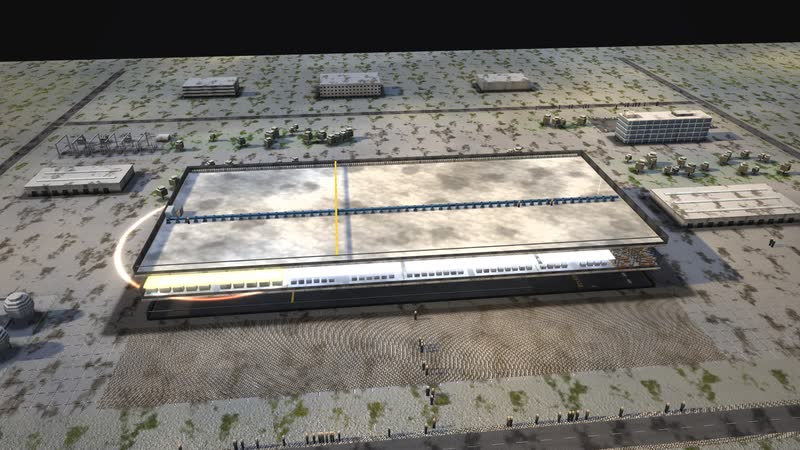
Fab 1 opened up – every floor with workplaces and people. -
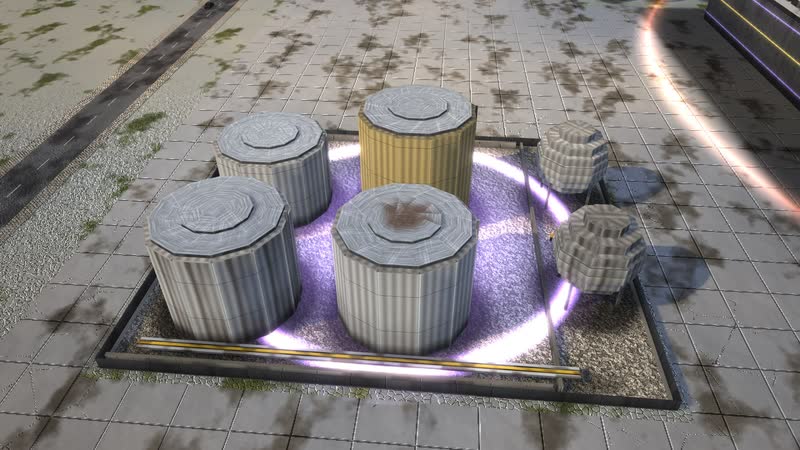
Gas and chemical store – all floors at once, performance view. -
Structure at dusk – golden arcs from every floor to the buildings reporting to it. -
Collaboration – Fab planning and dispatching with all 4 relations – to departments, buildings and partners. -
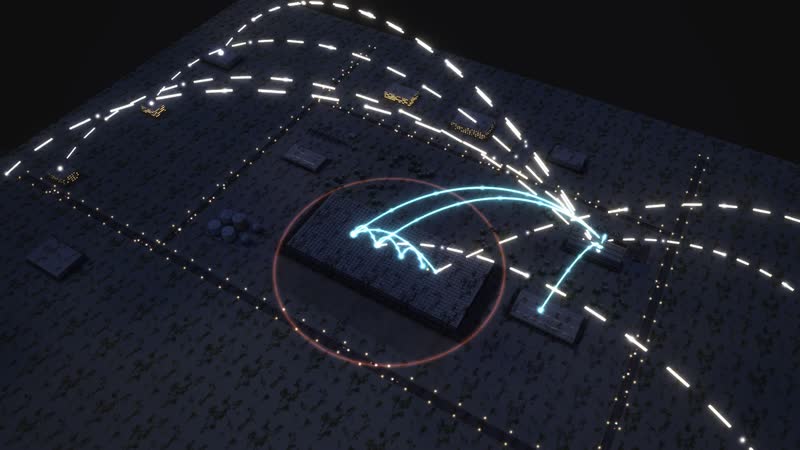
Data flows at night – systems and users linked by glowing lines. -
Data flows at dusk – which department uses which system. -
Structure across the whole site – reporting lines between the buildings. -
The whole network at night – collaboration inside and far beyond. -
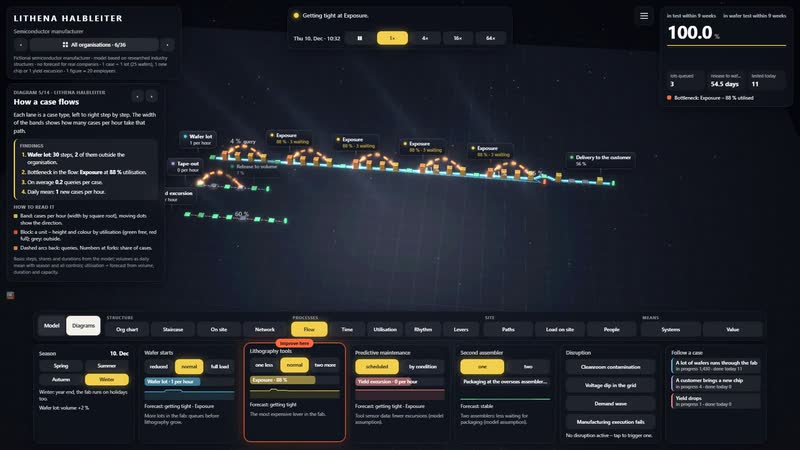
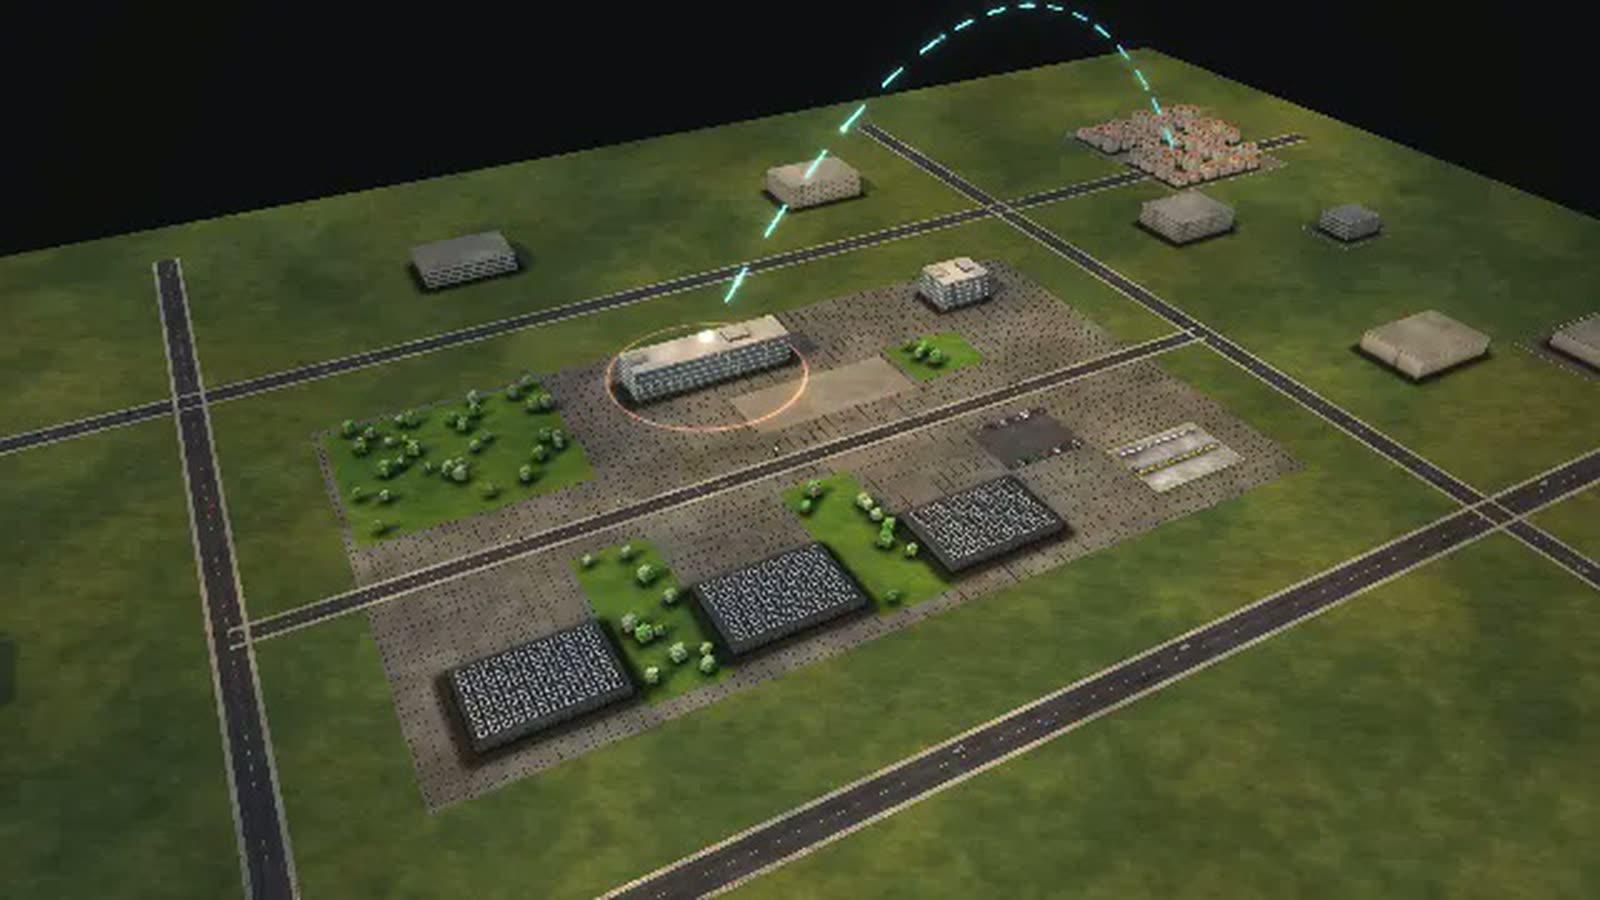
Every step labelled – name, how many are waiting, utilisation. -
Demand wave – resources view, the backlog grows floor by floor. -
Manufacturing execution fails – the data arcs turn red, work stalls. -
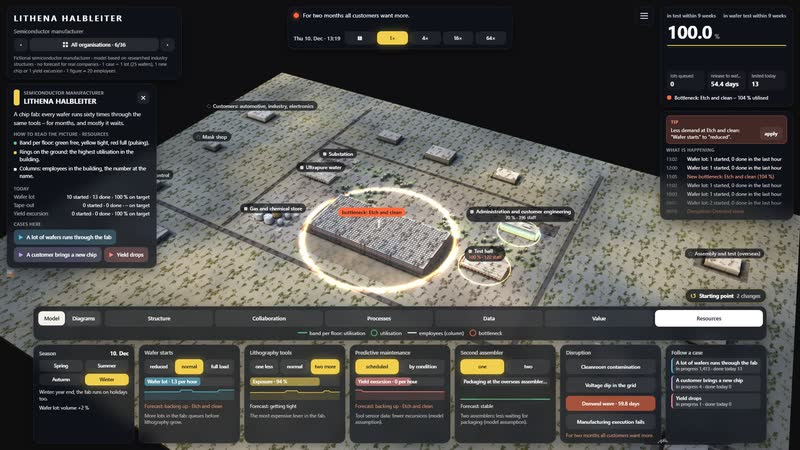
The lever – Lithography tools set to ‘two more’ – a flash shows where it acts. -
Spring at LITHENA HALBLEITER – Administration and customer engineering opened up, rings show the workload. -
Summer evening – warm light, long shadows, golden arcs above the square. -
Autumn – leaves on the paths, performance view. -
Winter evening – snow on the site, Administration and customer engineering open and lit, collaboration glowing. -
Diagram ‘Who works with whom’, calculated live from the model. -
Diagram ‘Year, week, day’, calculated live from the model. -
Diagram ‘Management levels as a staircase’, calculated live from the model. -
Diagram ‘How a case flows’, calculated live from the model. -
Diagram ‘What each control does’, calculated live from the model. -
Diagram ‘What the work depends on’, calculated live from the model. -
Diagram ‘Where it gets tight’, calculated live from the model. -
Diagram ‘Who leads whom’, calculated live from the model. -
The whole software – situation, key figure, time, views and the controls below. -
Administration and customer engineering selected – floor list on the right, the floors drift apart. -
Fab planning and dispatching – card with task, location and all relations. -
Demand wave triggered – timeline, key figure and bottleneck react. -
Countering – Lithography tools increased – the tile shows the effect since the change. -
Diagram ‘How a case flows’ with its panel – findings in sentences. -
Diagram ‘Who works with whom’ with its panel. -
Follow a case – step, waiting time and target on the card. -
The tour leads through the software in eight steps. -
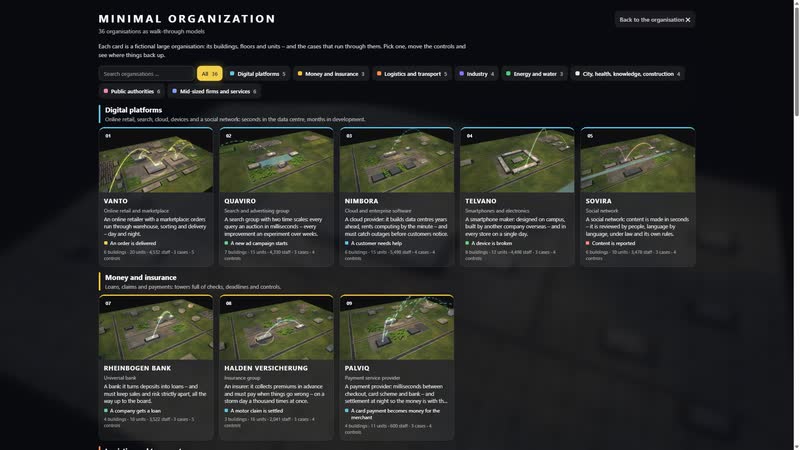
36 organisations to choose from, each with its own picture.


Your fab as a model
Tell us about your fab: which data exist, which questions the model should answer and who will work with it. The password for the simulation comes by email once you ask for it.
cube4tec.de/spiele/minimal-organization/
Chiedere informazioni
Minimal Organization: Halbleiterhersteller
Basis and limits
Fictional semiconductor manufacturer · model based on researched industry structures · no forecast for real companies
1 case = 1 lot (25 wafers), 1 new chip or 1 yield excursion · 1 figure ≈ 20 employees
All volumes, durations, rates and capacities are model assumptions, not values of a real fab.
Twelve mask layers each are bundled into one pass; waiting between tools is combined into one station.
Documented: cycle time of about twelve weeks with hundreds of steps, lithography as the bottleneck, packaging and final test often at other firms in other regions.
Public sources the model is based on:
- SIA/BCG: Strengthening the Global Semiconductor Supply Chain
- SIA: why ramping up production takes time
- SemiEngineering: Battling Fab Cycle Times
- EU Chips Act, VO (EU) 2023/1781
Similar business models
-
Pharmaceutical company
A pharmaceutical plant as a walkable model: follow a batch from the cleanroom to certification by the qualified person and see where the four weeks go.
-
Chemical group with integrated site
A chemical site as a walkable model: see how a polyethylene order runs through the integrated site and which plants stall when the cracker trips.
-
Smartphone maker
A smartphone maker without its own factory as a walkable model: repairs, spare parts, supply chain and product launch in a running simulation.
-
Car manufacturer
A car plant as a walkable model: follow an ordered car through the fixed build sequence and see what happens when the paint shop stops.
-
Special machine builder
A family-owned special machine builder as a walkable model: how a custom packaging line moves from enquiry to site acceptance and where the 28 weeks go.
-
Online retail
An order from click to doorstep as a walkable model: payment check, warehouse, packing, trucks, sortation and delivery in a running simulation.
-
Search engine
A search and advertising group as a walkable model: auctions in milliseconds, experiments over weeks, and a new ad campaign that waits for people.
-
Cloud provider
A cloud provider as a walkable model: support cases, zone outages and new data centres on three time scales, in a running simulation.

All data for LITHENA HALBLEITER are fictional. The model can be fitted to your fab's real data and filled with information that is not visible anywhere today – for example actual lot moves from your MES or maintenance windows for each lithography tool.