
Simulation · Un jeu de CUBE4DEV · UNTERNEHMERAVANTGARDE
Minimal Logistik
How Germany’s supply of goods fits together – freight flows, ports, rail and jams.
-
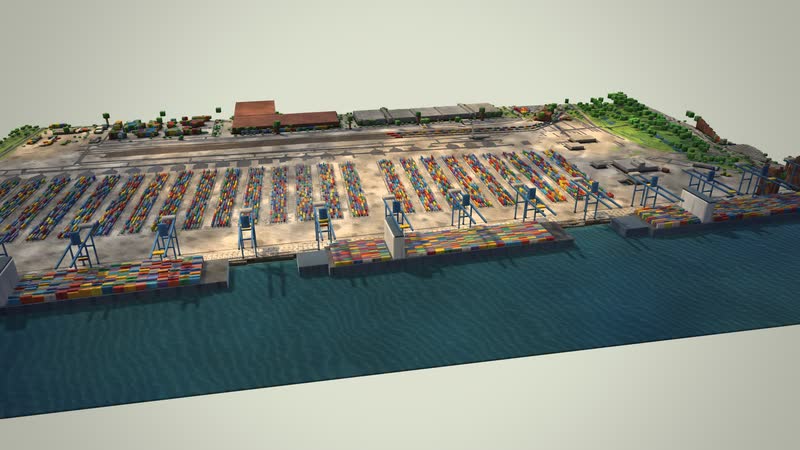
der Container Terminal Altenwerder in Hamburg mit Containerbrücken, Lagerblöcken und Bahnanschluss
Background
Maps and sites are based on open geodata: OpenStreetMap, Terrain Tiles, Geobasis NRW and LGV Hamburg.
Volumes are order-of-magnitude model assumptions, matched to Destatis and port figures – not traffic statistics per route. The page marks this at every figure.
Processes at the sites are accelerated and not to scale; a site’s throughput, stock and utilisation are the same figures as on the map.
Eight places
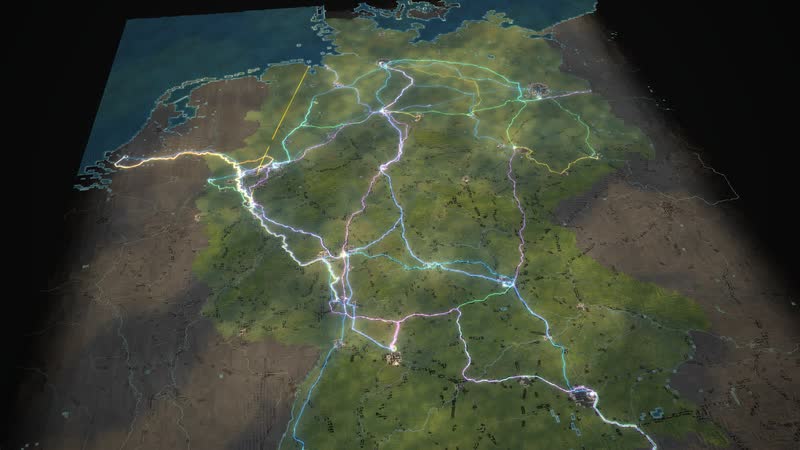
The relief map of Germany and seven detailed sites where the mechanics become visible.
- 01
Germany
- 02
Hamburg · Container Terminal Altenwerder
- 03
Duisburg · logport I (Rheinhausen)
- 04
Dortmund · canal port and Westfalenhütte
- 05
Frankfurt interchange (A3/A5)
- 06
Kornwestheim · intermodal terminal and marshalling yard
- 07
Munich · Riem transhipment station
- 08
Großbeeren · freight village Berlin South
Controls
-
Desktop
Drag the mouse to pan, right button turns, wheel zooms. Keys: 1–4 sliders, ←/→, W winter, E weather, D display, L delivery, A demo, Esc back. Without input the demo starts after 75 seconds.
Minimal Logistik…
Plus +−
Minimal Logistics shows Germany’s main freight flows on a relief map: containers, raw materials, food, industrial goods and energy carriers on road, rail, water and pipeline.
Four big sliders – economy, consumer demand, industrial output, transport cost/tolls – plus summer/winter and extreme weather (low water, snow) instantly change flows, stocks, utilisation and jams. Everything is a scenario comparison with today.
Seven detailed sites explain the mechanics: Port of Hamburg (CTA), Duisburg logport I, Dortmund canal port with the Westfalenhütte plant, Frankfurt interchange, Kornwestheim, Munich-Riem and Großbeeren. An example delivery runs from Rotterdam via Duisburg and Dortmund to an industrial customer.
Comment jouer
Plus +−
- Four sliders: economy, consumer demand, industrial output, transport cost/tolls. Plus summer/winter and extreme weather such as low water and snow.
- Every change is a scenario comparison with today: flows, stocks, utilisation and jams change instantly.
- A detailed site shows throughput, stock and utilisation with the same figures as the map.
- The example delivery runs from Rotterdam via Duisburg and Dortmund to an industrial customer.
Minimal Logistik
How Germany’s supply of goods fits together – freight flows, ports, rail and jams.
cube4tec.de/spiele/minimal-logistik/