
シミュレーション · Minimal Energy · Gas, oil and hydrogen
Wesseling
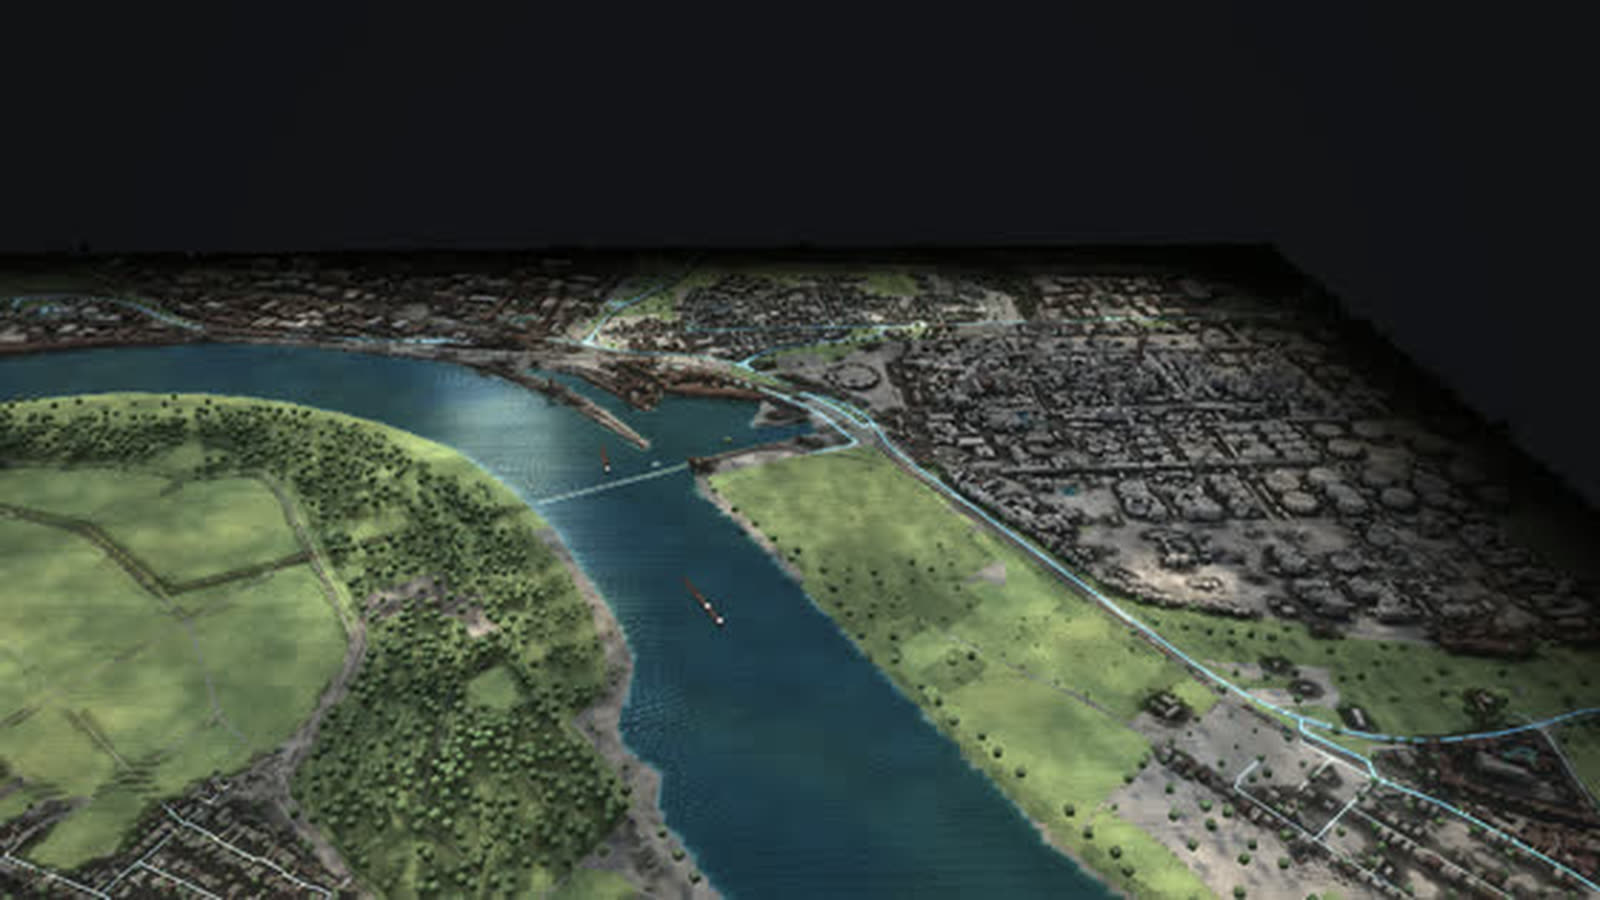
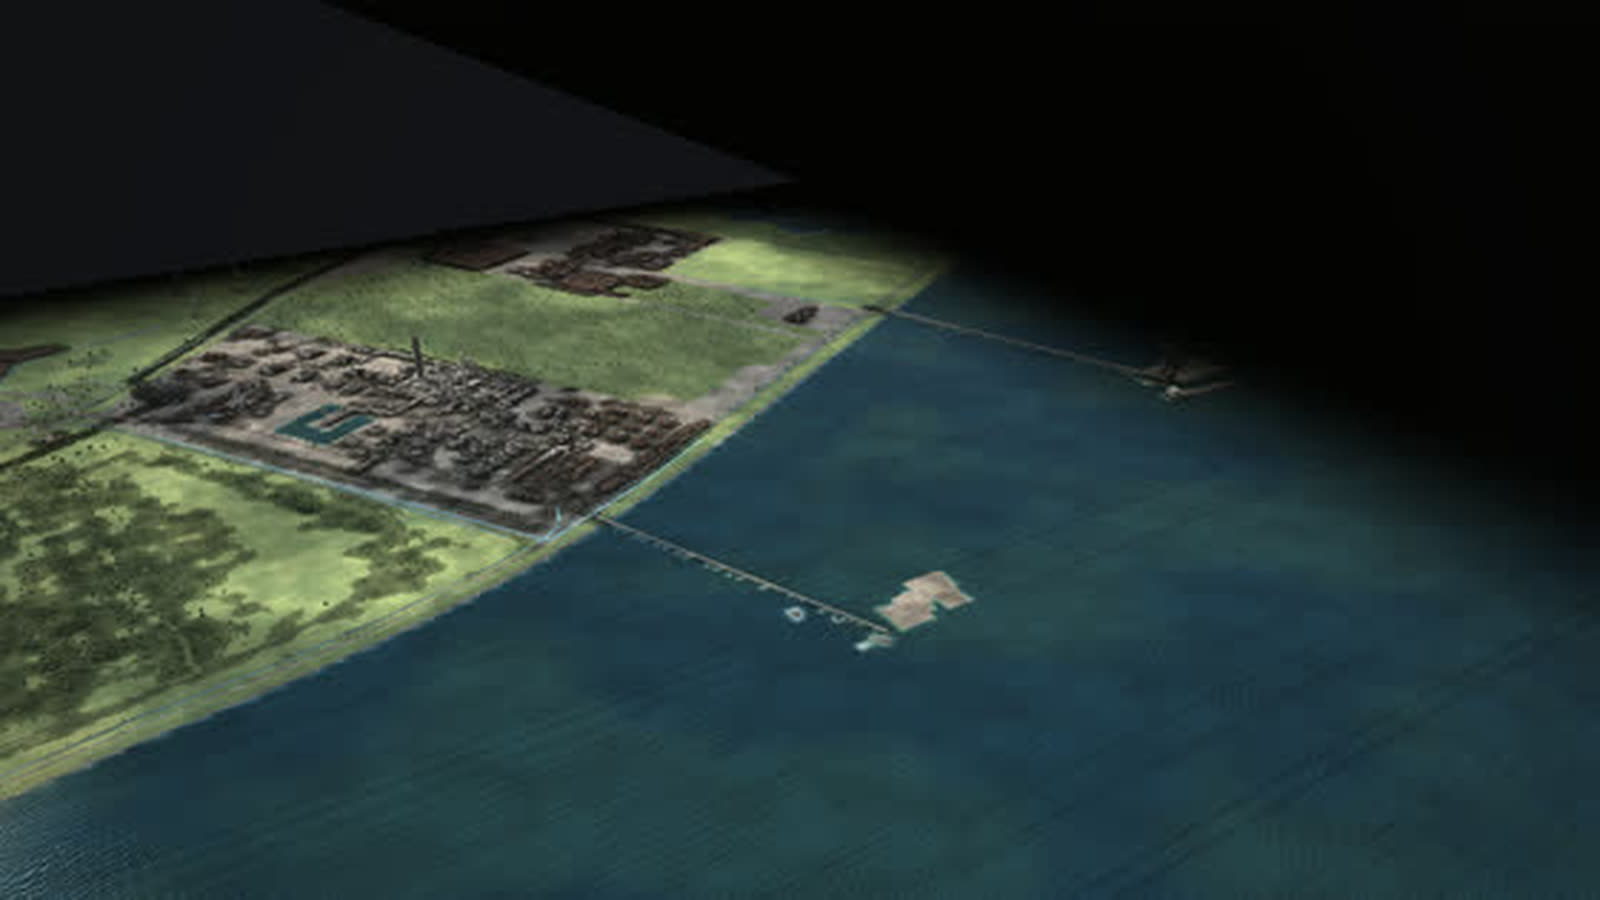
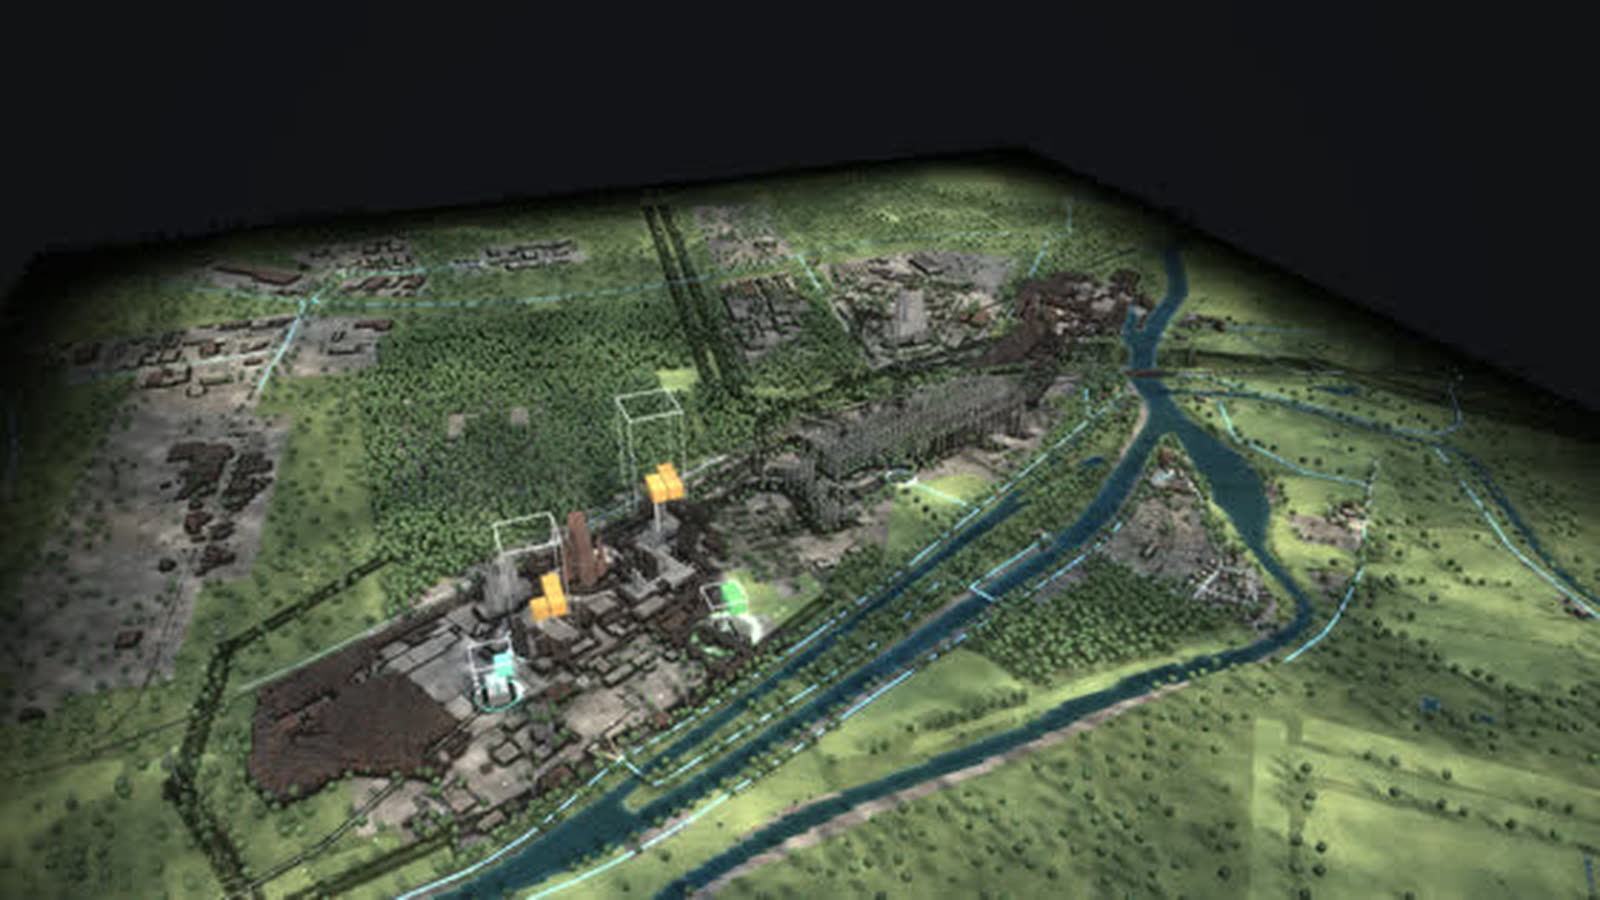
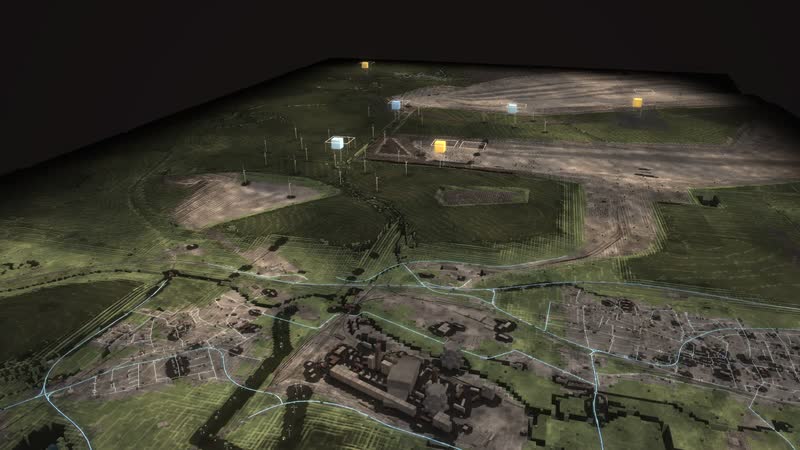
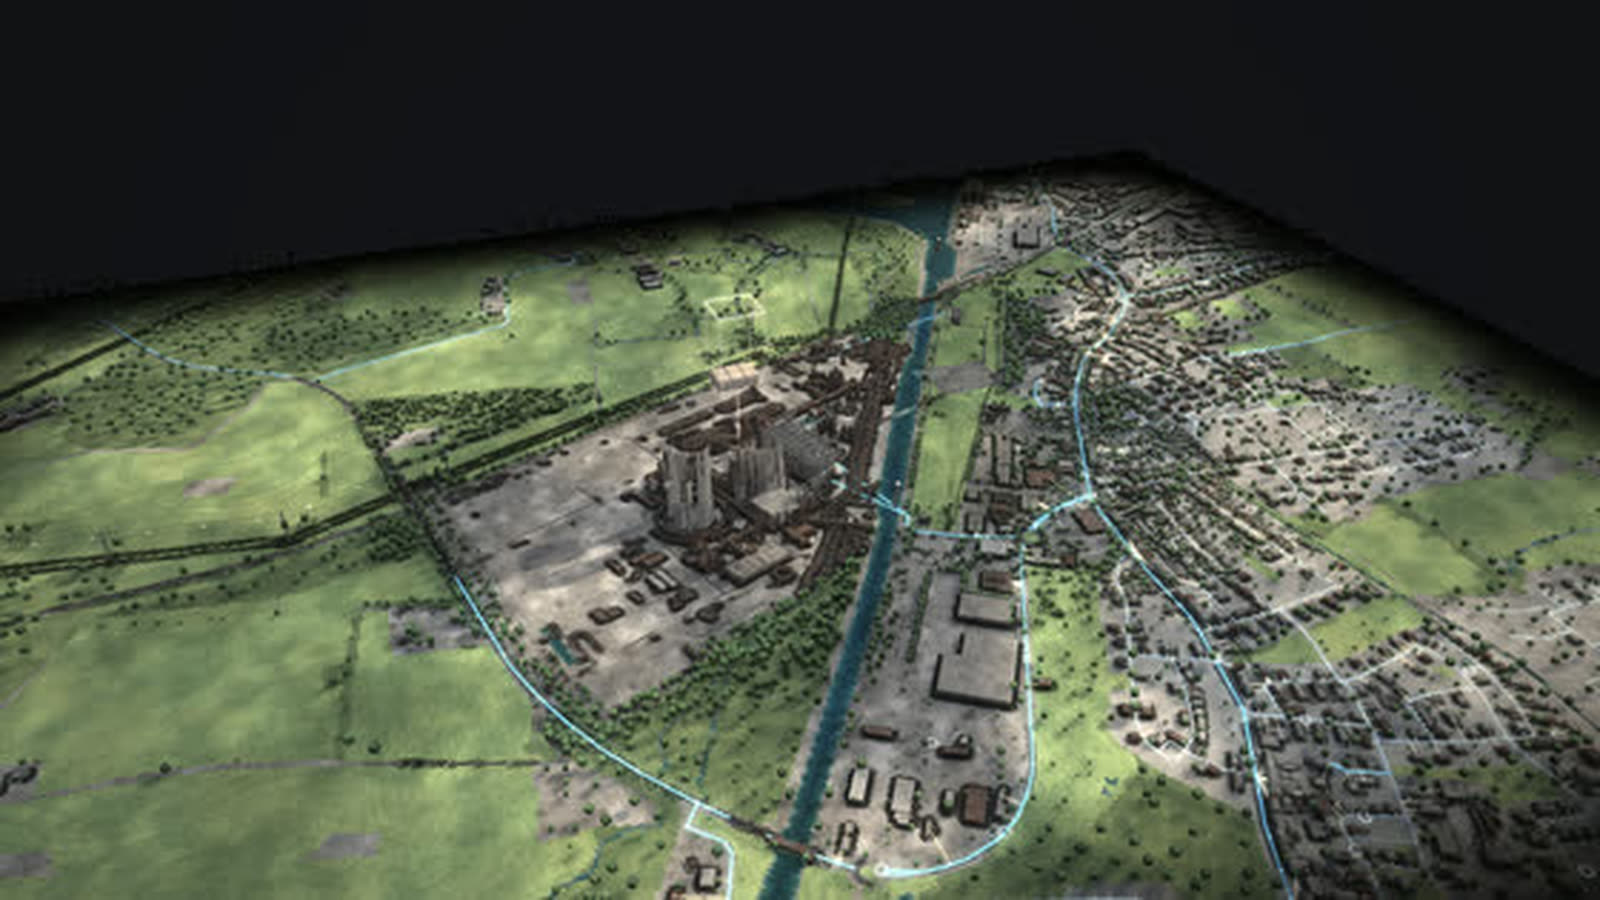
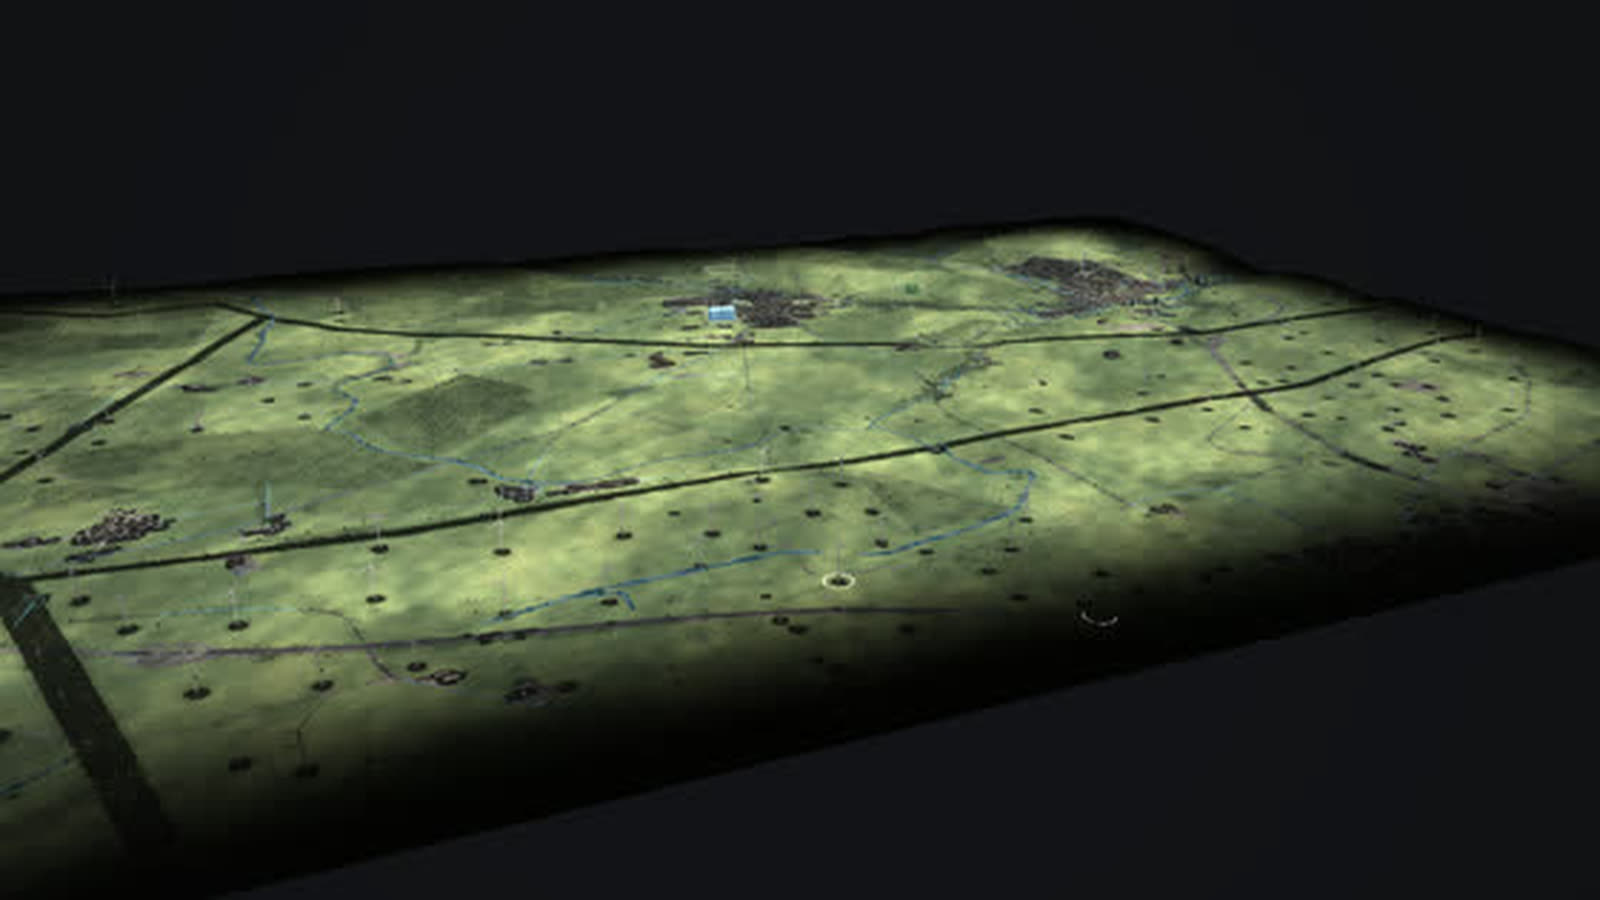
Germany’s largest refinery site as a walkable model: crude oil from Rotterdam and Wilhelmshaven, distillation column, tank farm and Rhine ships – and since 2021 hydrogen made from power.
Real are terrain and buildings (Geobasis NRW, OpenStreetMap), the works, the tank farm and the electrolyser. The position of the crude distillation and of the second electrolyser’s construction site, the crude feed and the ship traffic are schematic. With your data the model shows more, such as throughput per unit, the power demand of the conversion or ship arrivals.
What happens in a refinery? On the Rhine between Cologne and Bonn lies Germany’s largest refinery site with the Godorf and Wesseling works. Crude oil arrives by pipeline from Rotterdam and Wilhelmshaven, is heated in the column and separated by boiling point: gas, petrol, kerosene, diesel, heating oil. Hundreds of tanks store crude, intermediate and finished products; Rhine ships and pipelines carry them to depots, filling stations and industry.
Godorf recently processed about 9.8 million tonnes of crude a year (2024) and carries on. Wesseling processed about 7.5 million tonnes until March 2025; distillation unit D500 was shut down in mid-March 2025, since then the plant has processed no crude at all, and a base-oil plant is to follow by 2028. The 110 kV substations supply power for pumps, compressors and, in future, electrolysis.
Since July 2021 a 10 MW PEM electrolyser, Europe’s largest at the time, has produced about 1,300 t of green hydrogen a year, replacing fossil hydrogen in the refinery. A second plant with 100 MW has been under construction since late 2024, with start planned for 2027 and up to 44 t of hydrogen a day. For everyone who plans or explains industry and energy at one site: operators, municipalities, chambers and associations, schools and universities.
The chain of the place
- 01
Crude oil: Crude oil arrives by pipeline from Rotterdam and Wilhelmshaven.
- 02
Distilling: In the column it is heated and separated by boiling point: gas, petrol, kerosene, diesel, heating oil.
- 03
Storing: Hundreds of tanks store crude, intermediate and finished products.
- 04
Shipping out: Rhine ships and pipelines carry the products to depots, filling stations and industry.
- 05
Hydrogen: The electrolyser makes hydrogen from electricity and replaces hydrogen from natural gas.
- 06
Conversion: Since March 2025 Wesseling no longer processes crude; a base-oil plant is to follow by 2028.
What is shown – why – for whom
| 表示内容 | なぜ | 対象 |
|---|---|---|
| The chain Crude oil – Distilling – Storing – Shipping out – Hydrogen – Conversion | なぜexplains the site in six steps | 対象Schools, visitors |
| Fuels view | なぜmakes oil, gas and hydrogen glow in their colours | 対象Planning, exhibitions |
| Diagram ‘Energy flow now’ | なぜshows how fuels, power, heat and losses flow in this hour | 対象Universities, energy industry |
| Diagram ‘Imports and exports’ | なぜshows power across the borders to the neighbours | 対象Grid planning, associations |
| Diagram ‘Every plant from construction to demolition’ | なぜshows operation, standstill and dismantling of works, distillation and electrolyser | 対象Municipalities, communications |
| Diagram ‘Capacity of this place 1975–2025’ | なぜshows the installed capacity of the site per year by source | 対象Economic development, planning |
| Construction site of the second 100 MW electrolyser | なぜshows what is to be built by 2027 | 対象Municipalities, the public |
Facilities and areas in the model
-
Werk Godorf (Werk Nord)
Crude distillation in Godorf continues, recently about 9.8 million tonnes of crude a year (2024). It yields petrol, diesel, kerosene, heating oil and feedstock for chemistry.
-
Werk Wesseling (Werk Süd)
Until March 2025 Wesseling processed about 7.5 million tonnes of crude a year. Since then the plant has been crude-free.
-
Rohöldestillation D500
This is where processing started: crude is heated and split by boiling point in the column. Unit D500 was shut down in mid-March 2025 (position schematic).
-
Refhyne I
Europe's largest PEM electrolyser at the time, 10 MW, since July 2021: about 1,300 t of green hydrogen a year, replacing fossil hydrogen in the refinery (position OpenStreetMap).
-
Refhyne II construction site
100 MW, investment decision in July 2024, under construction since late 2024, start planned for 2027: up to 44 t of hydrogen a day (position schematic).
-
Tank farms
Crude, intermediate and finished products are stored in hundreds of tanks. Every tank stands here with its outline from OpenStreetMap and its height from the surface model.
-
Umspannwerk Godorf
110 kV: the refinery needs a lot of power for pumps, compressors and, in future, electrolysis (position OpenStreetMap).
-
Station Wesseling
110 kV, grid connection at the Wesseling plant (position OpenStreetMap).
Processes in the model
The chain of the place
- 01Crude oil: Crude oil arrives by pipeline from Rotterdam and Wilhelmshaven.
- 02Distilling: In the column it is heated and separated by boiling point: gas, petrol, kerosene, diesel, heating oil.
- 03Storing: Hundreds of tanks store crude, intermediate and finished products.
- 04Shipping out: Rhine ships and pipelines carry the products to depots, filling stations and industry.
- 05Hydrogen: The electrolyser makes hydrogen from electricity and replaces hydrogen from natural gas.
- 06Conversion: Since March 2025 Wesseling no longer processes crude; a base-oil plant is to follow by 2028.
One day
- 01“Play the day”
- 02the sun moves, wind and demand change every hour
- 03the stacks above the plants grow and shrink
- 04storage charges and discharges
Fifty years
- 01▶ at the year (time travel)
- 021975
- 031995
- 042021
- 052025
- 06plants appear, run, are shut down and dismantled; the history of the place jumps to every year
How an industrial site can use the model
-
Operations and conversion
Works, column, tank farm, substations and electrolyser on one site: the model shows what continues, what has been shut down and what is being built – from crude oil to hydrogen.
対象Operators, site and conversion planning
-
Municipality and industry
Time travel shows 1975, 1995, 2021 and 2025: two works, then the first electrolyser, then the end of crude processing in Wesseling. A picture for talks about land, power demand and industrial transformation.
対象Municipalities, economic development, chambers and associations
-
Schools and universities
What happens in a refinery, and what does it need hydrogen for? The six steps from crude oil via distilling, storing and shipping out to hydrogen and conversion fly to each part.
対象Teachers, vocational schools, process engineering students
-
Exhibitions and visits
In the fuels view the world turns grey, and oil, gas and hydrogen glow in their colours. Every tank stands with its outline from OpenStreetMap and its height from the surface model.
対象Exhibitions, plant tours, visitor centres
-
Public communication
How does crude oil reach Cologne and Wesseling, and what leaves by ship? The model shows pipelines, Rhine ships and tanks, from high above down to eye level with cars, lorries and trains.
対象Public relations, neighbours, policymakers
What you can change
Controls
- Year 1975–2025: plants appear and disappear, mix and grid change; ▶ lets the years run.
- Season: snow, foliage, meadows, chimney smoke; more heat and power demand in winter, more sun in summer.
- Time of day: sun position, dusk, night with windows and street lights; demand follows the daily profile.
- Wind: rotors turn faster, sea state, smoke plumes lie flat; wind power rises, curtailment in a storm.
- Sun: clouds and soft shadows; photovoltaics deliver more or less.
- Demand (households, industry): more lit windows, plant lighting, chimney smoke; more expensive plants step in.
- Views: power, heat, fuels, storage, CO₂ – each with its own columns, stacks and values.
Events
- Winter evening without wind or sun (tiles): Season winter, evening, calm, overcast: demand peaks, the stacks above wind and solar shrink, fossil plants, storage and imports carry the load.
- Stormy night (tiles): Night, gale, low demand: wind delivers more than is needed, storage charges, surplus is curtailed or exported.
What the model gives an industrial site
-
01
Industry in the energy system
The refinery does not stand alone: pipelines from Rotterdam and Wilhelmshaven, 110 kV substations and Rhine ships connect it with the country.
-
02
Conversion made visible
Carry on, shut down, build anew: Godorf, Wesseling and the two electrolysers show side by side how a site changes.
-
03
Every tank in its place
Every tank of the tank farm stands with its outline from OpenStreetMap and its height from the surface model – hundreds of tanks, no symbols.
-
04
Five views
Power, heat, fuels, storage and CO₂ – the same world read five ways, with values right at the plants.
-
05
In the browser and on the big screen
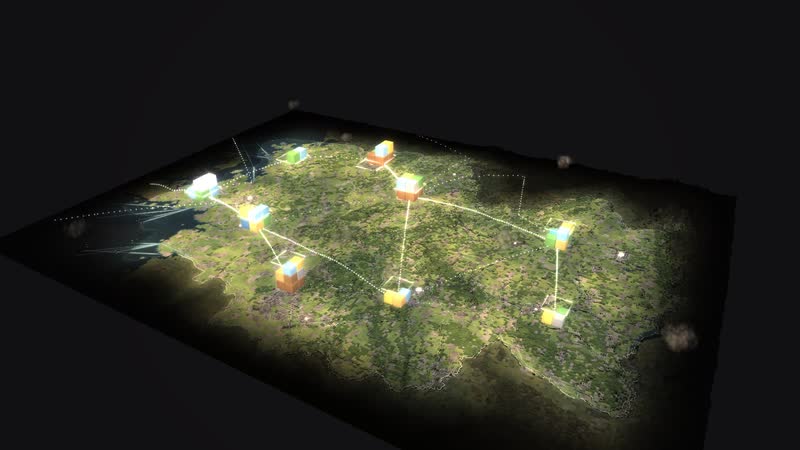
A browser is enough, and large projections work too. Eleven more places and the map of Germany are part of the same model, designed by an artist and developer.
Your plant as a model
Would you like to show your works, your pipelines or your switch to hydrogen this way, with real throughputs and plans? Write to us or give us a call, and we will discuss which data the model needs. We will send you the password to the simulation on request.
cube4tec.de/spiele/minimal-energy/
この件について問い合わせる
Minimal Energy: Wesseling
Basis and limits
Real are terrain and buildings (Geobasis NRW, OpenStreetMap), the works, the tank farm and the electrolyser. The position of the crude distillation and of the second electrolyser’s construction site, the crude feed and the ship traffic are schematic.
Public sources the model is based on:
- Geobasis NRW (dl-de/zero-2.0)
- OpenStreetMap-Mitwirkende (ODbL)
- Wikipedia: Liste der Erdölraffinerien (sekundär)
- eigene Kenntnis / (nicht einzeln geprueft)
More places in the model
-
Wilhelmshaven
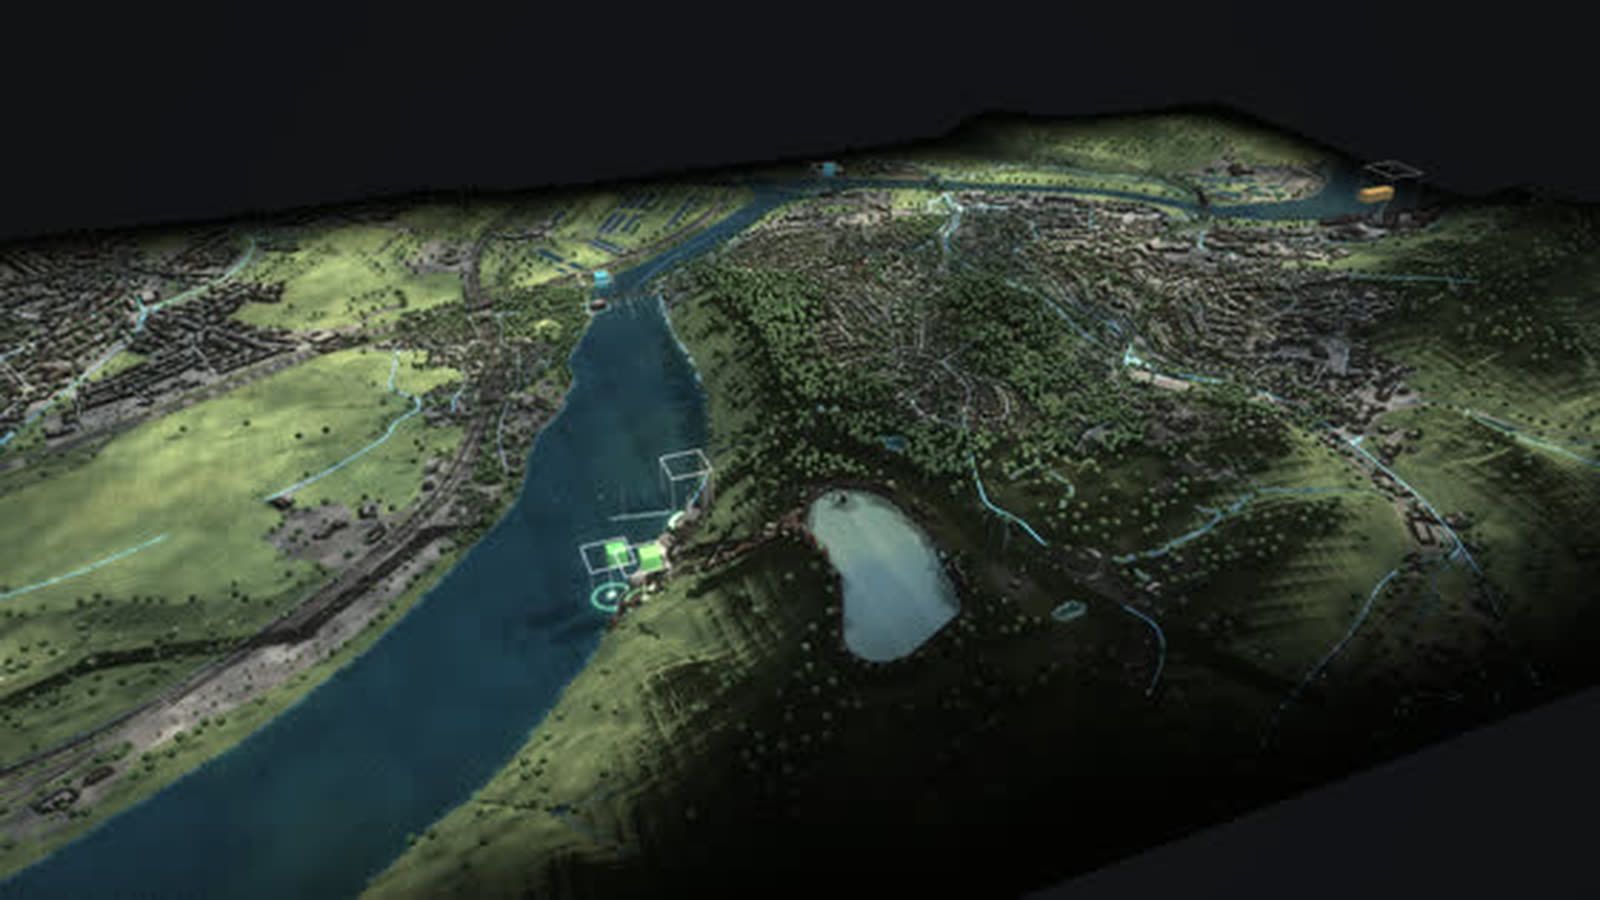
Germany’s only deep-water port as a walkable model: crude oil for the pipeline to the Rhineland, coal for two power plants and, since December 2022, liquefied natural gas from Germany’s first LNG terminal.
-
Lingen
The whole nuclear era in one place as a walkable model: the Lingen nuclear plant of 1968, the Emsland nuclear plant until April 2023, interim storage and dismantling – next to them gas, a battery and hydrogen.
-
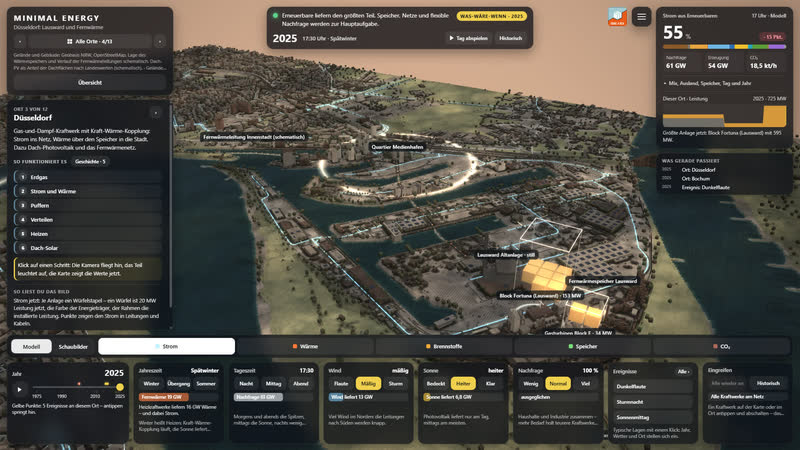
Düsseldorf Lausward
A combined-cycle gas plant on the Rhine as a walkable model: power to the grid, heat via a 58 m storage tank and the district heating line into the media harbour and the city centre.
-
Rhineland lignite district
The Rhineland lignite district as a walkable model: from the Garzweiler mine via conveyors, boilers and cooling towers into the 380 kV grid – while wind, sun and batteries grow on the reclaimed land.
-
Germany 1975–2025
Fifty years of energy supply on one map: 365 sites, ten grid regions and the power of every hour – from two separate grids in 1975 to wind and sun in 2025.
-
Herdecke
Three generations of storage at Lake Hengstey as a walkable model: the Koepchenwerk of 1930, the pumped-storage plant of 1989 and batteries since 2017 – the level in the reservoir follows sun, wind and demand.
-
Datteln 4
Germany’s newest hard-coal plant as a walkable model: coal by ship on the Dortmund-Ems Canal, power for the grid and the railway, district heat as far as Recklinghausen.
-
Paderborn plateau
One of the densest wind landscapes in North Rhine-Westphalia as a walkable model: every turbine with its year, from the 500 kW turbine of 1995 to the 6.2 MW turbine with a 169 m hub.
Real are terrain and buildings (Geobasis NRW, OpenStreetMap), the works, the tank farm and the electrolyser. The position of the crude distillation and of the second electrolyser’s construction site, the crude feed and the ship traffic are schematic. With your data the model shows more, such as thr…